RPV - OMFL: Economic Cycle Prompts 84% Turnover For This Top Multi-Factor ETF
2023-07-27 12:32:14 ET
Summary
- Invesco Russell 1000® Dynamic Multifactor ETF tracks a rules-based Index that selects U.S. securities based on five factors: size, value, momentum, low volatility, and quality. Factors are emphasized based on the economic cycle.
- Portfolio turnover is high because OMFL has been switching between the expansion and slowdown phases, which target entirely different factors. This month, 84% of holdings by weight were substituted.
- However off-putting that may be, the strategy is working. OMFL is a top-performing ETF, and features an extremely reasonable 0.29% expense ratio for what's effectively an actively-managed fund.
- The catch is that OMFL's outperformance is mainly limited to the period before the pandemic. It correctly selected the slowdown phase in Q1 2020, potentially sparing it from an additional 20% decline that would have made its track record far less impressive.
- With the latest changes, OMFL is back to holding a well-diversified portfolio of small- and mid-cap stocks with a $11 billion weighted average market cap. This article highlights this and other key fundamental metrics compared to three alternative ETFs for your review.
Investment Thesis
Invesco Russell 1000® Dynamic Multifactor ETF ( OMFL ) fund managers are at it again. Or rather, its algorithm is. Two weeks ago, OMFL turned over 84% of holdings by weight and is now dominated by riskier small- and mid-cap stocks instead of safer low-beta securities when I evaluated the exchange-traded fund ("ETF") in April. In that review , I expressed concern that the ETF needs more testing. However, this article focuses primarily on OMFL's new portfolio's metrics, which I invite readers to dissect in the comments section afterward. My opinion on the fund is improving as it develops more of a track record, and I look forward to taking you through the latest numbers in more detail below.
OMFL Overview
Strategy Discussion
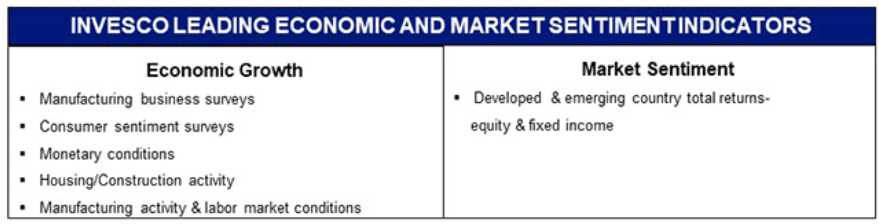
OMFL tracks the Russell 1000 Invesco Dynamic Multifactor Index, selecting securities based on market conditions and a model's determination of the current economic cycle (expansion, slowdown, contraction, and recovery). Invesco provides an overview of the indicators below.
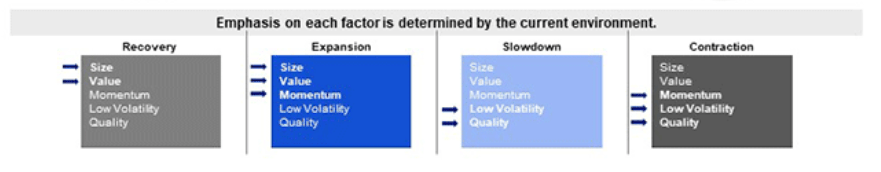
The strategy targets five factors: size, value, momentum, low volatility, and quality. OMFL spent much of its time in the expansion phase, where size, value, and momentum are favored, before switching to the more defensive slowdown phase, where the model emphasizes low volatility and quality. In the graphic below, notice how the expansion and slowdown phases have no overlap, as do the recovery and contraction phases. That means investors should expect drastic portfolio changes.
Top Ten Holdings and Sector Exposures
No one could argue that OMFL was a low-quality fund in April. When it was led by Apple ( AAPL ), Exxon Mobil ( XOM ), and Berkshire Hathaway ( BRK.B ) in April, I calculated a 9.66/10 Profitability Score based on the weighted average scores of its holdings. Downside risk was still present, but high-quality companies are resilient and likely would bounce back quickly after a recession. If I could freeze OMFL for a year or two until we receive more clarity on the economic risks, I would. Unfortunately, that's not possible with rules-based ETFs. In short, my cautionary note had nothing to do with the present holdings. It was more about not agreeing with a switch to a riskier expansion portfolio at the wrong time. Three months later, that's what I must now confront.
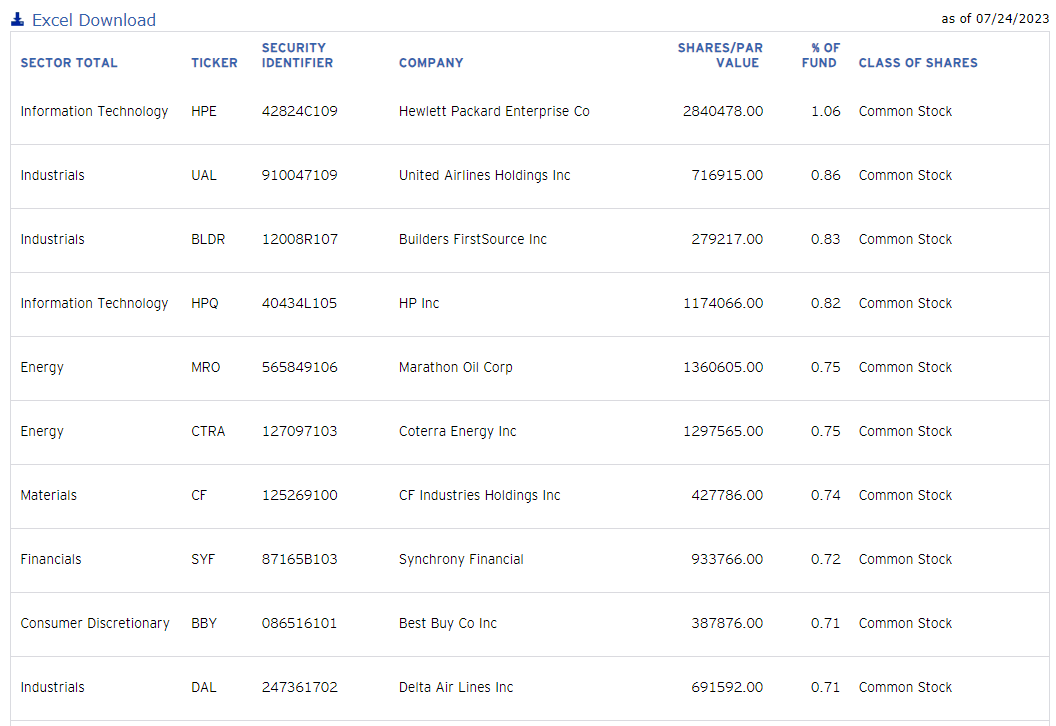
OMFL's top ten holdings are listed below. Instead of the mega-caps, Hewlett Packard Enterprise ( HPE ), United Airlines ( UAL ), and Builders FirstSource ( BLDR ) are at the top of the list, albeit in small allocations. This list totals 7.95%, which is unlikely to provide enough information to judge the fund's composition.
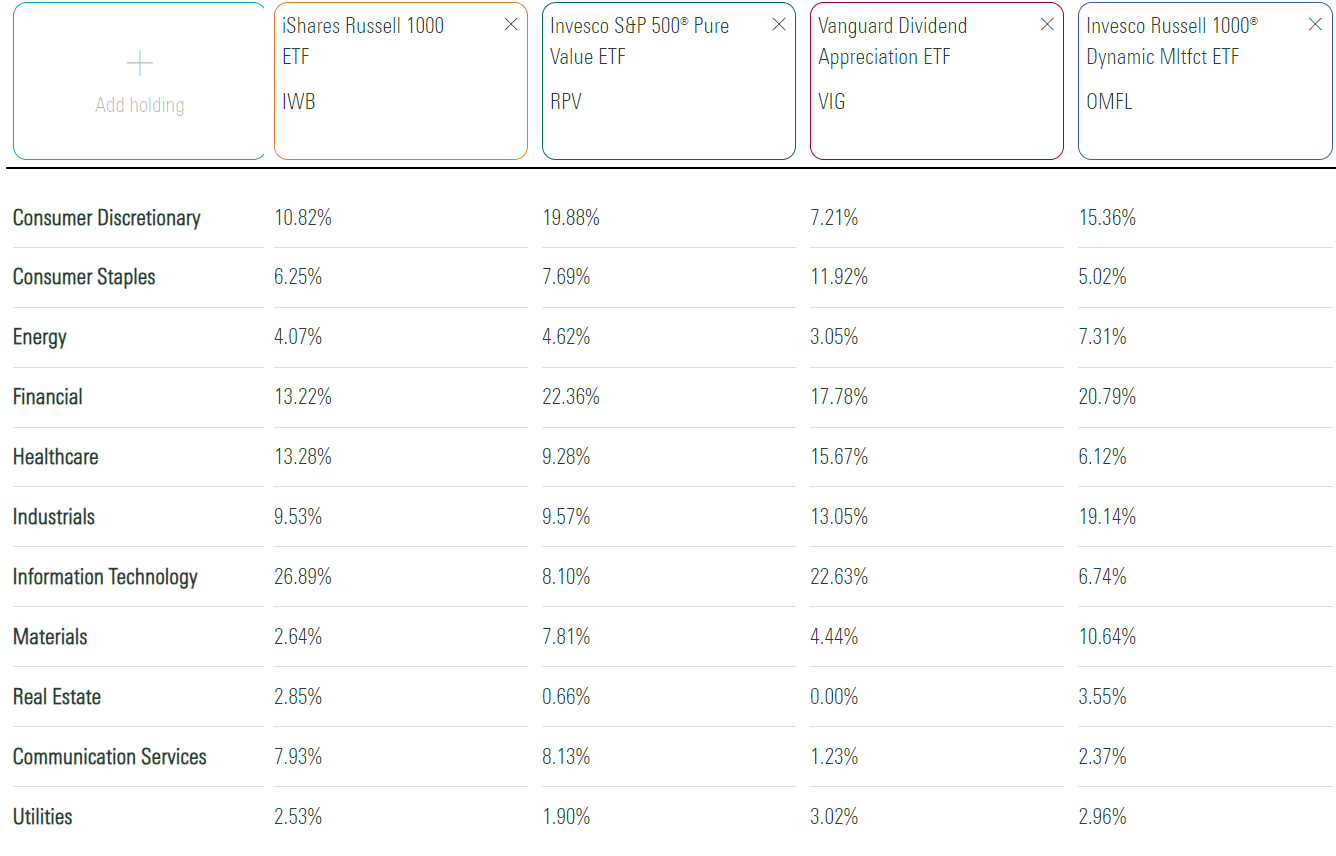
Currently, OMFL overweights Financials (21%), Industrials (19%), and Consumer Discretionary (15%). These exposures sharply contrast with June, when these sectors combined for 30% of the fund, and Health Care (22%) was prominent. Readers might also be surprised by the substantial decrease in Technology exposure (17.34% to 6.74%).
The table above also includes sector exposures for the iShares Russell 1000 ETF ( IWB ), the Invesco S&P 500 Pure Value ETF ( RPV ), and the Vanguard Dividend Appreciation ETF ( VIG ). I chose IWB because it holds securities from the universe with which OMFL selects. RPV is a deep-value fund with parallels to OMFL in the expansion phase, and VIG is an excellent proxy for OMFL's slowdown phase. Interested readers could build their own custom OMFL with RPV and VIG. However, they'll still need to know which ETF to overweight at any given time. The benefit of OMFL is that it decides for you for a low fee. Its expense ratio is just 0.29%.
OMFL Analysis
Fundamentals By Industry
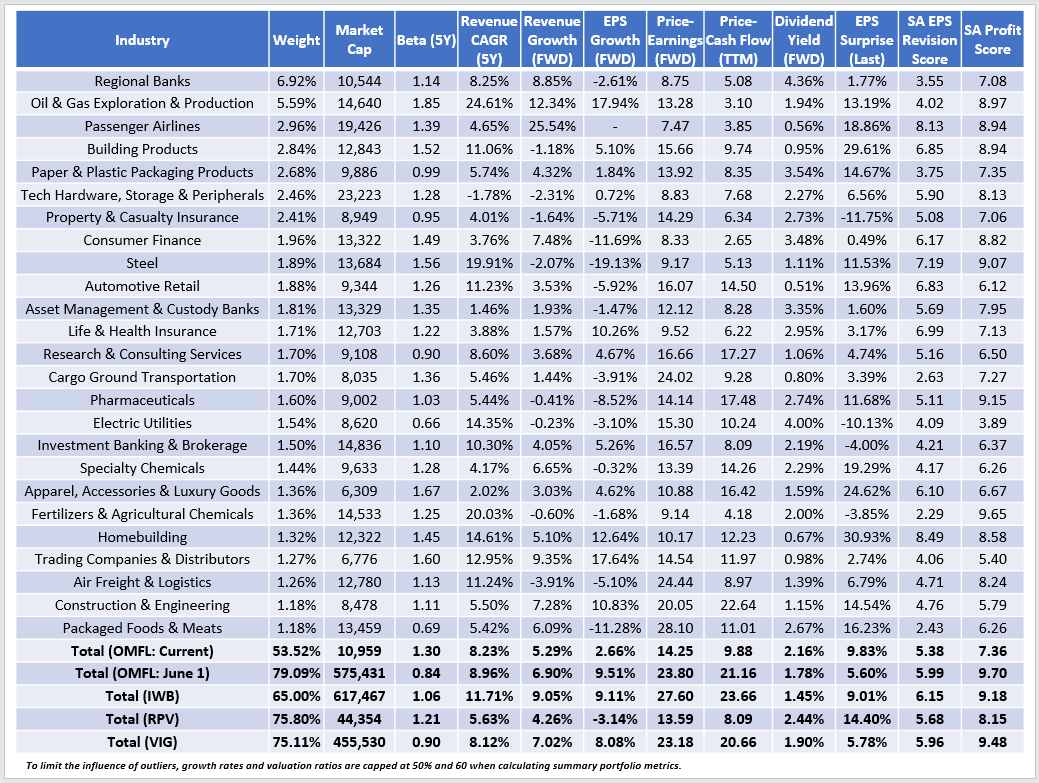
An industry-level analysis is most appropriate, since OMFL is not highly concentrated in its top holdings. The following summary of OMFL's top 25 industries totals 53.52% of the fund and includes metrics for IWB, RPV, VIG, and OMFL's previous portfolio as of June 1, 2023.
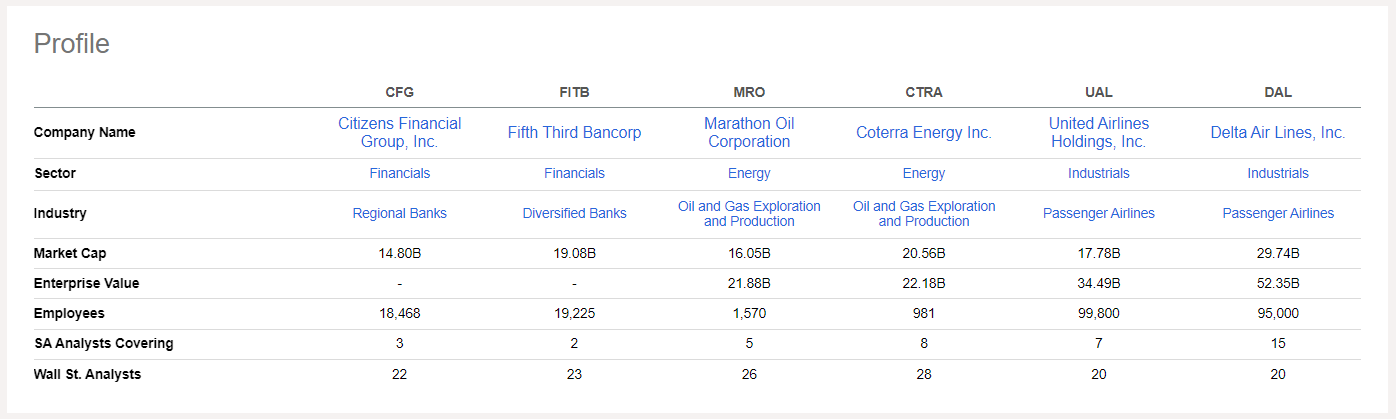
Instead of the previous dominance by mega-cap stocks, OMFL is now much more diversified. Regional Banks (6.92%) is the leading industry, followed by Oil & Gas E&P (5.59%) and Passenger Airlines (2.96%). The top two holdings from these industries are summarized below, with market caps between $14.80 billion and $29.74 billion. The latter figure is for Delta Air Lines ( DAL ), which is up 41.34% as airline stocks make a comeback.
OMFL's weighted average market cap is now $10.96 billion compared to $575.43 billion before. However, size was just one of the significant changes. Notice how the portfolio's five-year beta increased dramatically from 0.84 to 1.30. Estimated earnings growth declined by about 7%, though the portfolio trades at just 14.25x forward earnings and 9.88x trailing cash flow. Finally, OMFL's profitability score fell from 9.70/10 to 7.36/10. These metrics aren't available on Seeking Alpha, but I derived them based on individual Grades.
These changes demonstrate how OMFL's model works as advertised. Recall how the model emphasized the low volatility and quality factors in the previous "slowdown" portfolio, evidenced by a 0.84 five-year beta and 9.70/10 profit score. The current "expansion" portfolio, which emphasizes size, value, and momentum, is now on display. OMFL's holdings are much smaller in size and trade at cheap valuations. While not listed above, OMFL's holdings are 9.10% above their 100-day moving average prices. In contrast, the previous "slowdown" portfolio is up 5.82%. In short, despite the drastic changes, they make perfect sense.
In my view, OMFL's current portfolio isn't necessarily better than RPV's. Its 2.66% estimated earnings growth rate is 5.80% higher, and its valuation is virtually identical. However, its 7.36/10 Profit Score is lower by 0.79 points, and my analysis also reveals a potential weakness not factored into OMFL's model: weak earnings momentum, which is different than price momentum. Last quarter, OMFL's holdings surprised to the upside on earnings by 9.83% compared to 14.40% for RPV. In addition, using Seeking Alpha Factor Grades, I've calculated a 5.38/10 EPS Revision Score for OMFL vs. 5.68/10 for RPV. Logically, one would expect price momentum to correlate with earnings momentum, and since this isn't the case, I wouldn't be surprised if a short-term pullback occurs.
Performance Analysis
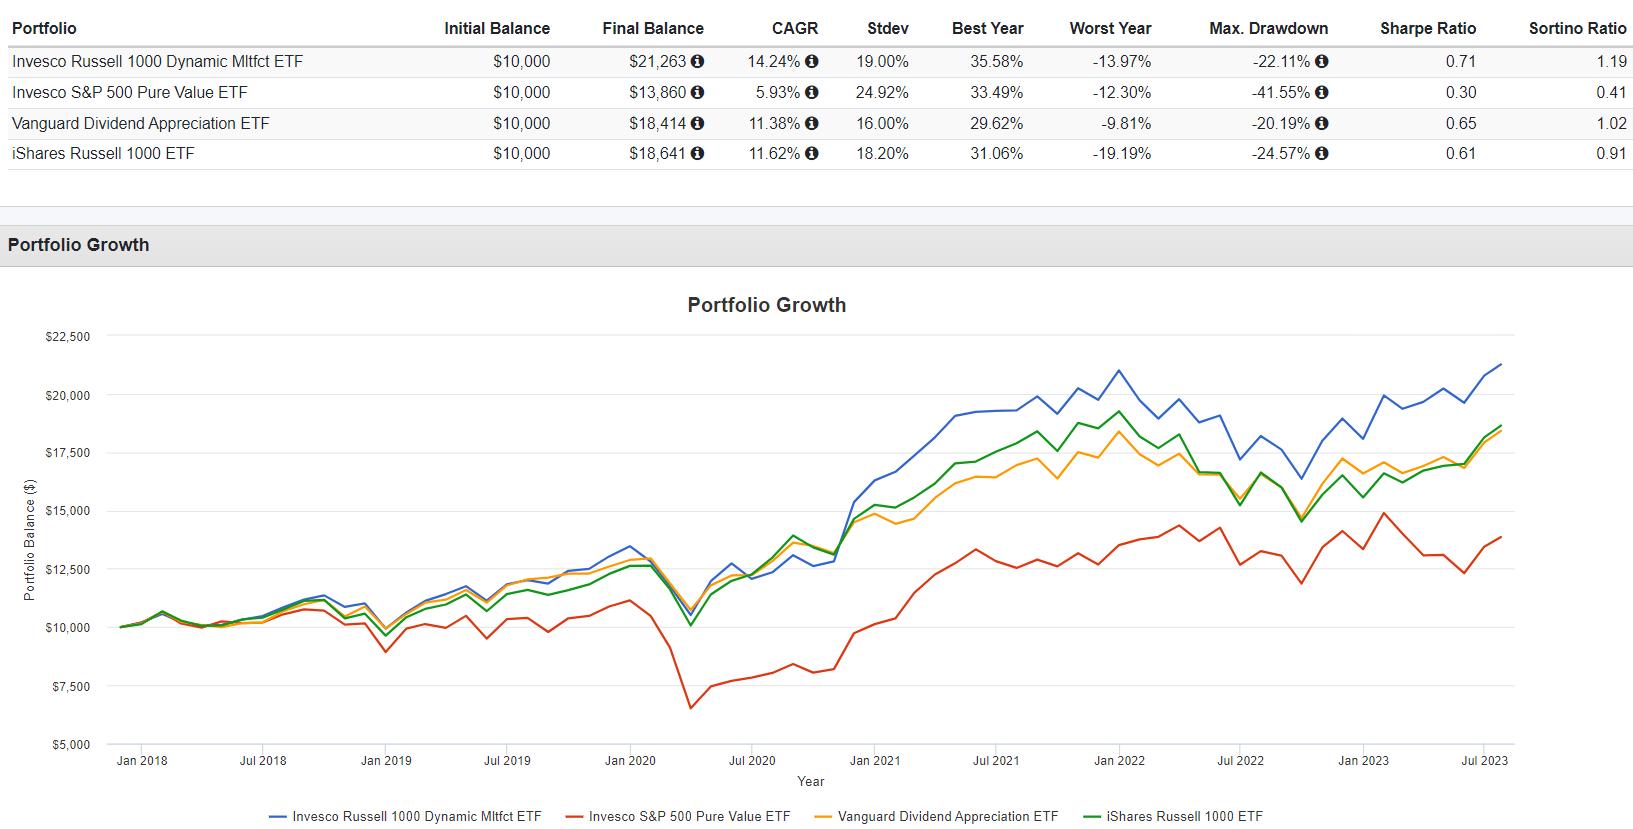
OMFL's track record to date is exceptional. Since November 2017, it's delivered an annualized 14.24% gain compared to 5.93%, 11.38%, and 11.62% for RPV, VIG, and IWB. Its risk-adjusted returns (Sharpe and Sortino Ratios) and maximum drawdown figures were better, too.
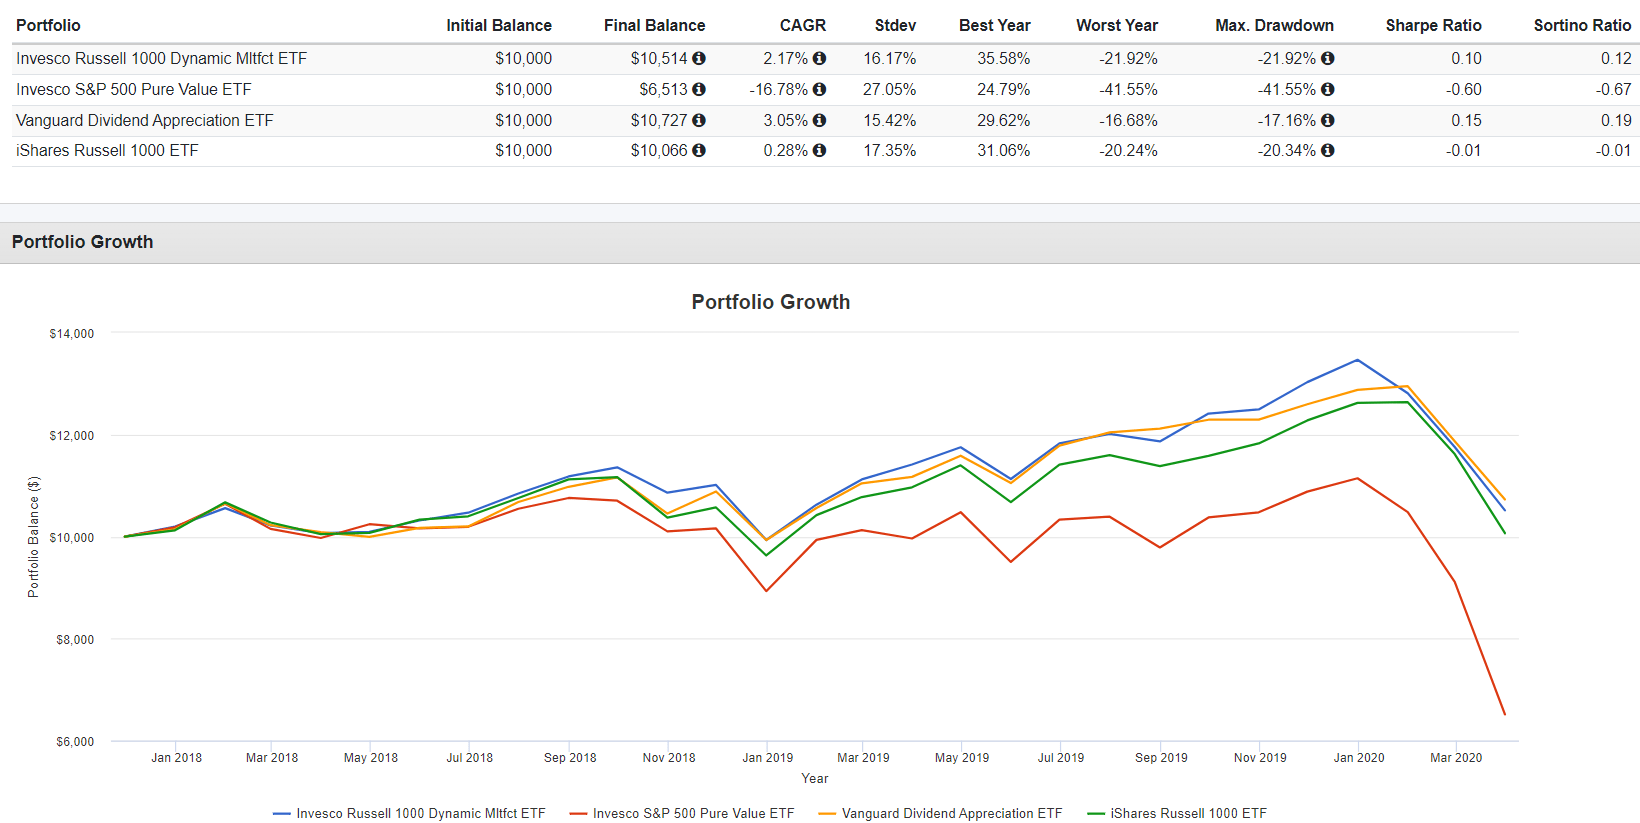
Interestingly, we can reach a different conclusion if we divide OMFL's results into two periods: pre- and post-pandemic. Here is the same chart between November 2017 and March 2020, when markets crashed.
RPV got crushed in the pandemic crash, and you'll find that's what happens to these deep-value portfolios in recessions. OMFL did much better because it was in the "slowdown" phase, which I've deduced by examining the holdings listed in its semi-annual report dated February 28, 2020. Apple (( AAPL) ), Home Depot ( HD ), and Procter & Gamble ( PG ) are just some of the prominent names listed on the Schedule of Investments . VIG also did well because it consistently targets high-quality, low-volatile stocks, similar to what OMFL calls for in the "slowdown" phase.
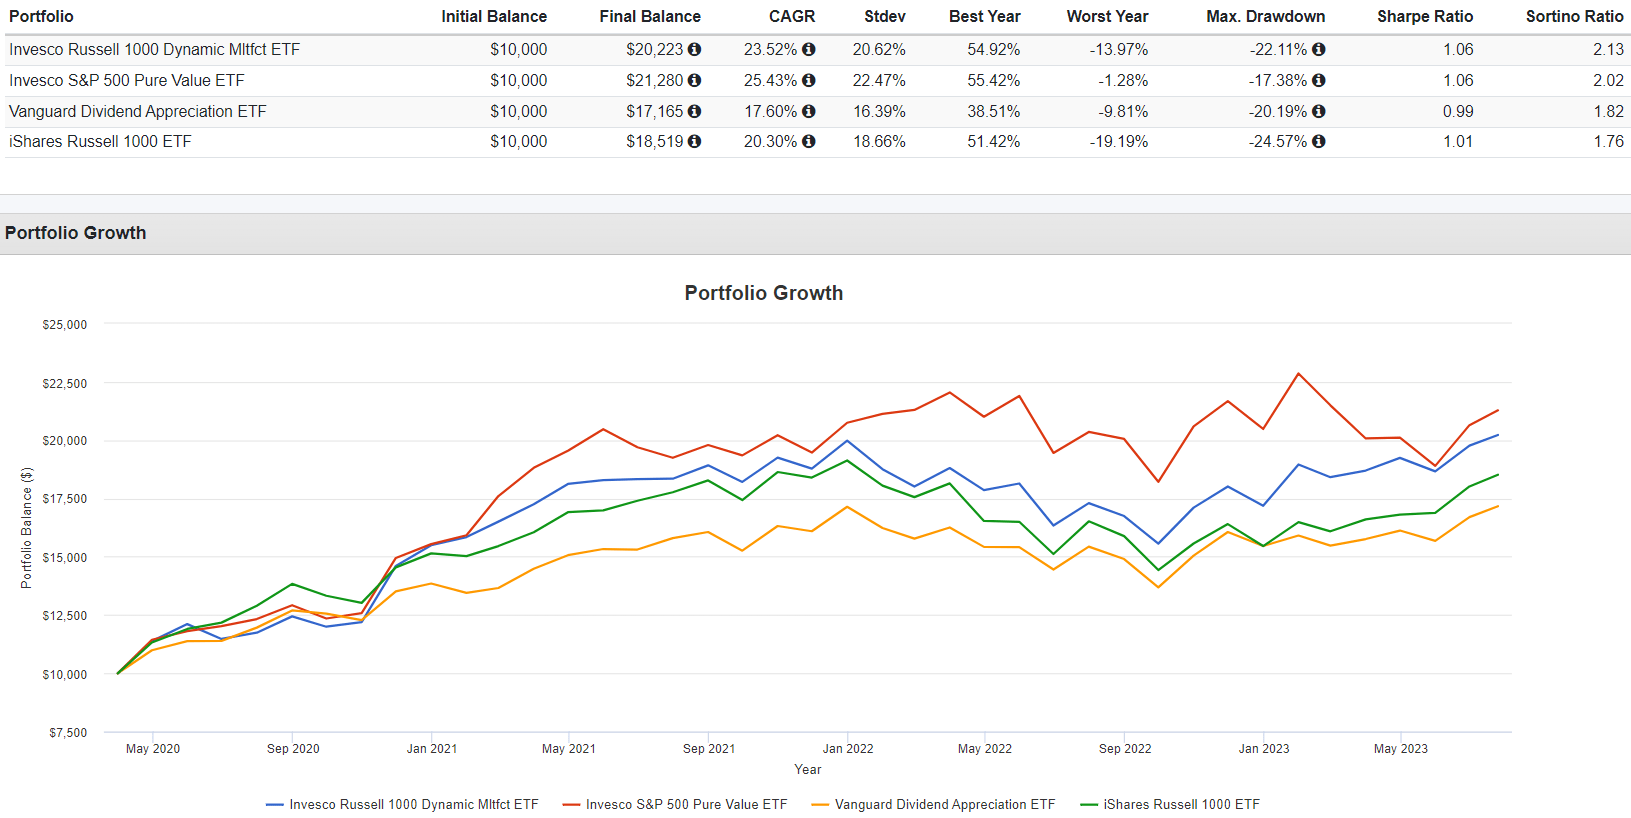
The following chart highlights returns since April 2020 and, perhaps surprisingly, shows how RPV outperformed OMFL by an annualized 1.91% (25.43% vs. 23.52%). I don't think OMFL's advantage is designing great portfolios for each of the four economic cycles. Instead, the benefit is a semi-active management approach and the model's ability to correctly assess the current economic cycle. Even ignoring all the necessary trading activity, regular investors would likely create taxable events that the ETF structure avoids. OMFL simplifies things, and that's a huge benefit.
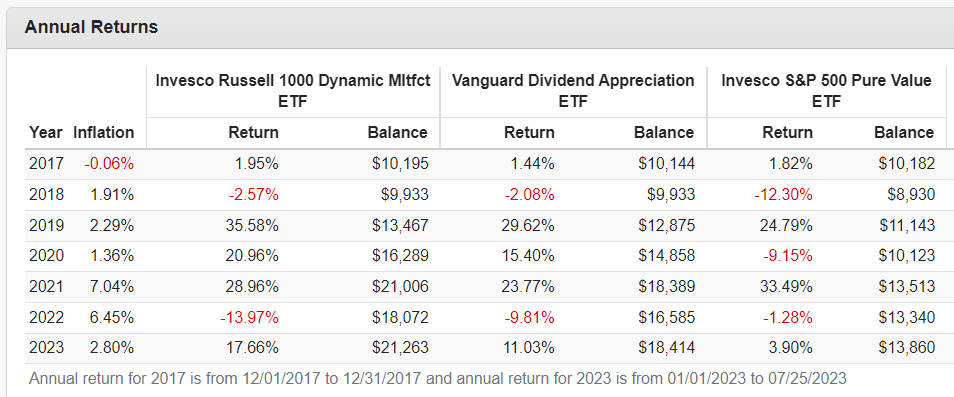
OMFL is also having an exceptional year, up 17.66% compared to 11.03% and 3.90% for VIG and RPV. It's now erased its 13.97% loss from last year and is up 1.23% in total since January 2022 compared to 0.13% and 2.57% for VIG and RPV. Annual returns for the three ETFs are below.
Investment Recommendation
OMFL is a challenging fund to rate. On the one hand, its total returns since its inception are terrific, and it seems reasonable to hold a small position to follow changes in the economic cycle based on objective information. On the other hand, OMFL hasn't outperformed its proxies much since Q1 2020, when it correctly selected the slowdown phase. If the returns for RPV and similar deep-value funds ( SPVM , XMVM , RFV , RZV ) are any indication, OMFL's track record would be less impressive if its model selected the expansion phase instead. As a reminder, the current phase is the riskiest.
Fundamentally, OMFL offers better growth than RPV with a similar valuation. The downside is a lower profitability score and weak earnings momentum that aligns differently from the recent strong price momentum. Still, I expect to enter a small position over the next few weeks if OMFL's share price declines. This way, I can better track economic cycle changes, and if they prove successful, OMFL will likely influence my investment strategy moving forward. I hope you found this information helpful, and as always, I look forward to continuing the discussion below. Thank you for reading.
For further details see:
OMFL: Economic Cycle Prompts 84% Turnover For This Top Multi-Factor ETF