VIG - OMFL: Top Performing Multifactor ETF Entering Unchartered Territory
2023-04-03 02:38:11 ET
Summary
- OMFL is a multifactor ETF that reconstitutes as frequently as monthly based on where we are in the business cycle: recovery, expansion, slowdown, and contraction.
- Fees are fair at 0.29%, considering how OMFL's five-year trailing returns were among the best of any large-cap fund, including growth-oriented ones.
- My analysis reveals a few potential flaws in the selection process. For example, its short track record means the strategy is untested in the recovery and contraction phases.
- It appears the Index goes "all-in" on a particular phase, regardless if it's only a minor advantage over another phase. Also, the Index is free to move back and forth between phases rather than progress linearly, as you might expect with a cycle.
- This was a really hard call to make, complicated by OMFL's outstanding current fundamentals. However, I think it's best for investors to wait until the model is more clear on which phase we're in, so I've given OMFL a firm "hold" rating today.
Investment Thesis
Today's article explains why I'm skeptical of the Invesco Russell 1000 Dynamic Multifactor ETF ( OMFL ), the third-best-performing large-cap ETF over the last five years. My view may be controversial among investors who prioritize past performance. However, I hope to provide value by highlighting some perceived flaws. For example, there is no middle ground when OMFL's model assigns a business cycle phase. Probabilities could be a 51% slowdown and a 49% expansion, but the Index goes all-in on slowdown despite the apparent uncertainty. Second, the model appears free to go back and forth between phases rather than moving linearly, like how you would expect a "cycle" to operate. This feature causes unusual and possibly unnecessary trading activity, most recently in March when OMFL did a 180-degree turn on the volatility, growth, and quality factors.
I don't want to dismiss OMFL's exceptional track record. However, the strategy is untested because the economy has spent a mere one quarter in the contraction phase since the Great Financial Crisis. That's not a mark for or against OMFL but simply a consequence of its November 2017 inception date. Due to this uncertainty and the perceived flaws, I've decided to give OMFL a firm "hold" rating, but I look forward to covering it regularly as we approach a possible recession in 2023.
OMFL Strategy
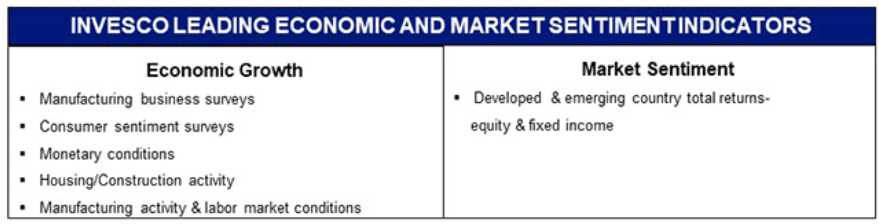
OMFL tracks the Russell 1000 Invesco Dynamic Multifactor Index, using a rules-based approach to re-weight securities according to market conditions and economic cycles (expansion, slowdown, contraction, recovery). This overview is on OMFL's fund page , with the economic and market sentiment indicators used as follows:
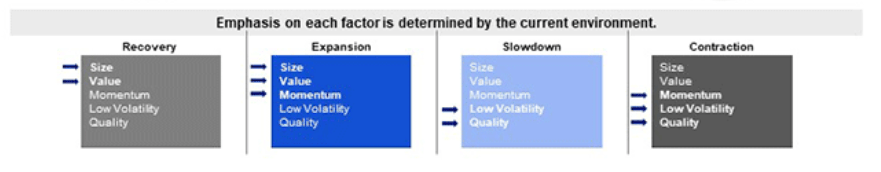
The following graphic helps us understand how the Index selects stocks based on the perceived economic cycle. Size and value factors are emphasized in the recovery and expansion phases, while low volatility and quality are preferred in the slowdown and contraction phases. The model also emphasizes momentum in the expansion and contraction phases.
The Index provider does not identify which cycle is favored at each reconstitution, which may happen as frequently as monthly. However, researchers at Fidelity commented that the United States "is in the late-cycle expansion phase with a rising likelihood of a recession in 2023". An archived version notes that the country was in the same late-cycle expansion phase with only a moderate recession risk in November 2022 . Researchers identified a "mature" expansion phase in May 2022 and mid-cycle expansions in November 2021 and August 2021 .
These movements help explain why OMFL's fundamentals changed so significantly in March. To illustrate, I included OMFL's fundamental statistics in my review of the Invesco FTSE RAFI US 1000 ETF ( PRF ) three weeks ago. At the time, the portfolio had a 1.26 five-year beta, traded at 13.94x forward earnings, and had a 7.13/10 profitability score, consistent with the expansion phase. Today, OMFL's five-year beta is 0.84, trades at 20.83x forward earnings, and has a 9.66/10 profitability score, consistent with the slowdown phase where the model emphasizes volatility and quality.
The two versions are night and day. However, you might be surprised that the model emphasized the same factors in December 2022. That means that selections were based on the slowdown phase, then the expansion phase, and now the slowdown phase again, all in three months. It's an incredible amount of activity for a model unsure where we are in the business cycle. Based on these movements, we can draw the following two conclusions:
1. The Index has no middle ground. If inputs indicate we're between two phases, the model will go "all-in" on the phase with the highest probability score, however negligible the advantage.
2. The Index is free to switch back and forth between phases rather than move through them linearly, contrary to how a "cycle" operates. It begs the question: should the model only make drastic changes once it's reasonably sure the economy has moved into another phase? OMFL's latest turnover rate is 336%, so I'm confident the model's answer to that question is "no."
Before turning to OMFL's performance history, it's important to note that the fund is untested. According to the National Bureau of Economic Research , the U.S. entered the expansion phase after the Great Financial Crisis in Q2 of 2009, where it spent a record 128 months before contracting in February 2020. The brief contraction lasted less than a quarter, with a trough in April 2020. The NBER references just two broader cycles (expansion and contraction) compared to OMFL's four, but it's evident there have been few hardships since OMFL's November 2017 launch. We don't know how OMFL will perform in the market downturn Fidelity researchers expect.
OMFL Performance
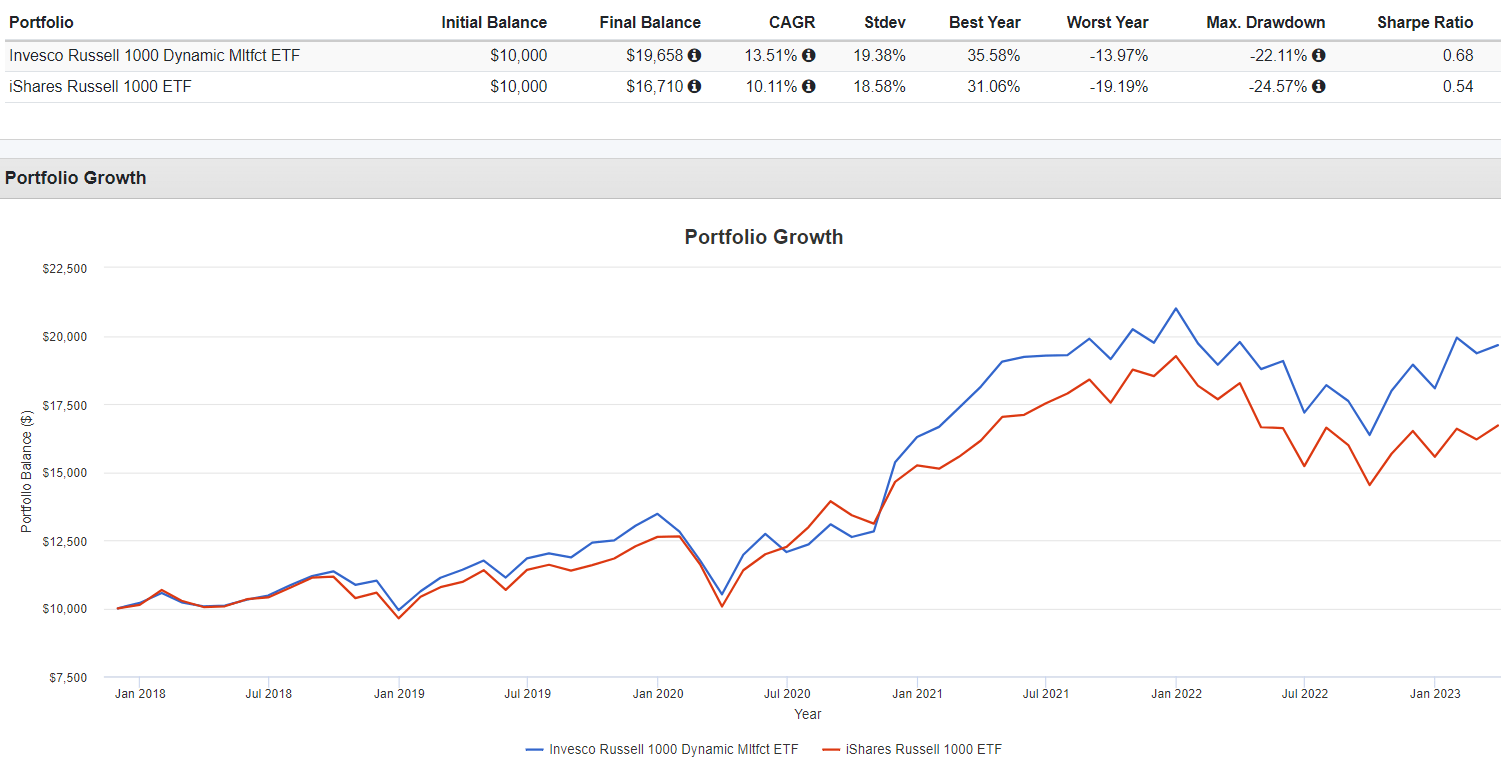
I mentioned earlier how OMFL was the third-best-performing large-cap ETF in the last five years out of 170+ alternatives. Besides the Invesco QQQ ETF ( QQQ ) and the iShares Russell Top 200 Growth ETF ( IWY ), OMFL has beaten every other large-cap fund you could think of and deserves a lot of credit. I've benchmarked OMFL against the iShares Russell 1000 ETF ( IWB ) to keep things simple. OMFL outperformed by 3.40% per year (13.51% vs. 10.11%) with only a slightly higher standard deviation.
Here are a few additional statistics you might find helpful.
- Monthly Win Rate: 57.8% (37/64)
- Annual Win Rate: 100% (5/5, full years only)
- Average Monthly Outperformance: 0.27%
- Median Monthly Outperformance: 0.48%
- Best Month: November 2020 (8.10% beat)
- Worst Month: June 2020 (7.52% miss)
These are terrific numbers and will help shape my view on portfolio construction during the expansion phase of the business cycle. The critical question is whether OMFL will succeed in the contraction and recovery phases. We're alternating between expansion and slowdown, so it's a guessing game, at least momentarily.
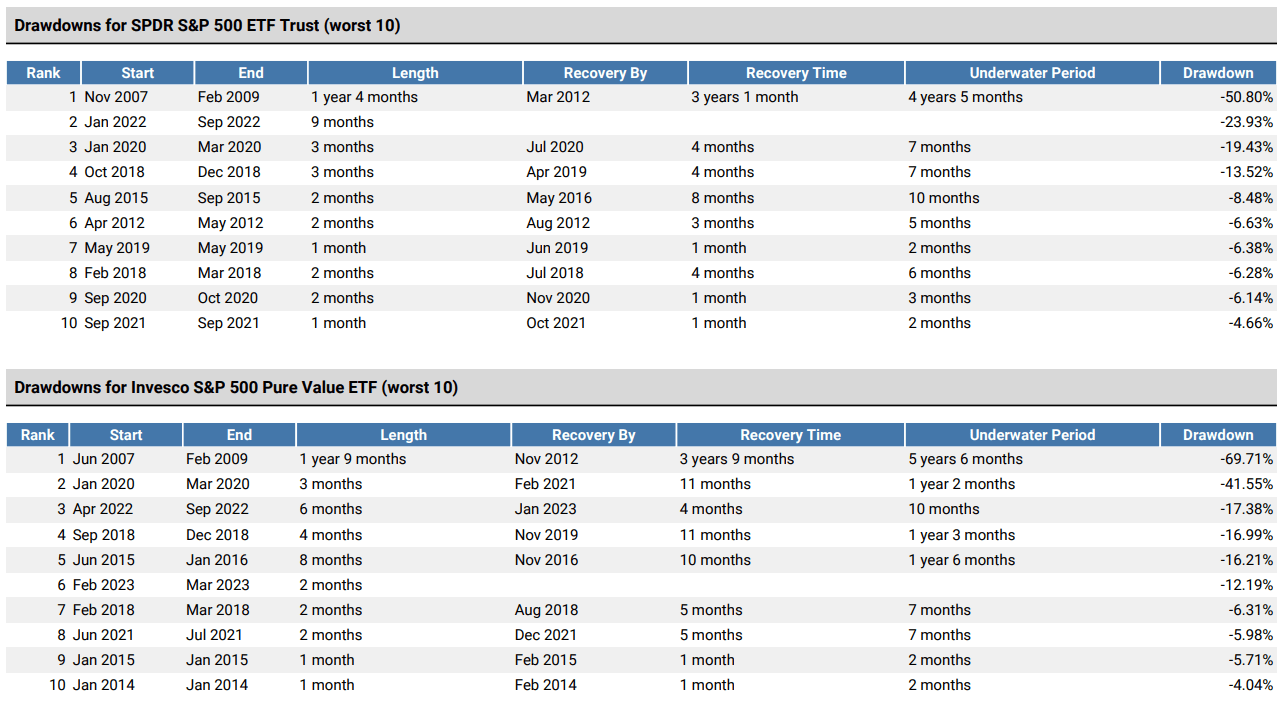
The good news for defensive investors is that OMFL should provide downside protection for at least one month. My concern is if its model switches back to a high-beta portfolio next month, reflecting the expansion phase again. If that proves to be an incorrect call, which is possible because it's right around when earnings season begins, I can easily see OMFL substantially lagging behind the market. That's what high-beta, lower-quality stocks do in slowdowns and recessions. To illustrate, consider the following Invesco S&P 500 Pure Value ETF ( RPV ) drawdown analysis. RPV underperformed the SPDR S&P 500 ETF ( SPY ) by 19% during the Great Financial Crisis and declined 41% in Q1 2020.
OMFL Analysis
Sector Exposures and Top Ten Holdings
The following table highlights OMFL's sector exposures against three benchmarks based on their fundamentals. I selected the iShares Russell 1000 ETF ( IWB ) to represent the selection universe, RPV for the expansion phase, and the Vanguard Dividend Appreciation ETF ( VIG ) for the slowdown phase, which is most relevant today.
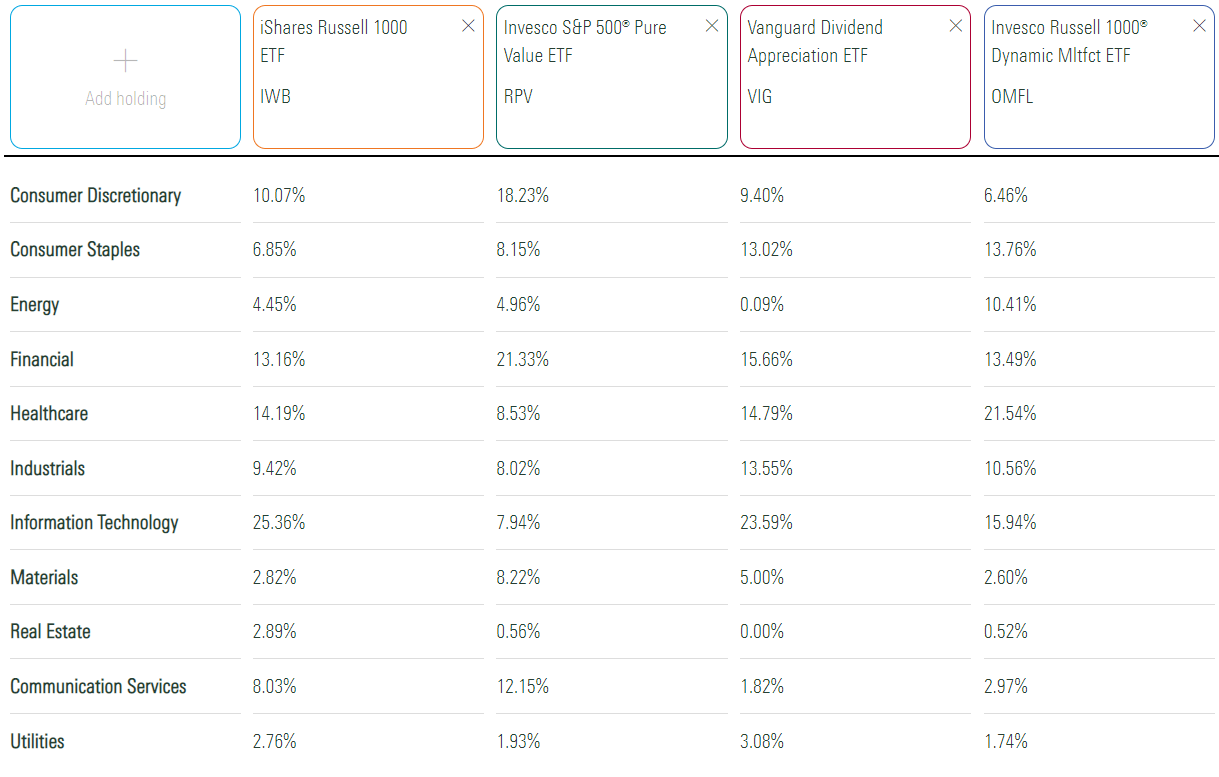
OMFL overweights Consumer Staples and Health Care but underweights Technology and Communication Services, consistent with a defensive position. The last version underweighted Technology (8.66%) but leaned into Financials (20.99%), Industrials (19.50%), and Consumer Discretionary (17.56%).
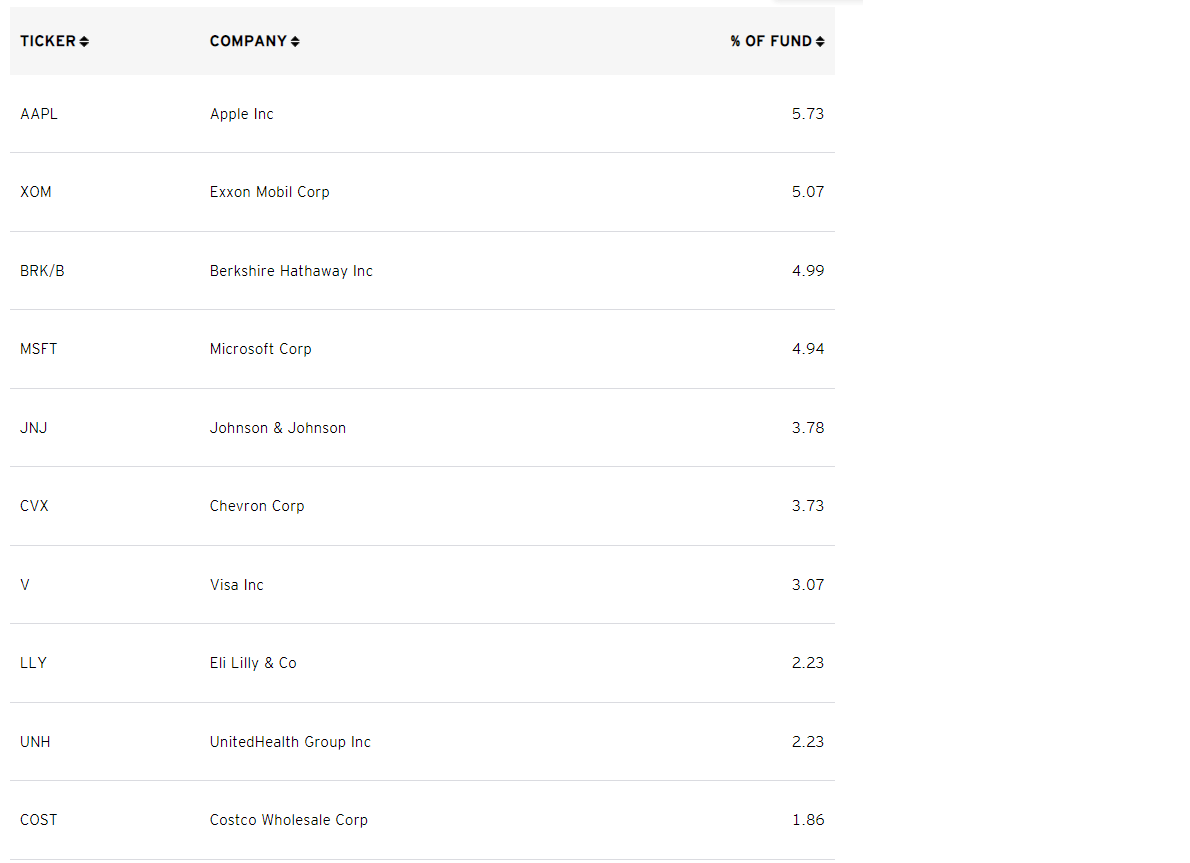
The top ten holdings are listed below. Apple ( AAPL ) and Microsoft ( MSFT ) are prominent, but remember that the portfolio still underweights Technology. The next largest in that sector are Texas Instruments ( TXN ), Cisco Systems ( CSCO ), and Accenture ( ACN ), representing just 2.44% of the fund.
OMFL Fundamental Analysis
The following table highlights selected fundamental metrics for OMFL's top 25 industries, which total 78.10%. I also included the fundamentals for the portfolio pre-reconstitution and the metrics for IWB, RPV, and VIG.
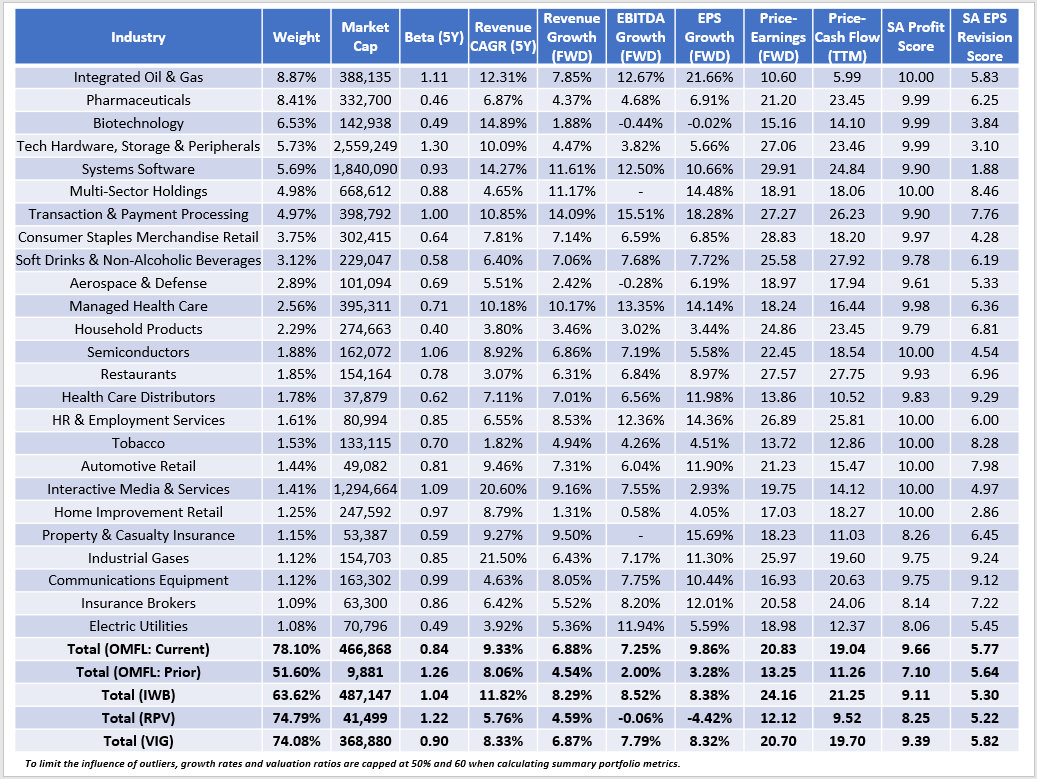
As a reminder, OMFL's current fundamentals represent what the model selects for a slowdown phase. Integrated Oil & Gas companies like Exxon Mobil ( XOM ) and Chevron ( CVX ) are prominent and tend to be among the least volatile in the sector. Interestingly, exposure to the sector increased from 3.33% to 10.41% from expansion to slowdown, but the difference is that the fund previously held volatile Oil & Gas E&P stocks. I think 10% exposure is sufficient, as you don't want to underweight the sector too much if inflation stays high.
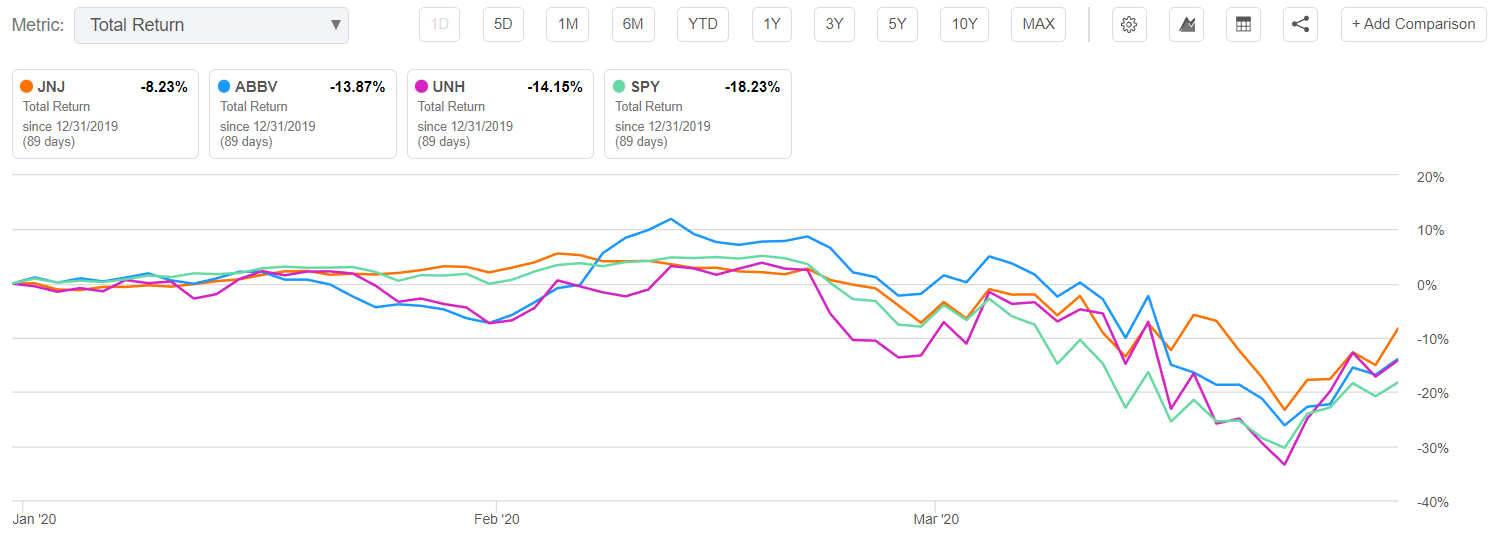
OMFL nicely complements these Energy holdings with defensive stocks in the Pharmaceuticals and Biotechnology industries, which include Johnson & Johnson ( JNJ ) and AbbVie ( ABBV ). UnitedHealth Group ( UNH ) is most of the Managed Health Care exposure, and these companies did relatively well during the Q1 2020 crash. They still declined but are generally safer bets in slowdowns and contractions.
VIG is my benchmark for the slowdown phase after my positive review last month post-reconstitution. I prefer its lower 0.90 five-year beta, relatively high growth rates, and excellent profitability and earnings revision scores. Looking at OMFL's current composition, it's perhaps even better. Its beta is lower at 0.84, and its 9.66/10 profitability score is close to as good as it gets for a diversified fund. OMFL's expected EBITDA growth is slightly lower than VIG's, but its 9.86% earnings growth rate is superior.
While the slowdown portfolio is solid, I'm less confident with the expansion one. Using RPV as a proxy, OMFL's 7.10/10 profitability score is poor. I don't feel good about owning this version of OMFL if we're actually in a slowdown. I see slightly higher EBITDA growth (2.00% vs. -0.06%) with an offsetting higher forward price-earnings ratio (13.25 vs. 12.12). Still, per the earlier drawdowns analysis, neither is good to hold when markets are crashing.
Wrapping Up
I started my research expecting to rate OMFL a buy. Its track record is outstanding, the current portfolio favors factors that I consider essential in the current environment (volatility and quality), and the ability to change gears monthly based on where we are in the business cycle is an advantage. OMFL's 0.29% expense ratio is fair for what amounts to having a rules-based but active fund manager on your side. Its 58% monthly win rate over the Russell 1000 Index impressed me. However, OMFL's 336% turnover rate led me to take a deeper dive into the selection process, and I discovered the following:
1. The Index goes "all-in" on a single phase, even if one has only a negligible advantage over the other. I prefer some middle ground or a mechanism to limit drastic changes until we've clearly changed business cycle phases.
2. The Index is free to switch back and forth between phases rather than move through them linearly as expected. The mechanism described in the previous point would limit this activity, which may be unnecessary and potentially harmful to investors when the business cycle phase is unclear.
3. The Index is untested because the U.S. has been in the expansion phase since OMFL's November 2017 launch, except for a brief contraction related to the pandemic. OMFL was primarily a high-beta fund during this time, so I'm not surprised it outperformed post-pandemic. RPV did even better .
The difference is that OMFL's dynamic nature saved it from the worst of the Q1 2020 crash, which is why you would want this ETF. That said, I'm more comfortable owning VIG right now because it has similar fundamentals and won't change until March 2024. The unfortunate reality is that OMFL's model is still deciding if we are in an expansion or slowdown phase, and the consequences of being wrong are substantial. Therefore, I recommend investors wait for more clarity on the business cycle phase, and I look forward to providing regular updates on this exciting fund throughout the year. Thank you for reading.
For further details see:
OMFL: Top Performing Multifactor ETF Entering Unchartered Territory