ON - ON Semiconductor: Buy Market Pullback (Technical Analysis)
2023-08-12 05:58:02 ET
Summary
- ON Semiconductor is shifting its focus to the electric vehicle market, with a strong emphasis on silicon carbide chips.
- The company's financial performance has been solid, with significant growth in sales to automakers and a surge in silicon carbide revenue.
- The technical analysis of ON's stock price suggests a bullish trend and presents an appealing investment opportunity.
ON Semiconductor Corporation (ON), a leading player in the semiconductor industry, is shifting its focus to the burgeoning electric vehicle market through an emphasis on silicon carbide chips. Even though the recent quarter might seem unimpressive at first look, ON's strategic shift is bearing fruit. This is evident from a significant year-over-year increase in sales to automakers and the outstanding performance of the company's silicon carbide division. This article offers a technical analysis of ON's stock price to forecast its potential future trajectory. The observation that the stock price is maintaining a robust bullish trend, and its current downward correction, suggests an appealing investment opportunity.
Financial Performance
ON Semiconductor maintained its revenue at $2,094.4 million year-over-year, holding both GAAP and non-GAAP gross margins steady at 47.4%. There was a minor difference between the GAAP operating margin at 32.2% and the non-GAAP margin at 32.8%. Diluted earnings per share remained stable, with GAAP at $1.29 and non-GAAP at $1.33, closely aligning with the $1.34 from the same period last year. These solid numbers set the stage for significant growth in specific areas. The automotive sector achieved an impressive 35% growth year-over-year, exceeding $1 billion, complemented by a 5% increase in industrial revenue to $609.3 million. Silicon carbide revenue, essential in electric vehicle technology, saw a near fourfold surge.
ON's focus on automotive and industrial power-management chips, particularly silicon carbide, has been a primary driver of growth. CEO Hassane El-Khoury emphasized this strategic direction, aligning with emerging trends in electrification and renewable energy, as crucial to the company's success. The accompanying chart, showing a rise in net income to $576.60 million, further highlights the company's promising ability to sustain profitability in the future.
Demonstrating operating margins of over 32%, ON has proven its ability to transition successfully into the automotive and industrial sectors while maintaining its profitability. This margin performance makes ON a standout performer compared to other major players like STMicroelectronics N.V. (STM) and Wolfspeed, Inc. (WOLF), as shown in the chart below.
ON's bullish prospects are varied and compelling. The company's deliberate emphasis on profitability, paired with its rising prominence in the EV market, sketches an encouraging future. Its robust financial health, marked by growth in operating margins, illustrates a careful balance between growth and profitability, potentially translating into greater value for shareholders.
Exploring Bullish Momentum for ON Semiconductor
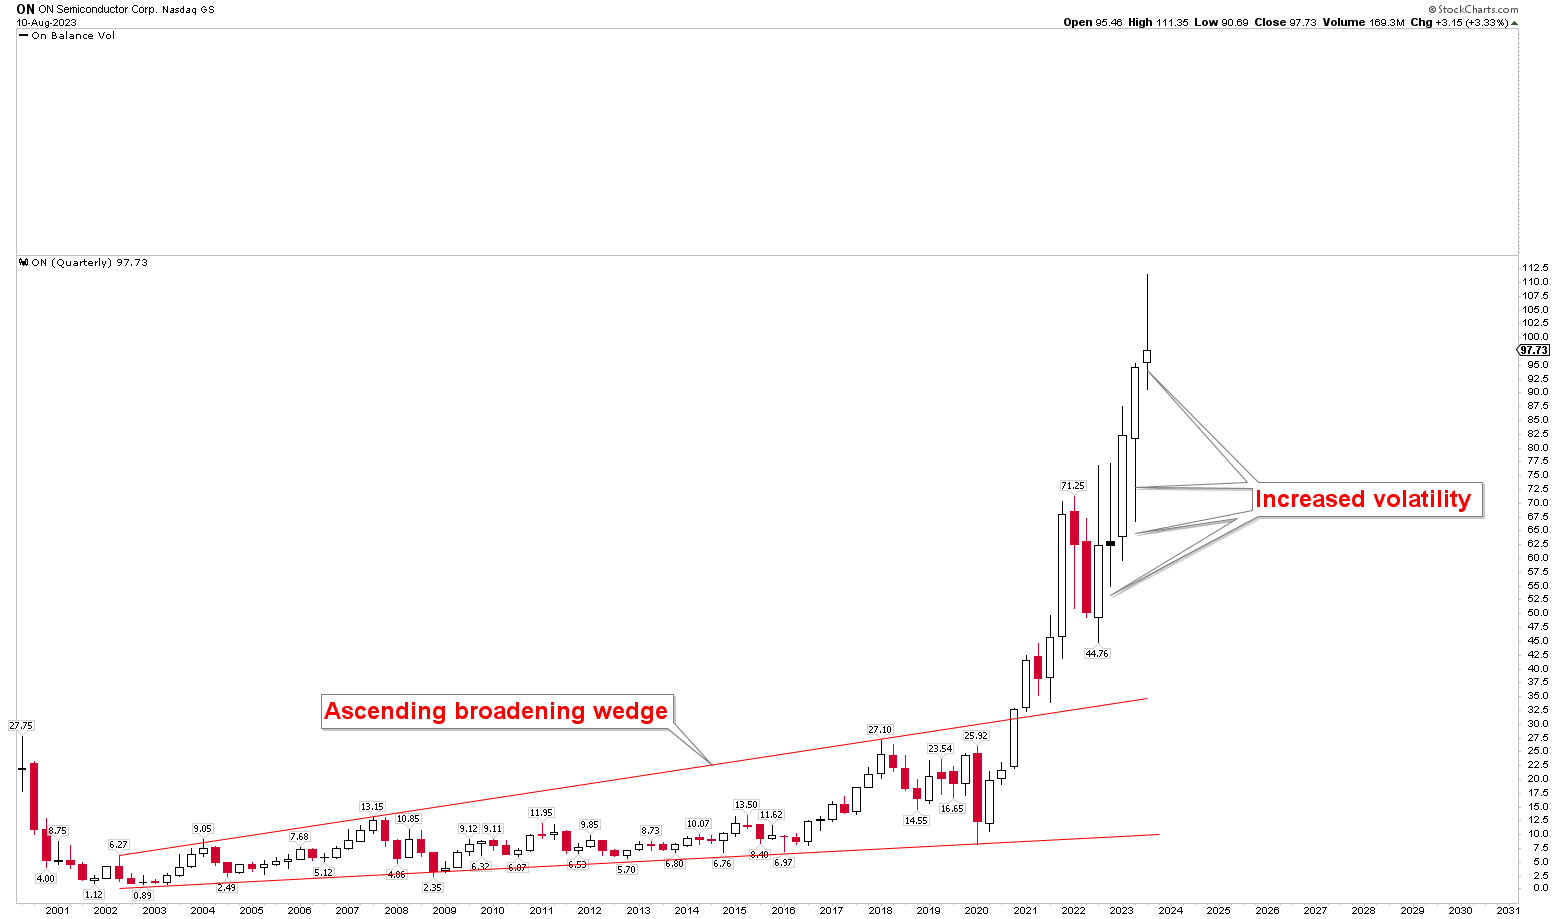
The technical outlook for ON is strongly bullish, as illustrated in the quarterly chart below. This chart reveals an ascending broadening wedge formation from the 2002 lows of $0.89 to the 2018 highs of $27.10. For more than 16 years, the price was confined within this wedge before it broke the formation to the upside. The intense demand within the semiconductor industry catalyzed the breakout in the wedge formation, and prices surged higher amid significant volatility, reaching all-time highs of $111.35. The dramatic rise from the 2020 bottom of $8.17 to these record highs occurred within a mere three years, underscoring the market's volatility and signaling the potential for strong movements in the upward direction.
The chart also shows that this volatility escalated in 2023, as evidenced by the substantial price ranges in the quarterly candles for the last two quarters of 2022 and the first two quarters of 2023. This pattern suggests that if a market correction develops, it could be deeper compared to a typical market situation. Nevertheless, the robust price development from the bottom indicates that any market correction should be viewed as a substantial buying opportunity for long-term investors.
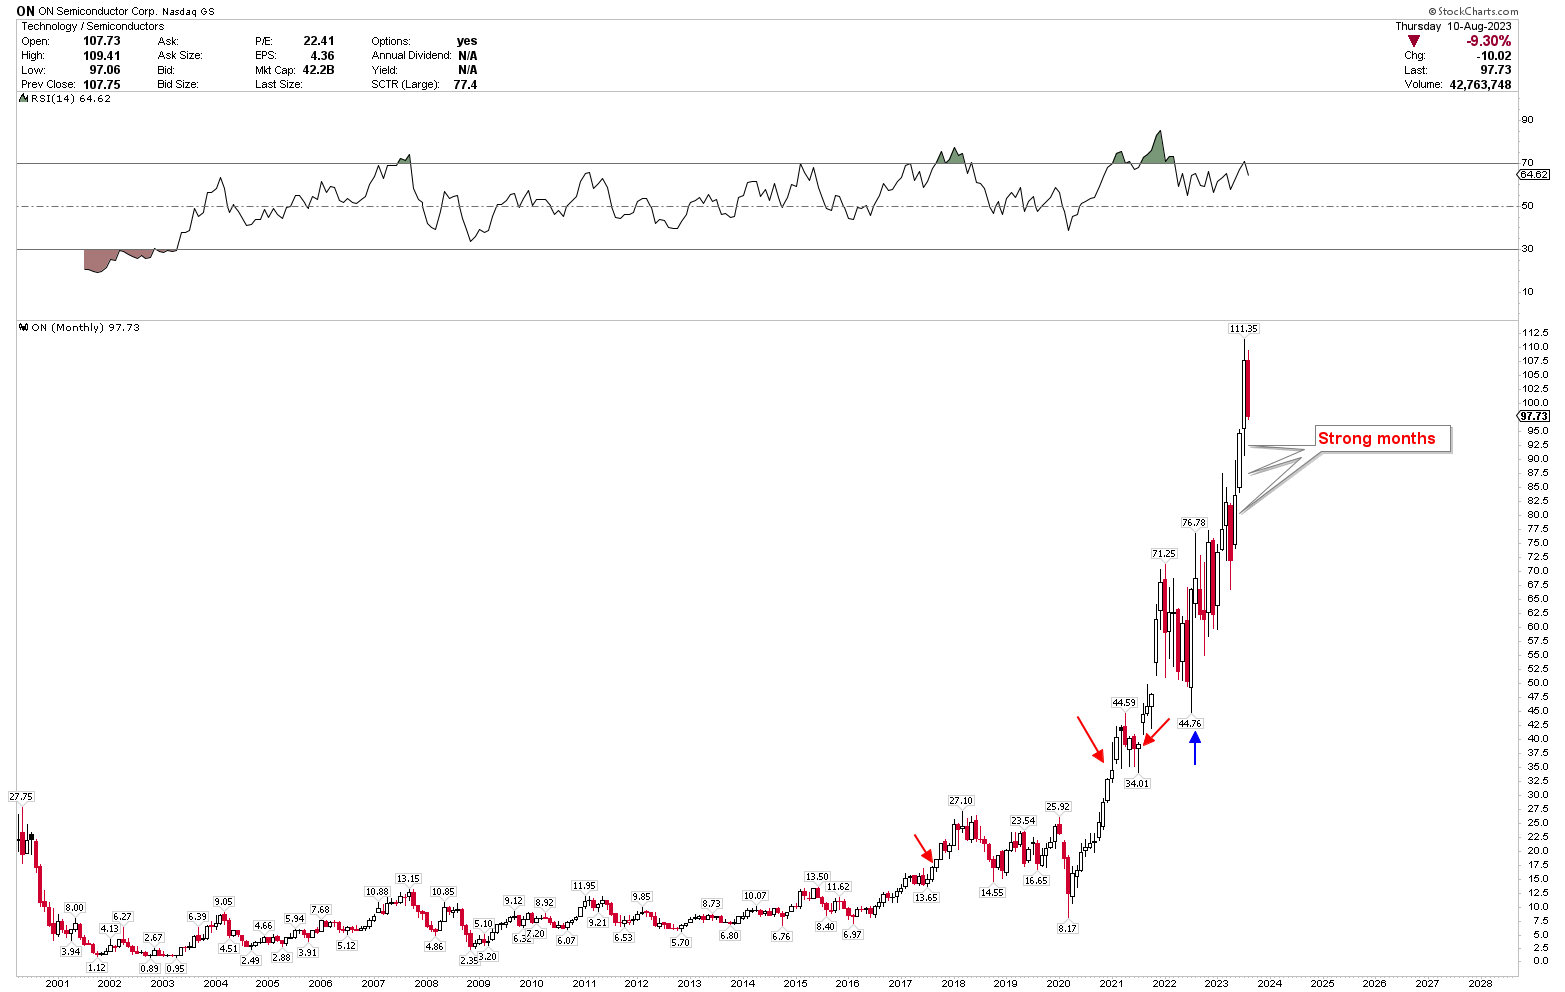
An examination of the monthly chart for ON provides additional insight into the bullish potential in the market. The chart displays a pronounced bullish trend, with the monthly candles for May, June, and July being particularly strong, and August showing a correction. The market is currently retreating from overbought territory, signaling potential further downward momentum due to these overbought conditions. However, the inherent strength in the market suggests that this correction may be reversed, as the market remains vigorous. ON's overbought conditions are marked by red arrows on the chart, illustrating how the market continued to climb even when overextended. Consequently, investors should consider any market correction as a good buying opportunity.
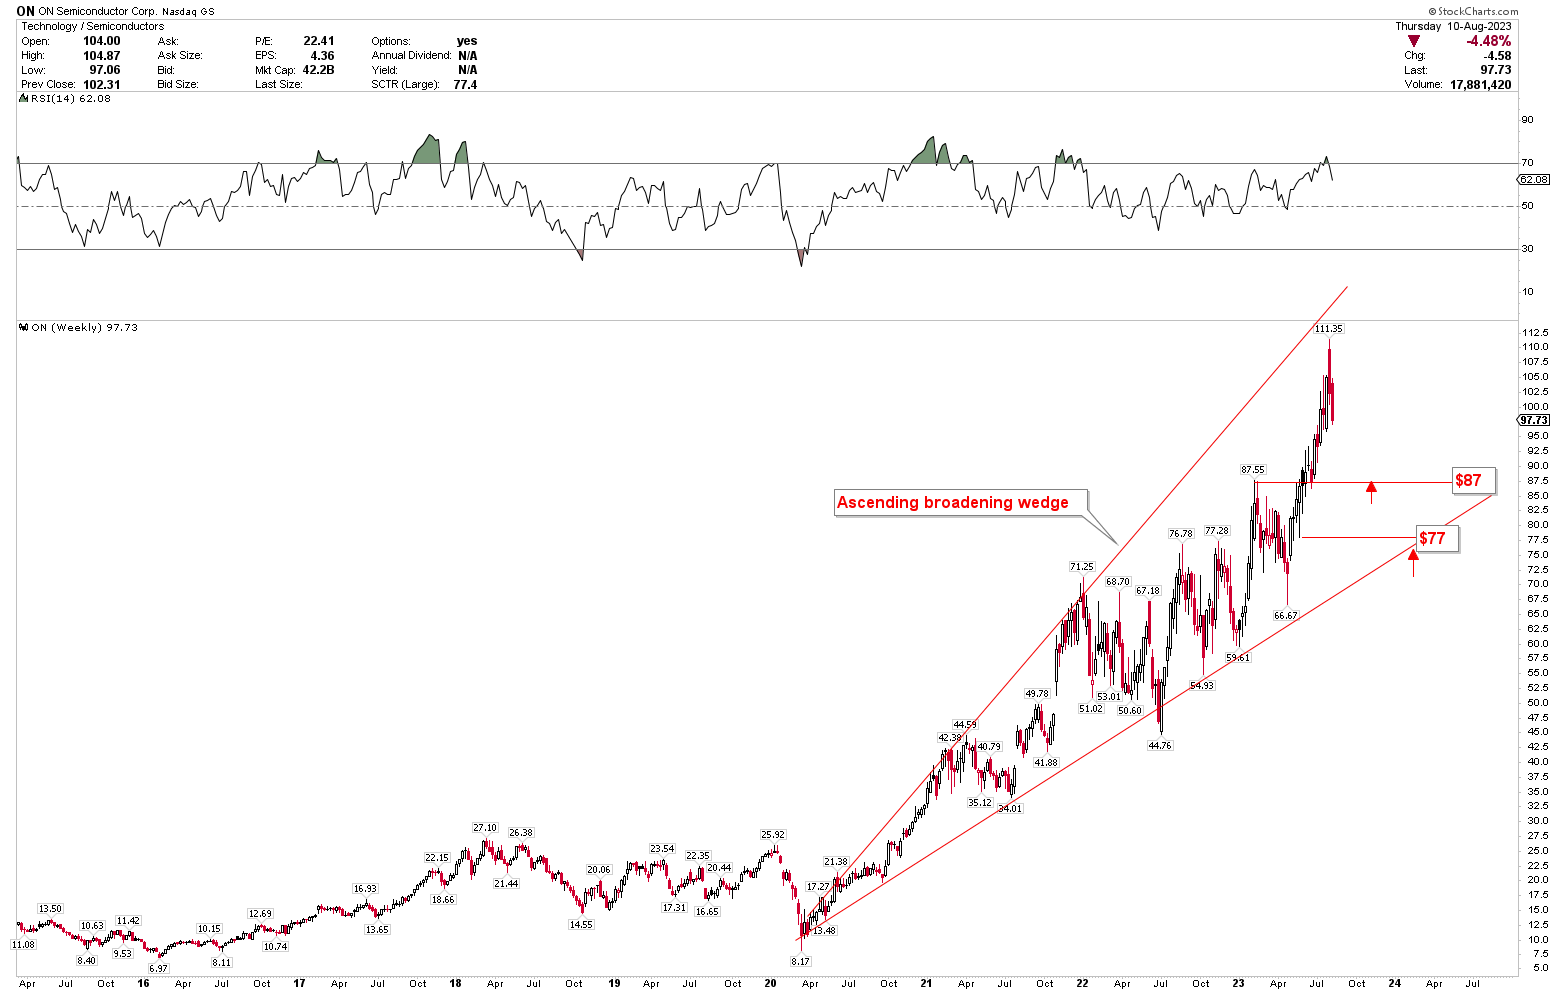
The weekly chart of ON further elucidates the market dynamics by presenting an ascending broadening wedge formation that spans from the 2020 lows of $8.17 to the all-time highs of $111.35. The recent dip from these record highs suggests a need for additional corrections. Yet, the possibility of a continuation of the upward rally from current levels cannot be ruled out. Corrections toward the $87 and $77 present compelling buying opportunities for long-term investors. Moreover, a move above the all-time highs could trigger the next significant rally in the market. Given the market's overbought conditions, a consolidation phase lasting a few weeks cannot be discounted at this moment. Overall, the technical patterns in the quarterly, monthly, and weekly charts all point to bullish opportunities for investors willing to navigate the market's inherent volatility.
Market Risk
The semiconductor industry is notoriously volatile and is heavily influenced by fluctuations in global demand, technological innovation, and economic conditions. A downturn in the broader technology or automotive sectors could negatively impact ON's sales and profitability. Moreover, the industry is highly competitive, and ON faces strong competition from major players. If competitors were to release more innovative or cost-effective products, ON could lose market share.
ON's strategic focus on the electric vehicle market and silicon carbide chips makes it particularly vulnerable to changes in the electric vehicle industry. A slower-than-expected adoption of EVs, changes in government incentives, or increased competition in the silicon carbide market could hinder ON's growth. Additionally, semiconductor manufacturing relies on complex global supply chains. Disruptions due to political instability, natural disasters, or global pandemics could affect ON's ability to produce and deliver its products, potentially leading to lost sales and damaged relationships with key customers.
From a technical perspective, ON stock price is currently trading at elevated levels and is considered overbought. If the market fails to breach the $111.35 mark, there could be a further decline before the stock makes another upward rally.
Bottom Line
ON's strategic pivot towards the electric vehicle market and a strong focus on silicon carbide chips have set the company on a promising growth trajectory. Despite the appearance of a lackluster quarter, a deeper analysis reveals significant successes, including an impressive sales increase in the automotive sector and exceptional performance in silicon carbide manufacturing. The company's leaders have carefully managed this transition to emphasize not just growth but profitable growth, resulting in strong operating margins and earnings per share. The technical outlook appears strongly bullish, with current market corrections viewed as potential buying opportunities for long-term investors. However, risks in the volatile semiconductor industry and potential changes in the EV market must be acknowledged. Despite these challenges, ON's positioning and performance make it a compelling investment for those who believe in the company's strategic direction and growth potential in both the tech and automotive sectors. Investors can consider buying at current market levels, and if the market continues to correct lower, the strong support levels at $87 and $77 could provide opportunities to accumulate more long positions.
For further details see:
ON Semiconductor: Buy Market Pullback (Technical Analysis)