OGS - ONE Gas: Capital-Intensive Low-Margin Business With No Production Advantages
2023-09-21 11:42:09 ET
Summary
- ONE Gas, Inc. is one of the largest natural gas pure plays in the U.S., operating in Oklahoma, Kansas, and Texas.
- The company's revenues are dependent on fixed and variable charges for the delivery of natural gas, with variable rates sensitive to external factors like weather and market pricing.
- Despite high NWC efficiency, ONE Gas is a low-margin, low capital turnover business that does not meet long-term hurdle rates.
- Net-net, rate ONE Gas, Inc. hold.
Investment Briefing
Electricity and gas utilities minors have scope to unlock risk capital from '23 onwards in my view, based on a number of macroeconomic crosscurrents. ONE Gas, Inc. ( OGS) had popped onto the radar, seeing that it is one of the largest natural gas pure plays in the U.S. Its markets span Oklahoma, Kansas and Texas, and it operates through these 3 divisions.
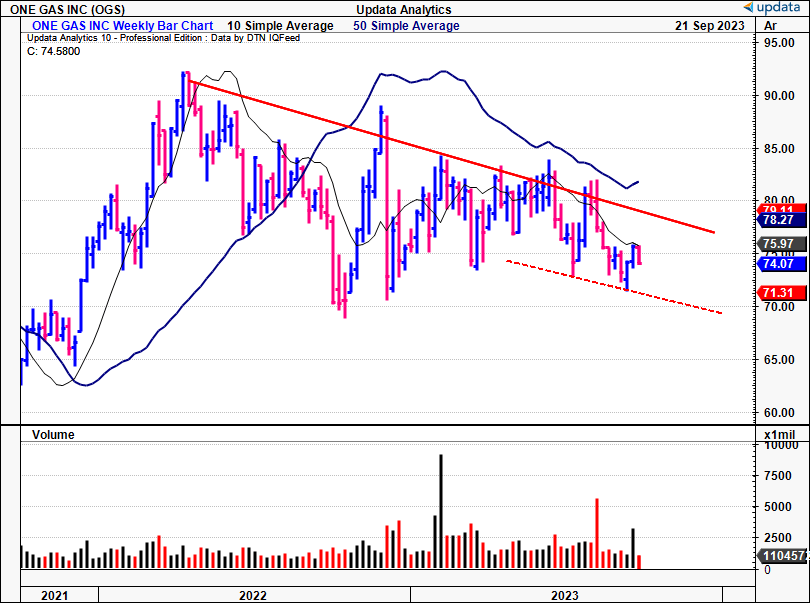
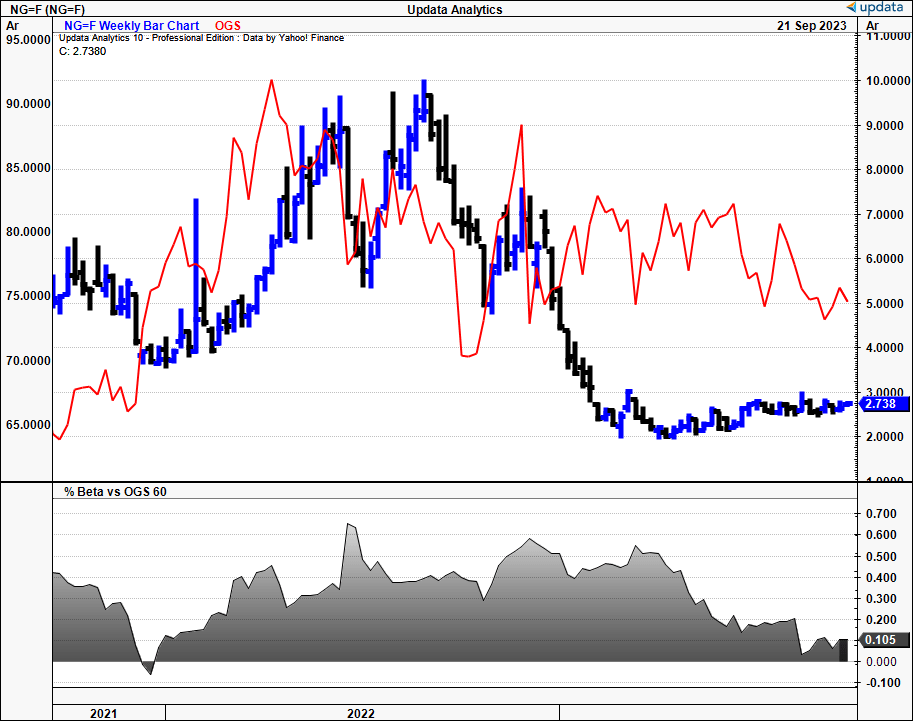
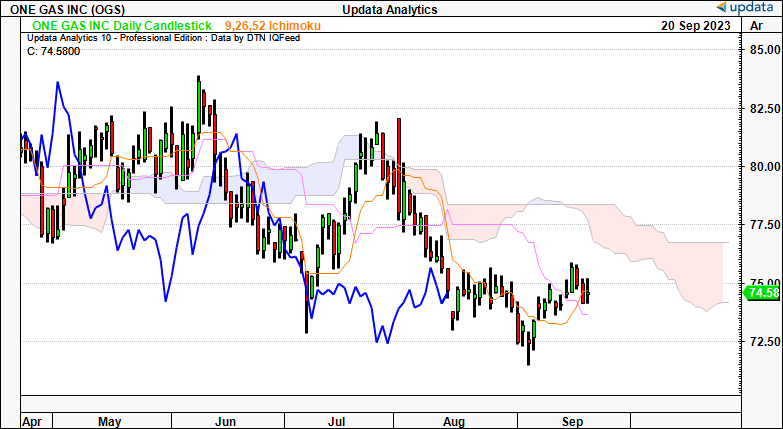
The company books revenues on the delivery of natural gas, via a tranche of fixed and variable charges that it passes through to its customers. Fixed rates are non-sensitive to customer demand/usage whereas variable rates are dependent on volumes of gas sales, and thus are sensitive to exogenous variables such as the weather, and ultimately, market pricing. The company's equity line respective to natural gas futures since '21 is observed in Figure 1(a), whereas its current trend positioning over '23 is noted in Figure 1(c).
One of the major hurdles in the broad utilities space is the lack of differentiation, both on cost and product. There are no consumer or branding advantages. Most if not all purveyors are tied up to the same pricing mechanisms and are undifferentiated on what they supply. It therefore falls onto the idiosyncratic nature of each individual company, via production and/or efficiency advantages. On examination, OGS doesn't fall into either of these categories in my view. Net-net, I rate OGS a hold, noting the market may have it fairly valued at its current marks.
Figure 1.
Figure 1(a).
Figure 1(c).
Critical investment facts underlining hold thesis
1. Recent developments
- Q2 FY'23 insights
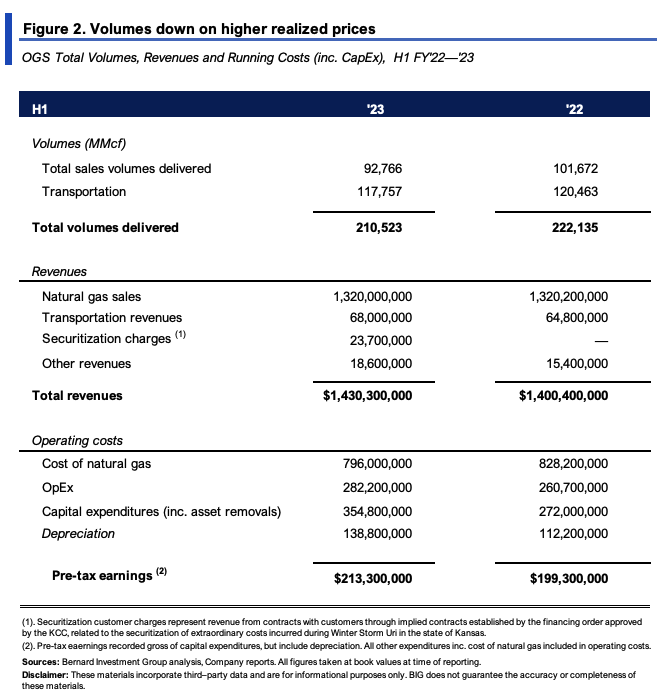
For the YTD, OGS put up revenues of $1.4Bn from gas volumes of 210,523mm cubic feet ("MMcf"). Both sales and transportation volumes were down, yet natural gas sales were flat YoY at $1.32Bn for the YTD. Cost of natgas was down considerably YoY as expected and the company allocated an additional $82.8mm in CapEx during the half. Total revenues were up ~$30mm YoY from transportation and others. The full breakdown is observed in Figure 2.
In Q2, OGS booked operating income of $64mm, underscored by a $14mm contribution from new rates and a $1.1mm growth in residential sales from customers in Oklahoma and Texas.
Growth was tempered by an increase of $6.7mm in staffing costs and $1.7mm off the top secondary to the lower sales volumes. Additionally, heating degree days in the areas served by the company tallied 593, 11.1% above the normal average and 6.6% over last year. It allocated $41.1mm to CapEx and asset removal costs, chiefly to system integrity and expanding its service area. The company also confirmed its quarterly dividend of $0.65/share ($2.60 annualized).
Multiple regulatory updates came into effect during the quarter as well, namely:
- In March this year, its Oklahoma Natural Gas division submitted its annual performance-based rate change application. The application proposed (i) a $27.6mm increase in base rate revenue, (ii) a $2.5mm energy efficiency incentive, and (iii) an $11.9mm energy delivery infrastructure tracker ("EDIT") credited to customers in '24. Following negotiations, the Oklahoma Corporation Commission approved a settlement. The outcome was:
- A revenue increase of $26.3mm;
- A $2.5mm energy efficiency incentive; and
- A $12.6mm EDIT credit. The new rates took effect in June.
- Its Texas Gas Service division filed gas reliability infrastructure program ("GRIP") requests back in February, resulting in approved increases for the central Gulf service area. These also came effective in June.
- Also in June, Texas Gas Service filed a rate case for all customers in the Rio Grande Valley service area. It requested a $9.8mm increase. You can expect these to come line late this year or early next.
- Equity raise
Earlier this month OGS issued another 1.2 million shares of common stock through a public offering to select forward purchasers. It sized the offer at $88.8 million and collected this in gross proceeds. The exclusive underwriter for this offering is BofA Securities ( BAC ), which will periodically sell the common stock either on the NYSE, OTC, or through negotiated deals. The settlement for the forward sale agreement is anticipated before December 2024.
In my view the reasons for the new issue aren't entirely clear from a capital budgeting point of view. Management proceeds will be used for general corporate use, including debt repayment or refinancing, but also towards working capital and investments.
2. Economic analysis
Thoughtful analysis of the company's propensity to create economic value is a beneficial exercise. As mentioned earlier, utilities in general—just like metals/mining, makeup, and electrical components—don't really enjoy consumer advantages or benefits of cost differentiation. They all sell the same "product" and are more-or-less price takers based on market pricing. So you can forget growth at the margin or high margins in general. Cost leadership is therefore out the window as well. The only insulating factor falls on production advantages.
For OGS, several points are notable here:
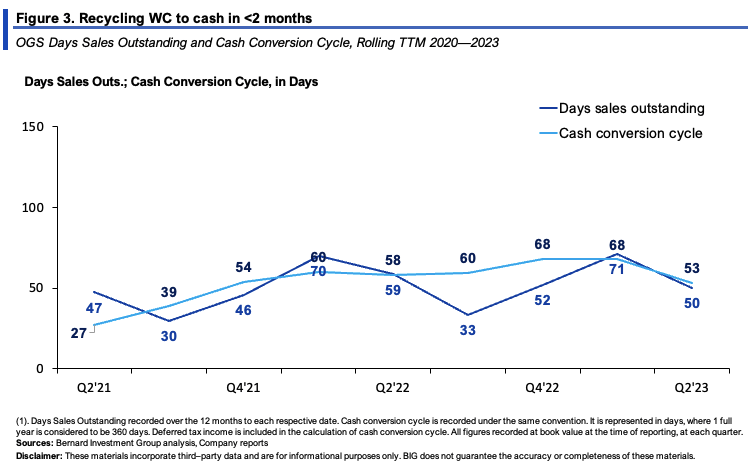
- OGS does enjoy working capital efficiencies, converting each $1 tied up in NWC back to cash in less than 2 months on average. As seen in Figure 3, the cash conversion cycle ("CCC") was ~50 days last period on DSO of 53 days, in line with historical range. At an average CCC of 50, the firm would turn over its NWC 7.3x each year, presuming a full year of 365 days.
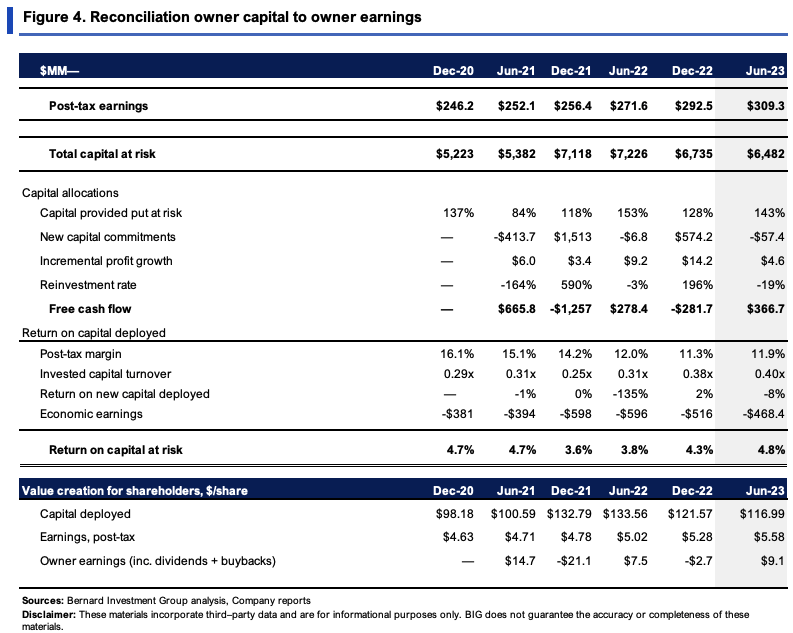
- Including all the firm's NWC and core assets, it had $6.48Bn in capital at risk by Q2, equating to $117/share [Figure 4]. The $117 produced $5.58/share in NOPAT, otherwise 4.8% rate of return. Whilst this also falls in line with the historical average over the last 2.5 years, this isn't an attractive rate on capital in my view.
- As mentioned earlier, I'm looking for production advantages here to offset the marginal challenges posed by being in an undifferentiated industry. Whilst NWC efficiency is high for OGS, total capital turnover isn't, at just 0.4x last period on post-tax margins of ~12%. I would note that capital turnover has stretched up off 2020 lows. But this is a low-margin, low capital turnover business to say the least. I try to avoid these kind of economics.
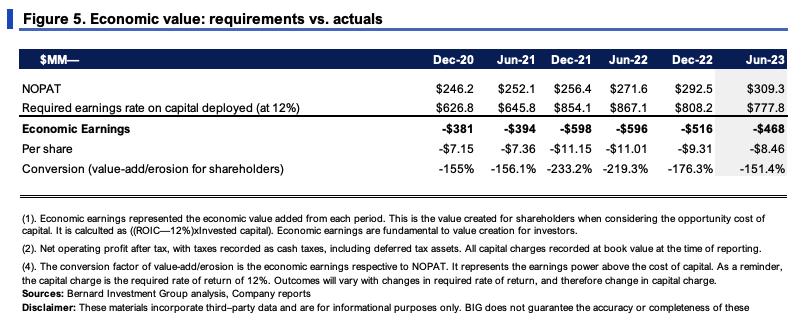
We employ a 12% required return on capital for all our current and potential equity holdings (aligning with long-term market averages). This serves as our hurdle rate. This ensures we are buying productive assets, and selling unproductive ones to finance the former. Figure 5 outlines the economic requirements OGS would have needed to meet under this convention. The prevailing economic earnings/losses illustrate the economic value. As you can see, it has missed the 12% hurdle consistently. For instance in Q2 it needed to do $777mm in NOPAT to beat the hurdle, and did $309mm instead, producing an economic loss of $8.46/share. In Q2 FY'22 it was a loss of $11/share.
3. Expectations and forecasts at steady-state
The value drivers of OGS' business returns for the last 3 years are observed in Figure 7. Operating drivers contribute to the incremental post-tax earnings, investment drivers to capital allocation. Combined, these show the incremental FCFs it has thrown off over the testing period.
Sales have compounded at a 5.5% rate on a reasonable and stable operating margin of 16%. As you can see, the bulk of capital allocation has been toward fixed assets and intangibles. For every new $1 in sales, OGS needed $0.88 investment in fixed capital and ~$0.29 in intangibles to support the growth. In the same breath, company was able to reduce its NWC requirements by $0.03 on the dollar with its sales growth.
This squares off with the economics of the business outlined earlier, in that: (i) NWC efficiency is high, (ii) capital intensity is also high, and (iii) ongoing investment requirements to sustain a competitive position are also high.
BIG Insights
The question is what does this look like when carried forward. Figure 8 captures this, although I've pared the sales growth rate back to 4%, in line with consensus.
To support this 4% rate of growth, OGS' capital requirements would likely be quite intensive in my view. It would need to invest ~$100–$112mm per quarter ($400–$448mm annualized) under the stipulations in Figure 7. This would be ~28% of the average trailing NOPAT each quarter. Still, the returns on capital would likely be tight, leading to free cash flow ("FCF") of $263mm–$310mm each period.
Critically, given the capital intensity and lack of productive returns on this, each unit of growth would hamper the cash OGS could throw off under this model. At a 6% growth rate for example, the free cash flow range would be $220–$228, at 10%, $180–$220, and at a 2% rate of sales growth, it could throw off $305–$330mm in cash each period. This is a classic example of when rates of return on capital deployed are low, growth actually erodes value.
Note: Assumes 4% compounding revenue growth rate. (BIG Insights)
Valuation and conclusion
The stock sells at a relative premium to peers at 18x forward earnings and 18.8x forward EBIT (6.6% and 1.2% premium, respectively, as I write). It's one thing to pay for quality growth. But the economics have to stack up.
A few points are relevant here.
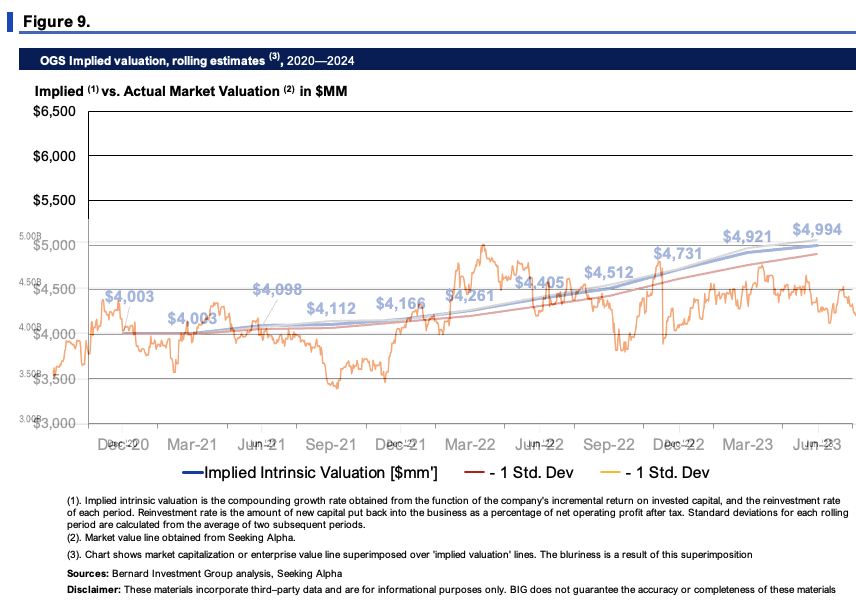
One, compounding the firm's implied intrinsic value at the function of its ROIC and reinvestment rate suggests the market has priced OGS correctly at its current marks. Figure 9 depicts this, and tracks the numbers shown in Figure 4. Applying the calculus gets me to $4.47Bn in implied intrinsic value, or ~$79/share, a shade above where OGS sells today.
Two, the stock also sells at flat multiples to capital invested of 1.1x. That's $1.10 in market value for every $1 of capital invested, otherwise 10% market return on capital. I typically look for high ROIC names trading at least 3x EV/IC. At the trailing rates of return, it would suggest the market has priced in the earnings power produced on OGS' assets, excluding dividends. In that vein it's likely buyers of the company today would be looking at income vs. capital gains in my view.
BIG Insights
Three, technicals aren't supportive either. Point and figure studies at a 0.5x2 box reversal provide a cleaner view of trend action and remove intra-trend volatilities. We have downsides to $66 based on the P&F studies below and there's scope for OGS to sell at this range in my opinion. This further supports a neutral view.
Figure 11.
Data: Updata
In short, those in the gas utilities crowd have a hard time differentiating themselves on product and/or cost. Operating excellence is therefore a requisite to be considered investment grade in my view. For OGS, it is a low-margin, low capital turnover business, meaning it doesn't enjoy the production advantages you'd expect from a long-term compounder in this space. Instead, rates of return on capital deployed are thin, and by all measures, these trends could continue moving forward. Net-net, I rate ONE Gas, Inc. a hold, eyeing more selective opportunities elsewhere.
For further details see:
ONE Gas: Capital-Intensive, Low-Margin Business With No Production Advantages