OILX - OPEC Update July 2023
2023-07-19 21:06:00 ET
Summary
- OPEC crude output was revised higher in May 2023 by 34 kb/d compared to last month’s report and April 2023 OPEC crude output was revised higher by 1 kb/d.
- Preliminary data indicates that global liquids production in June increased by 0.6 mb/d to average 101.2 mb/d compared with the previous month.
- The EIA’s Drilling Productivity Report (DPR) has Permian basin output levelling off from April 2023 to August 2023, the 357 and 400 well scenarios are both consistent with that projection.
The OPEC Monthly Oil Market Report (MOMR) for July 2023 was published recently. The last month reported in most of the OPEC charts that follow is June 2023 and output reported for OPEC nations is crude oil output in thousands of barrels per day (kb/d). In many of the OPEC charts that follow the blue line with markers is monthly output and the thin red line is the centered twelve month average (CTMA) output.
OPEC crude output was revised higher in May 2023 by 34 kb/d compared to last month’s report and April 2023 OPEC crude output was revised higher by 1 kb/d. When the World was at its CTMA peak for C+C output in 2018, OPEC crude output was about 31300 kb/d and by June 2023 OPEC crude output had fallen to roughly 3110 kb/d below that 12 month average peak in 2018.
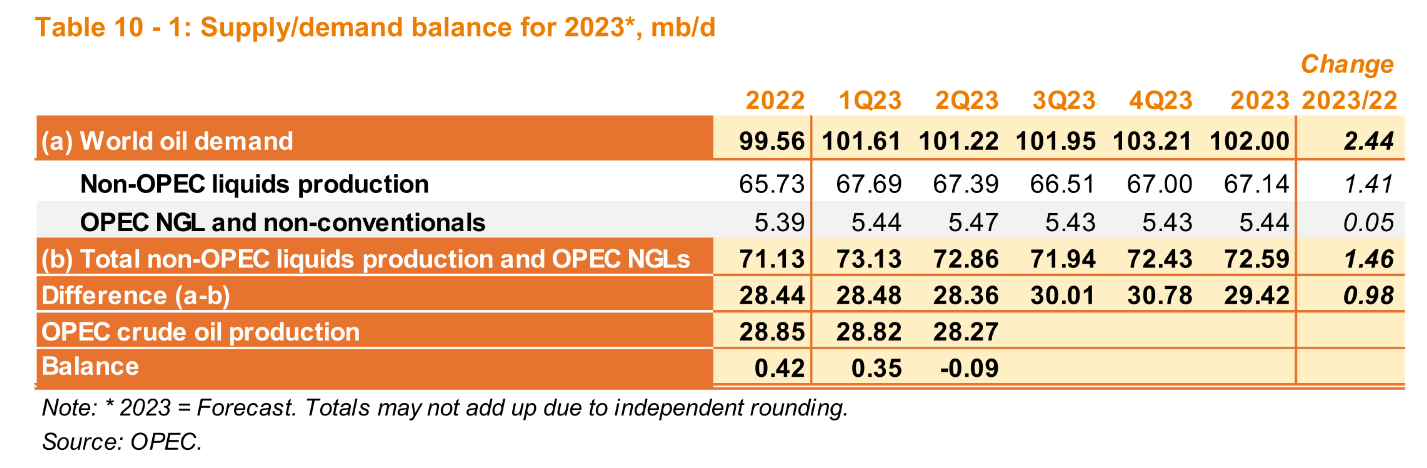
Preliminary data indicates that global liquids production in June increased by 0.6 mb/d to average 101.2 mb/d compared with the previous month. World liquids output increased about 4 Mb/d in the past 24 months (from 96.2 Mb/d in July 2023).
OECD stocks increased in May 2023 by 20.2 Mb and were 101 Mb below the 5 year average. Through May 2023 the World oil market looks fairly balanced with OECD stocks slowly rising. Looking at OPEC’s estimates for future supply and demand and considering recent OPEC quotas, it looks like the World Oil Market will be tight the second half of 2023 and in 2024, I if OPEC quotas are not raised at the end of 2023.
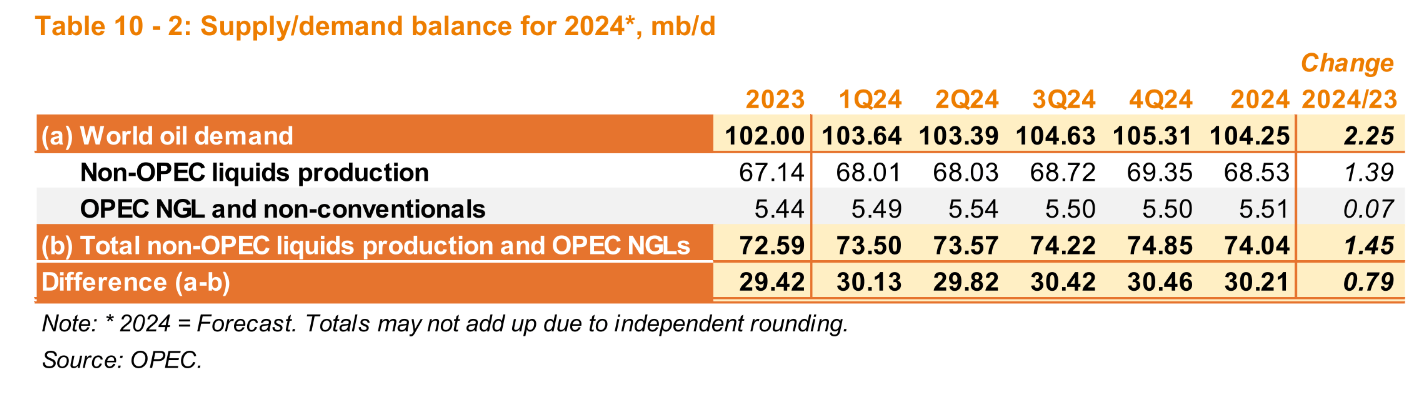
If the OPEC estimates for World demand and non-OPEC supply in 2024 are correct, OPEC may struggle to meet the call on OPEC in 2024, we will find out how much of the claimed OPEC “spare capacity” is real.
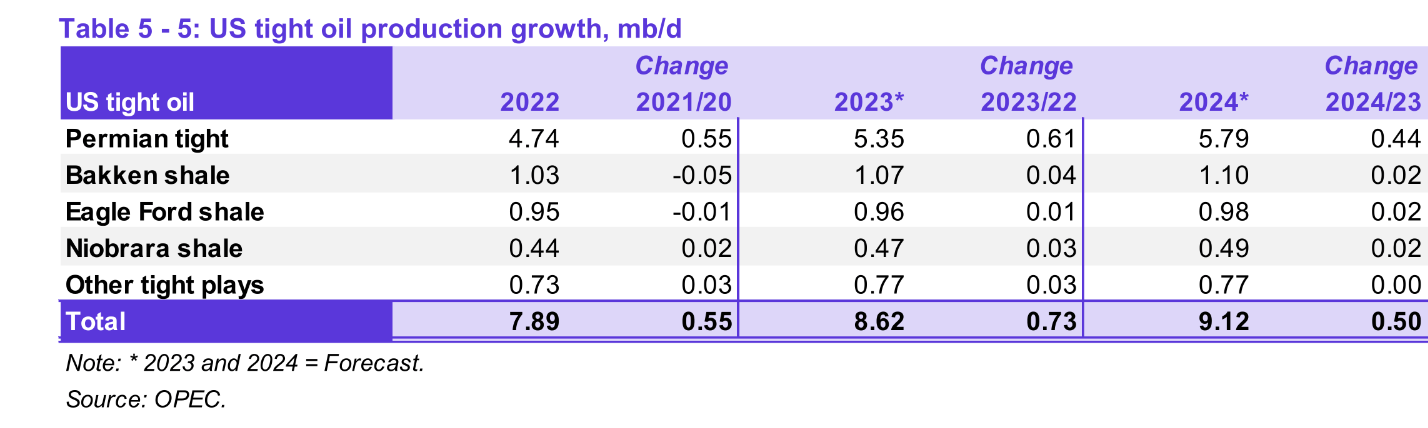
OPEC expects US tight oil output to increase by 730 kb/d in 2023 compared to 2022 (annual average output) with 610 kb/d from increased Permian basin output. In 2024 OPEC projects an increase in annual average US tight oil output of 500 kb/d with 440 kb/d coming from the Permian basin.
My best guess model has Permian basin average annual output increasing by 564 kb/d in 2023 compared to 2022 average annual output and in 2024 average annual output increases by 251 kb/d.
A spreadsheet with a Permian Model can be downloaded at this link , there are several scenarios included that can be shown by changing row 3 in the “output” sheet with one of the other scenarios in the “wells per month” sheet, any scenario can be created, though best to leave Jan 2022 to March 2023 as they are and change wells per month from April 2023 to September 2032, no wells can be added after that date (due to the number of rows in the spreadsheet, 129 rows). Three scenarios are presented below.
My best guess scenario is the 450 well per month scenario (URR=37 Gb), though my python program allows me to use a longer tail so that URR is 40 Gb for my best guess. The 400 well scenario has a URR of 35 Gb and the 357 well scenario has a URR of 33 Gb. The decline rate from Jan 2033 to December 2042 is about 25% per year for the 450 well scenario. Also the average annual rate of increase for the 450 well scenario from Jan 2024 to December 2029 is about 145 kb/d, a relatively conservative rate of increase.
The EIA’s Drilling Productivity Report (DPR) has Permian basin output levelling off from April 2023 to August 2023, the 357 and 400 well scenarios are both consistent with that projection, but we need to have the completion rate fall faster than suggested by the DPR in order to create a matching scenario.
Below I show the 400 well scenario, note that the URR of this scenario is similar to the G &R blog estimate of about 34 G.
Note that it is possible that my model is incorrect, though it matches historical Permian data quite well from January 2010 to December 2021 with a correlation coefficient of 0.9982 over that period between data and model. See chart below.
Editor's Note: The summary bullets for this article were chosen by Seeking Alpha editors.
For further details see:
OPEC Update, July 2023