WPM - Osisko Gold Royalties: A Solid Track Record
2023-05-23 06:04:07 ET
Summary
- Net income attributable to Osisko's shareholders was US$15.24 million or US$0.08 per share, compared to US$0.26 million or US$0.08 last year.
- Production was 23,111 GEOs with a cost of sales of US$2.96 million and a Cash margin of US$41.1 million.
- The quarterly dividend has been increased to US$0.045 per share this quarter, or a yield of 1.48%.
- I recommend buying OR between $16.1 and $15.75 to accumulate again, with potential lower support at $15.
Introduction
Montreal-based Osisko Gold Royalties Ltd ( OR ) released its first quarter 2023 results on May 10, 2023.
Important Note: I have followed OR quarterly since 2018. This new article is a quarterly update of my article published on April 10, 2023.
Again, all numbers indicated in this article are converted into US$. However, the dollar amount shown in the conference call or the Presentation is CAN$.
Also, Osisko Gold Royalties Ltd. owns 70% of Osisko Development Corp. As a result, the assets, liabilities, results of operations, and cash flows of the Company consolidate the activities of Osisko Development and its subsidiaries.
CFO Frederic Ruel said in the conference call :
The cash margin from our royalties reached $39 million. The cash margin from our streams amounted to $16.5 million for a total in Q1 of $55.5 million compared to $47.5 million last year. (in C$)
1 - 1Q23 Results Snapshot
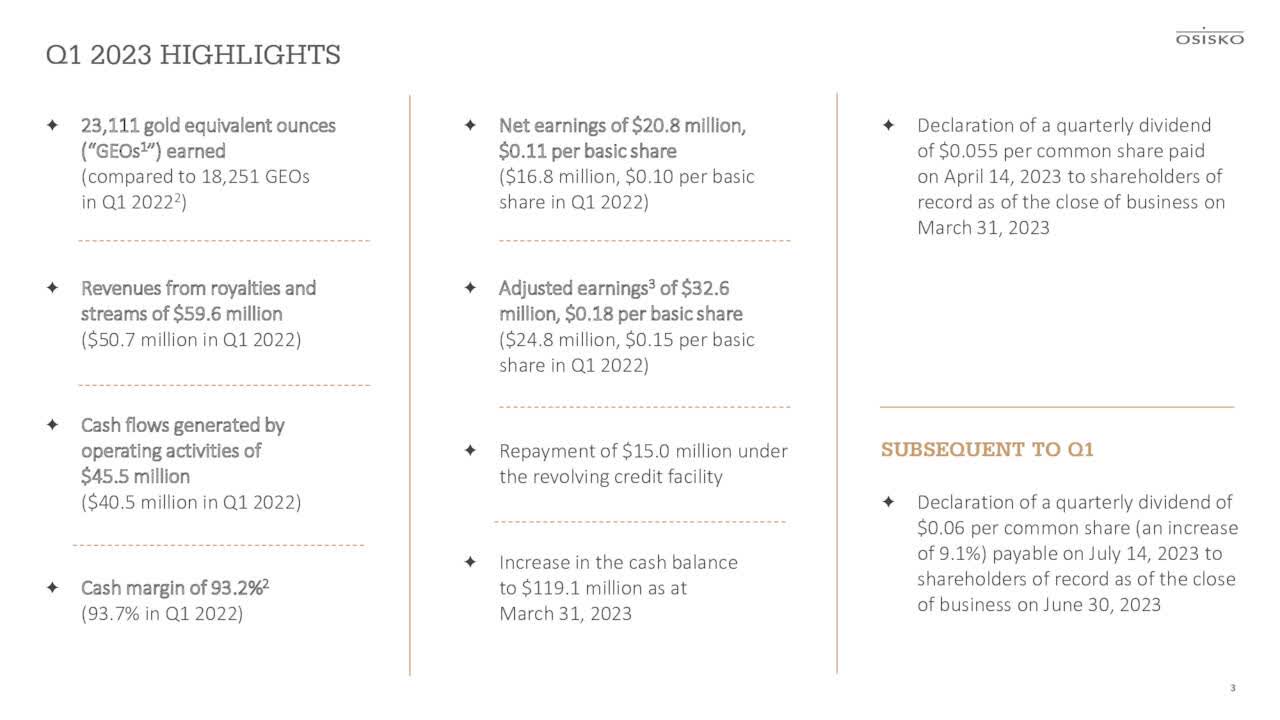
Net income attributable to Osisko's shareholders was US$15.24 million or US$0.08 per share, compared to US$0.26 million or US$0.08 last year. The quarterly dividend has been increased to US$0.045 per share this quarter, or a yield of 1.48%.
Warning: Osisko Gold Royalties indicates its results in Canadian $ in its presentation.
OR 1Q23 Highlights (OR Presentation)
Production was 23,111 GEOs with a cost of sales of US$2.96 million and a Cash margin of US$41.1 million. Royalties and stream revenues were .55 million. Production was affected by weak delivery from Canadian Malartic.
The company sold its gold at US$1,890 per ounce and silver at US$22.55.
Net Debt is now US$9.97 as of March 31, 2023.
2 - Stock performance
Osisko Gold Royalties is part of the five streamers I regularly cover on Seeking Alpha.
My long-term streamers of choice are Wheaton Precious Metals ( WPM ) and Franco-Nevada ( FNV ).
Still, Osisko Gold Royalties is a good alternative in the streamer segment, especially for those who want to trade the sector short term. We can compare OR to Sandstorm Gold ( SAND ).
OR has outperformed the group significantly and is now up 42% YoY.
I like OR because of its straightforward working strategy. It is easy to follow, has excellent performance, attractive growth potential, and has a solid balance sheet.
OR Value Drivers (OR Presentation)
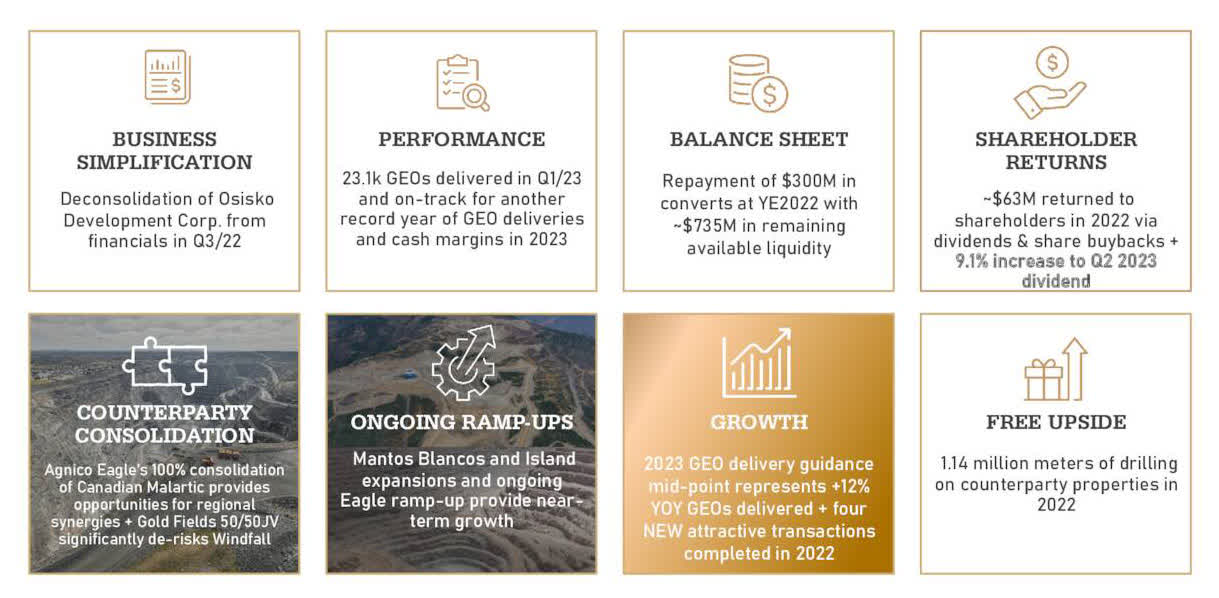
Osisko Gold Royalties - Financials And Production history ending in 1Q23 (In US$)
Note: Values can differ slightly due to the conversion from CAD to USD. Osisko Gold Royalties indicates CAD$ results with an exchange rate (CAD vs. USD) of 0.739 in 1Q23.
| Osisko Gold Royalties |
| 1Q22 |
| 2Q22 |
| 3Q22 |
| 4Q22 |
| 1Q23 |
| Total Revenues (including off-take interest) in US$ Million |
| 46.92 |
| 49.95 |
| 40.23 |
| 45.58 |
| 43.55 |
| Net Income in US$ Million |
| 0.26 |
| 13.40 |
| -118.93 |
| 16.49 |
| 15.24 |
| EBITDA US$ Million |
| 16.76 |
| 39.09 |
| 43.85 |
| 33.35 |
| 33.52 |
| EPS diluted in US$/share |
| 0.00 |
| 0.07 |
| -0.65 |
| 0.10 |
| 0.08 |
| Operating cash flow in US$ Million |
| 18.65 |
| -0.17 |
| 28.52 |
| 35.72 |
| 33.22 |
| Capital Expenditure in US$ Million |
| 17.63 |
| 16.38 |
| 17.30 |
| 67.61 |
| 0.00 |
| Free Cash Flow in US$ Million |
| 1.02 |
| -16.55 |
| 11.22 |
| -31.89 |
| 33.22 |
| Total Cash Million |
| 357.35 |
| 350.89 |
| 225.31 |
| 66.65 |
| 88.23 |
| Long-term Debt in US$ Million |
| 327.30 |
| 238.39 |
| 223.58 |
| 108.91 |
| 98.20 |
| Dividends per share are US$ |
| 0.044 |
| 0.044 |
| 0.043 |
| 0.041 |
| 0.041 |
| Shares outstanding (diluted) in Million |
| 167.28 |
| 185.63 |
| 184.85 |
| 184.71 |
| 185.44 |
| GEOs |
| 1Q22 |
| 2Q22 |
| 3Q22 |
| 4Q22 |
| 1Q23 |
| Estimated Production gold equivalent Oz Eq. |
| 18,251 |
| 22,243 |
| 23,850 |
| 25,023 |
| 23,111 |
| Gold price realized in US$ per ounce |
| 1,877 |
| 1,871 |
| 1,729 |
| 1,727 |
| 1,890 |
| Silver price realized in per ounce |
| 24.01 |
| 23.00 |
| 19.23 |
| 21.00 |
| 22.55 |
Source: Company release .
Analysis: Revenues, Earnings Details, Free Cash Flow, Debt, And Production Details (In US$)
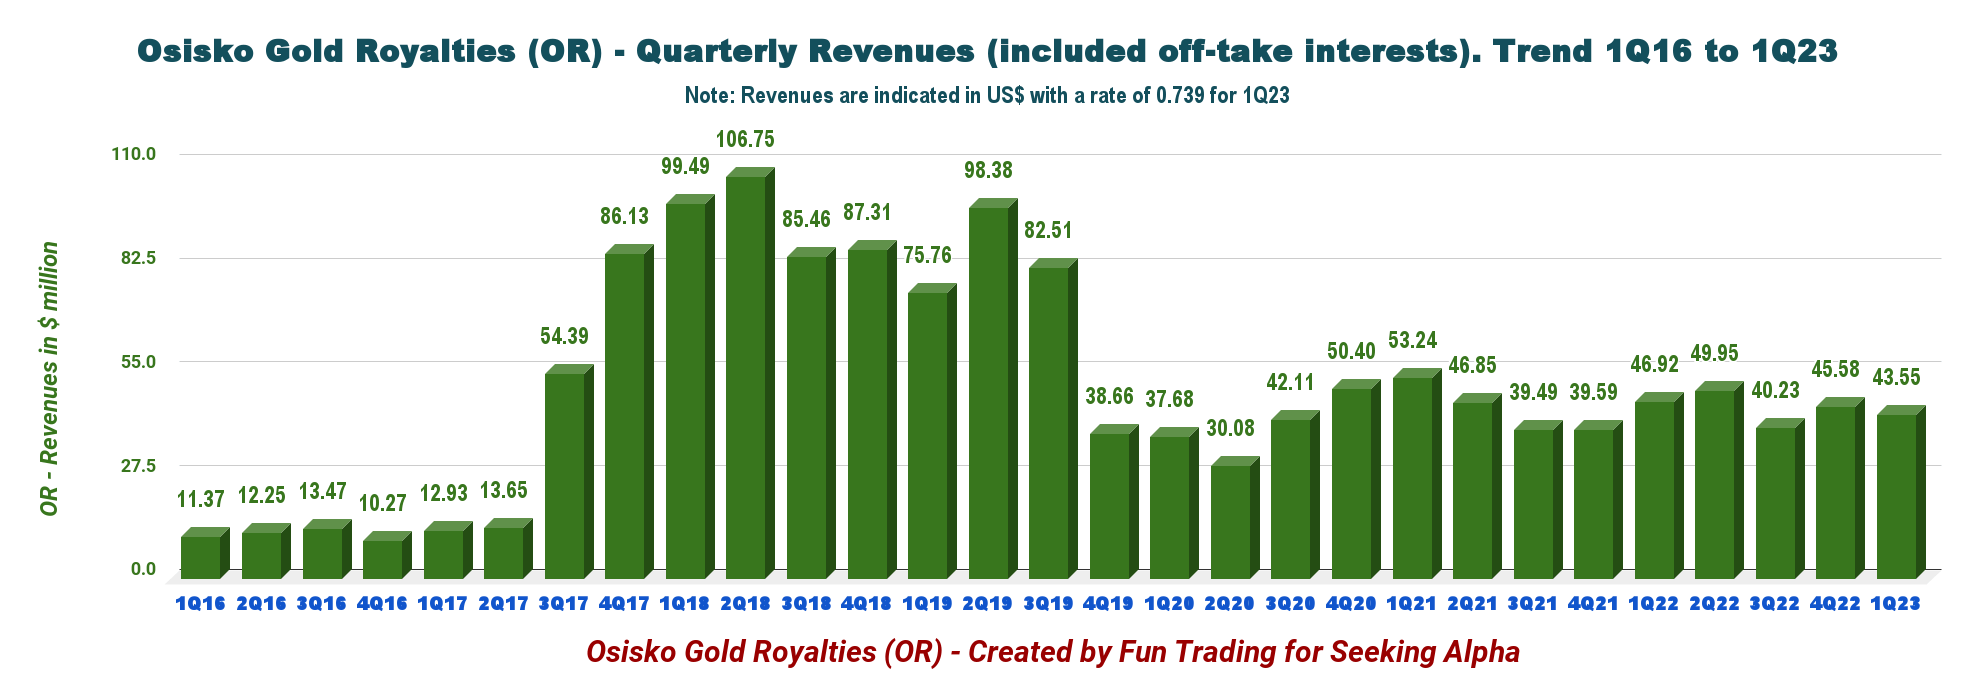
1 - Revenues were US$43.55 million in 1Q23.
OR Quarterly Revenue History (Fun Trading)
Osisko Gold Royalties posted revenues of US$43.55 million in the first quarter of 2023, up from US$40.04 million in the same quarter a year ago.
On a consolidated basis, the net income for the first quarter was US$15.24 million, compared to US$0.26 million in 1Q22. The Cash flow generated by operating activities from continuing operations was US$33.22 million.
In the first quarter of 2023, the operating cash margin was 93% from royalty and stream interests.
Canadian Malartic is the cornerstone royalty for Osisko, with the Odyssey underground on schedule, which will be transferred to Agnico Eagle ( AEM ) soon. The company owns over 175 royalties, streams, and offtakes. Most of the assets are located in North America.
OR Assets Map Presentation (OR Presentation)
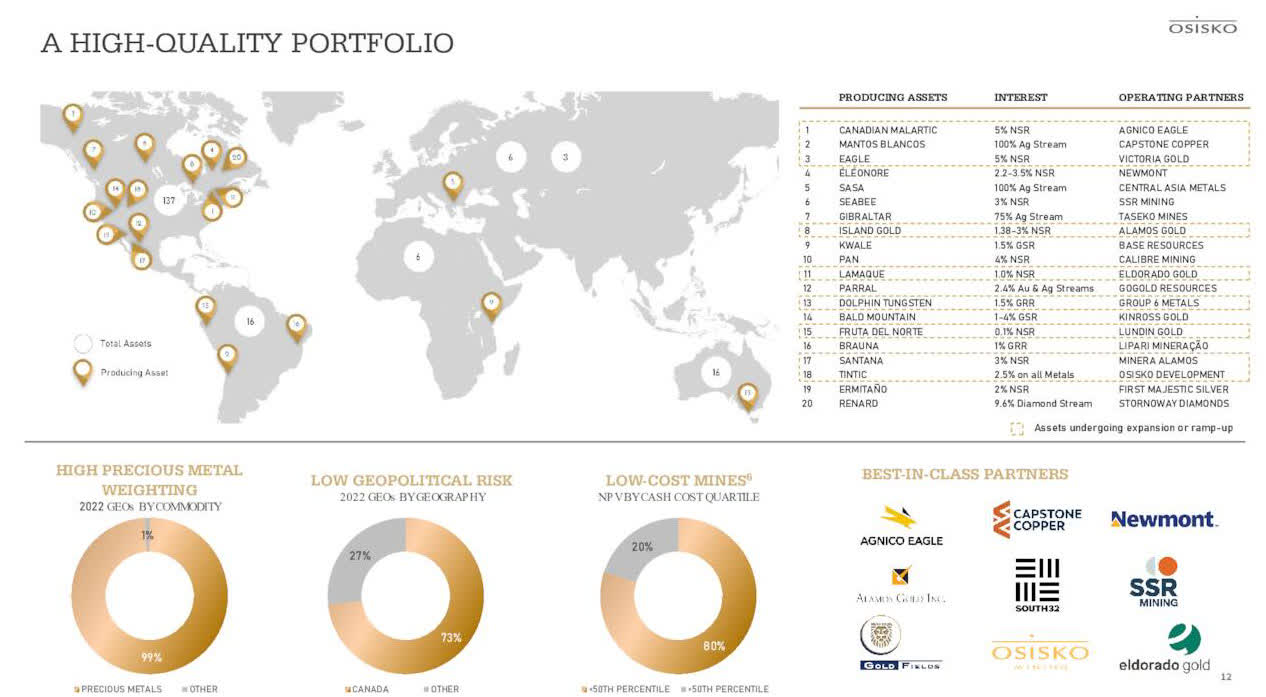
The company increased its dividend by 9% this quarter. CEO Sandeep Singh said in the conference call:
[W]e continue to build up cash and decided to share some of it by increasing our dividend by just over 9%. We've said it over and over that we continue to prioritize returns to shareholders and look for opportunities to do that and find the right balance in doing that.
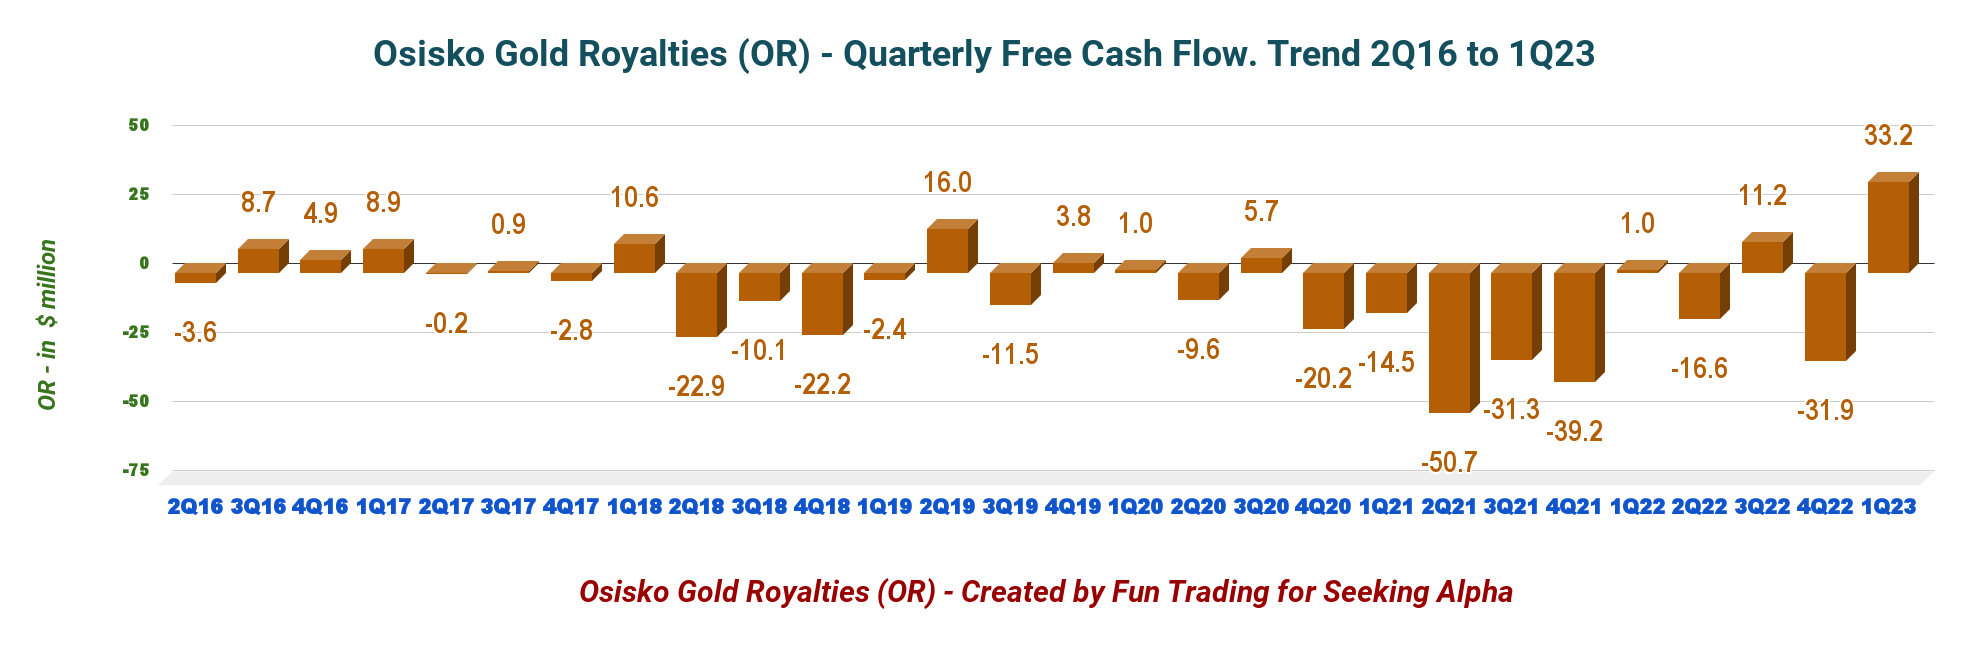
2 - Free cash flow was US$33.22 million in 1Q23
OR Quarterly Free Cash Flow History (Fun Trading)
Note: The generic free cash flow is the cash from operating activity minus Capex.
Free cash flow for the first quarter of 2023 was US$33.22 million, with a trailing 12-month free cash flow loss of US$4.01 million.
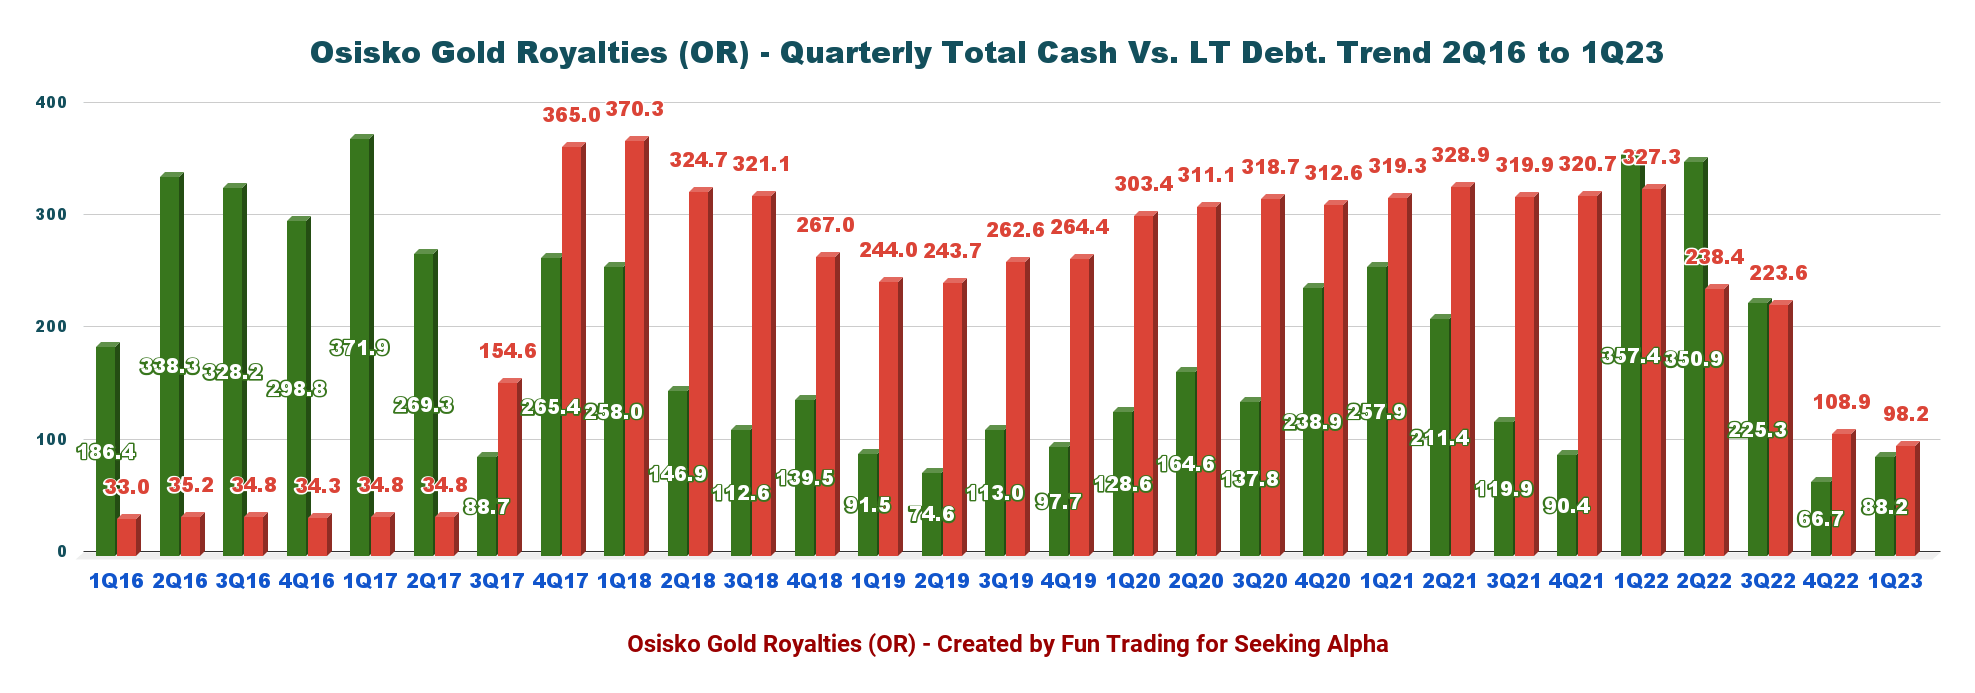
3 - No Net debt was US$9.97 million in 1Q23 and total cash of US$88.23 million.
OR Quarterly Cash versus Debt History (Fun Trading)
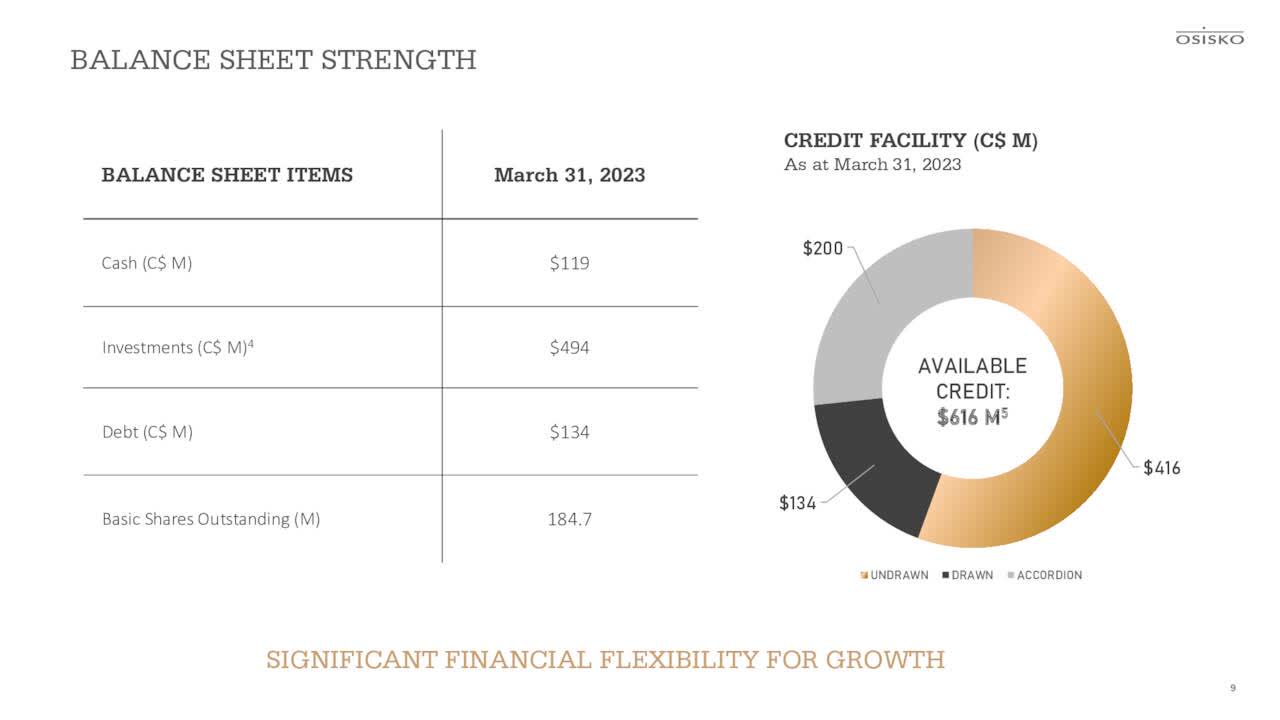
The Net debt was US$9.97 million in 1Q23, with a total cash position of US$88.23 million and total debt of US$98.2 million in 1Q23. Liquidity is approximately CAN $616 million or US $455 million.
During 1Q23, Osisko Gold Royalties repaid CAN$ 15.0 million under its revolving credit facility. The cash balance increased to CAN$119.1 million (US$88.23 million), resulting in a net debt position of CAN$15.9 (US$9.97 million) million as of March 31, 2023.
Below are the details as of March 31, 2023 (in CAN$):
OR Balance Sheet (OR Presentation)
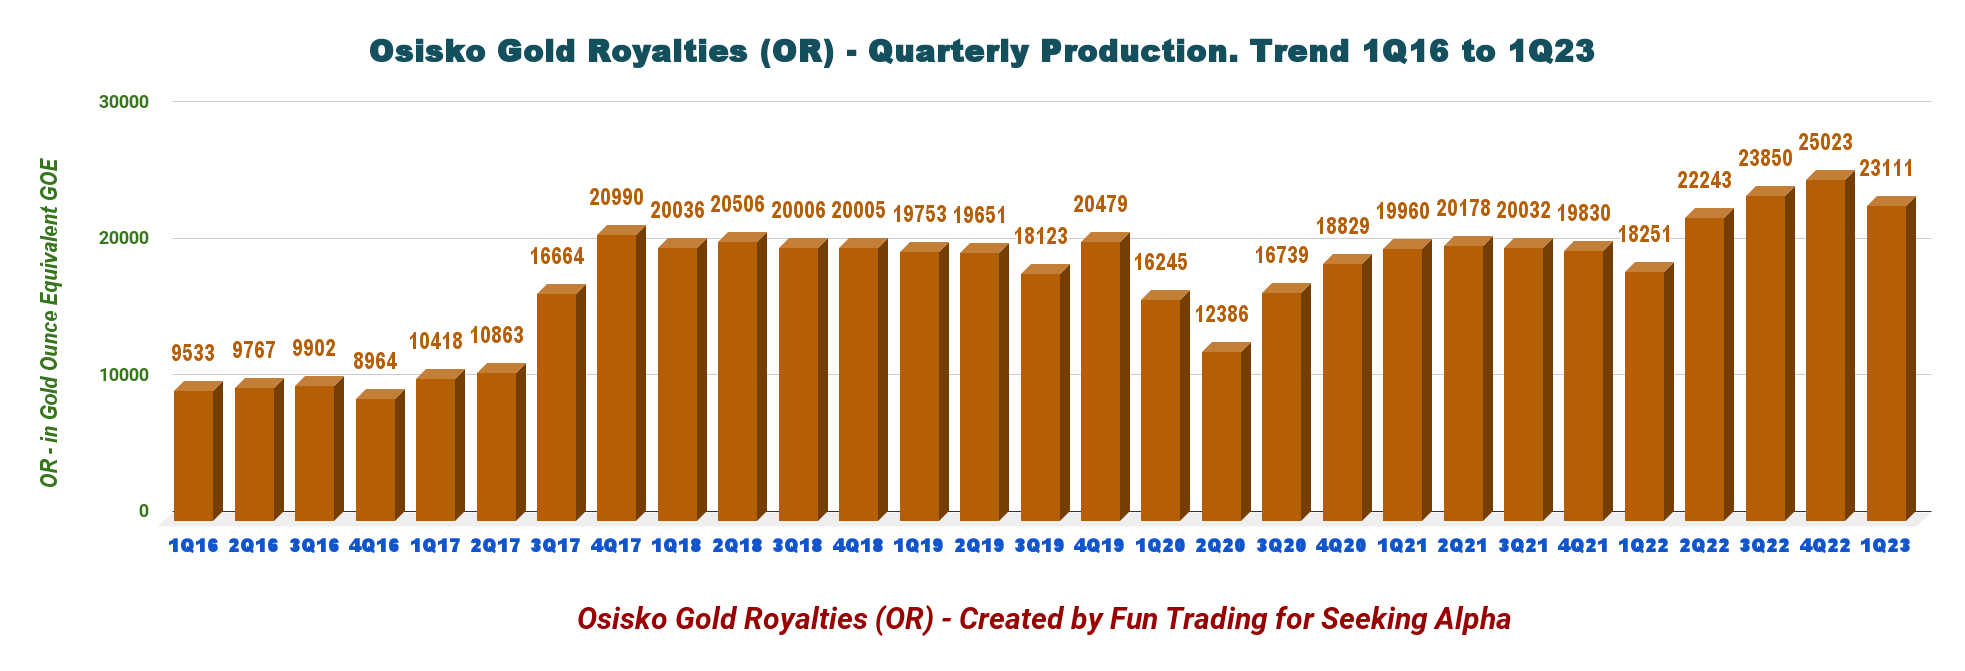
4 - Production in gold equivalent ounce and details
OR Quarterly Production History (Fun Trading)
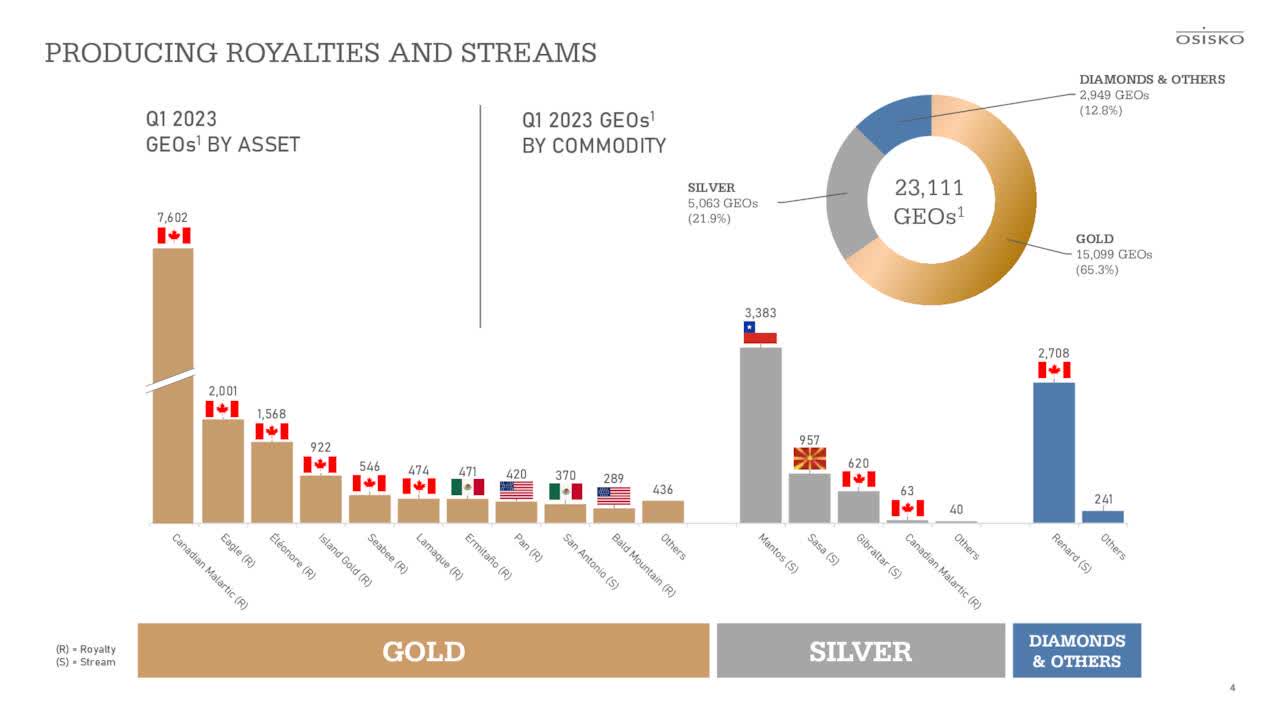
Osisko Gold Royalties produced 23,111 GEOs in the first quarter of 2023, up from 18,251 in 1Q22. Gold production represented 65.3% of the total production.
Canadian Malartic production was weak this quarter. However, the CEO Sandeep Singh expects higher production starting 2Q23 and said in the conference call:
The first production blast at Odyssey South was in late March, Agnico, our partner is expecting 50,000 ounces of underground contribution this year. Other progress includes the shaft sinking, which has now commenced. So good progress there overall and we expect good use over the course of the year.
OR Production Royalties and Streams (OR Presentation)
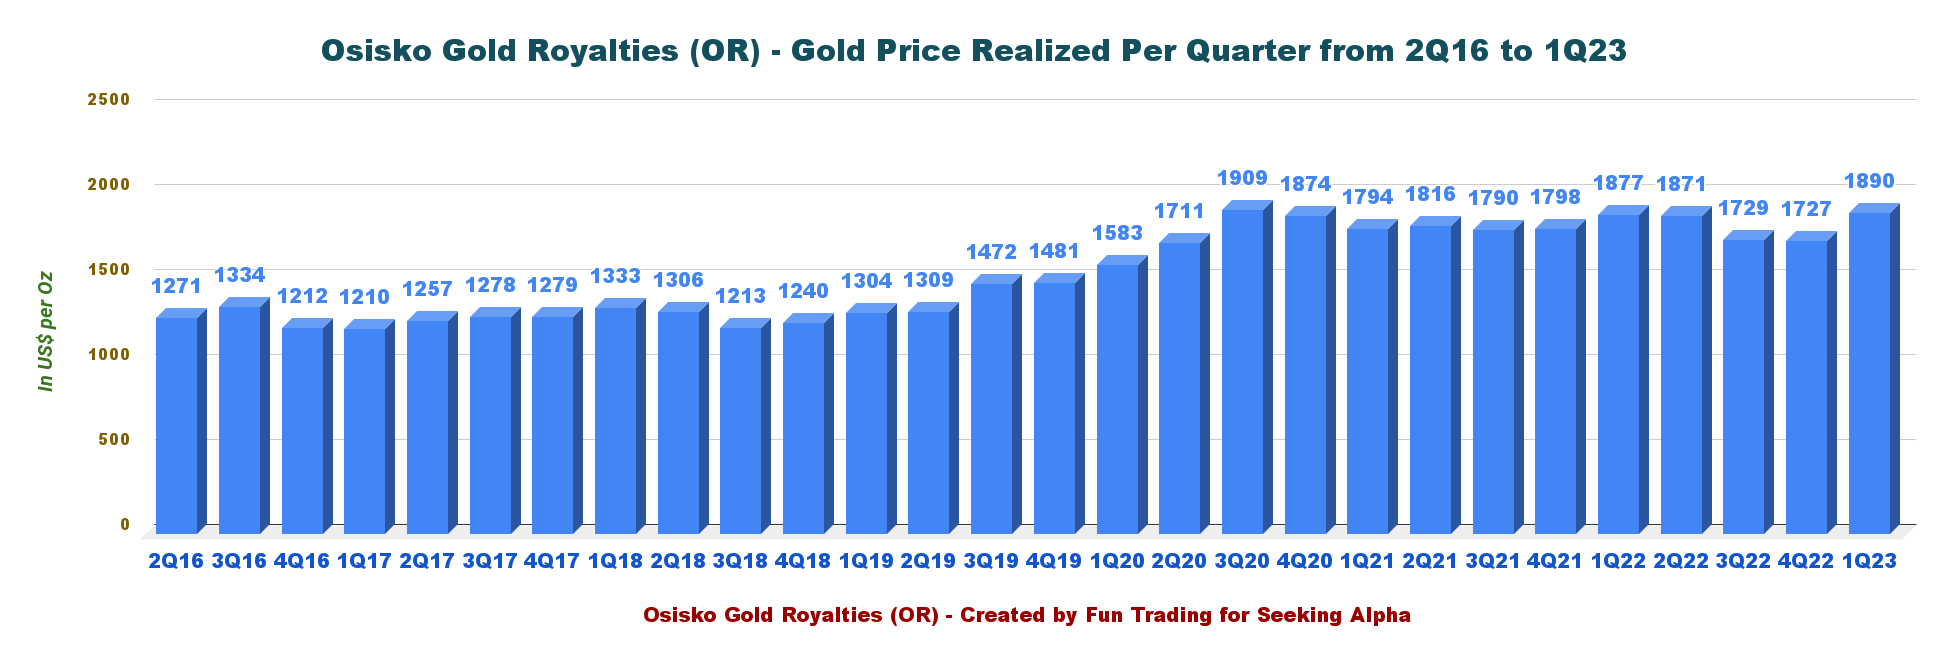
Gold price increased 1Q23 to $1,890 per oz, and silver was $22.55 per ounce.
OR Quarterly Gold Price History (Fun Trading)
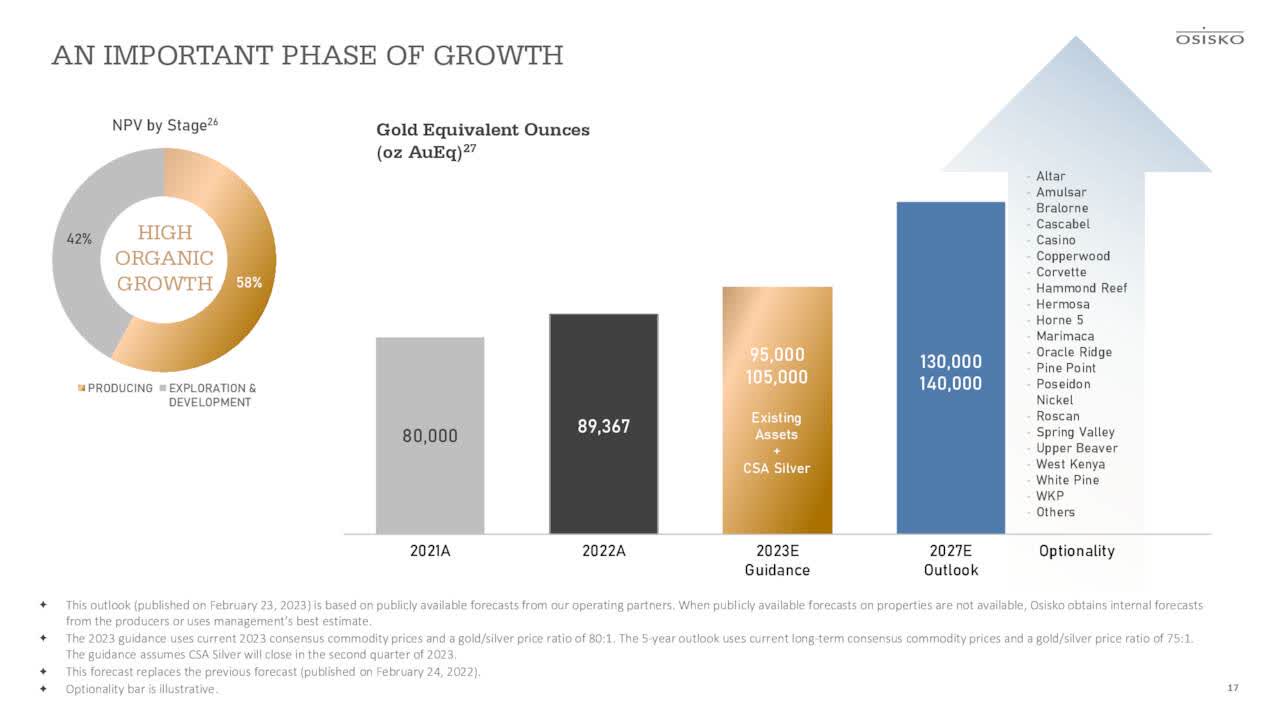
The company offers excellent growth potential, with an estimated production of 130K to 140K GEOs by 2027.
OR Guidance 2023-2027 (OR Presentation)
Technical Analysis And Commentary
OR TA Chart Short-term (Fun Trading StockCharts)
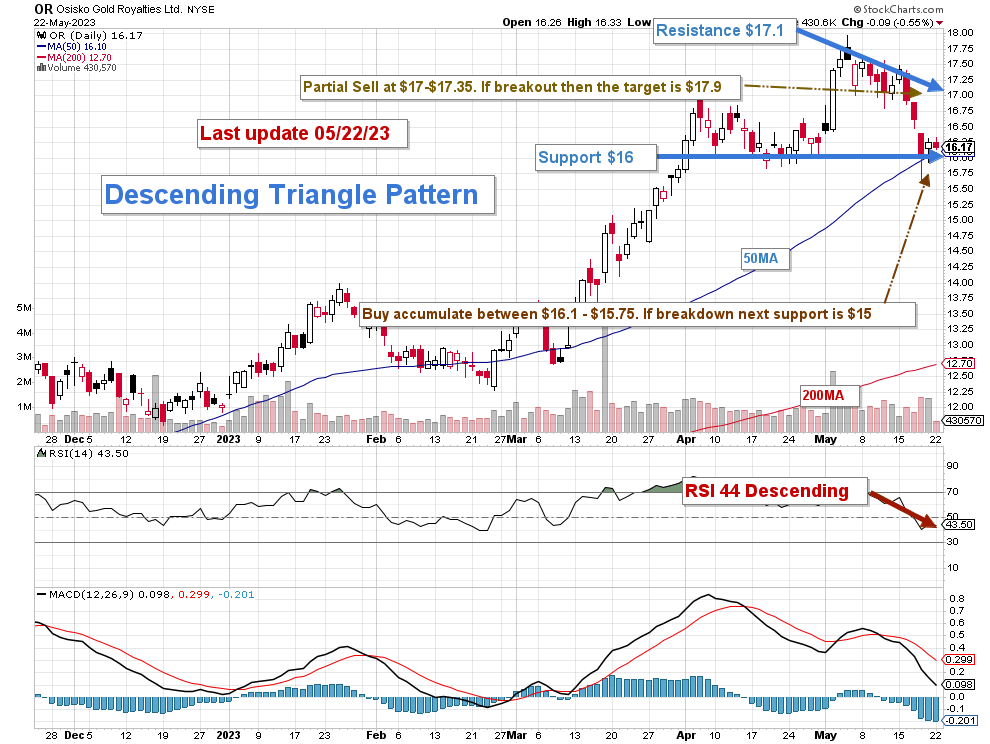
Note: The chart is adjusted from the dividend.
The stock OR forms a descending triangle pattern with resistance at $17.10 and support at $16. RSI is 44, which indicates a potential breakdown.
The descending triangle is a bearish formation that usually forms during a downtrend as a continuation pattern. There are instances when descending triangles form as reversal patterns at the end of an uptrend, but they are typically continuation patterns. Regardless of where they form, descending triangles are bearish patterns that indicate distribution.
The Osisko Gold Royalties Ltd short-term trading strategy is to trade LIFO about 50%-60% of your position. I suggest selling Osisko between $17 and $17.35, with possible higher resistance at $17.9, and waiting for a retracement between $16.1 and $15.75 to accumulate again, with potential lower support at $15.
Watch gold like a hawk.
Warning: The TA chart must be updated frequently to be relevant. It is what I am doing in my stock tracker. The chart above has a possible validity of about a week. Remember, the TA chart is a tool only to help you adopt the right strategy. It is not a way to foresee the future. No one and nothing can.
For further details see:
Osisko Gold Royalties: A Solid Track Record