QDIV - OUSA: An ETF Focused On Capital Preservation
2023-04-03 09:05:56 ET
Summary
- O’Shares FTSE U.S. Quality Dividend ETF holds a 100-stock portfolio based on quality, volatility and dividends.
- It is well-diversified across several GICS sectors, but ignores four of them.
- Quality metrics are attractive but not valuation.
- Past performance is average, but high quality and low volatility may help preserve the capital in a bear market.
This article series aims at evaluating ETFs regarding the performance of their strategies and quality metrics of their current portfolios. As holdings and weights change over time, updated reviews are posted when necessary.
Strategy and portfolio
O’Shares FTSE U.S. Quality Dividend ETF ( OUSA ) has been tracking the O’Shares U.S. Quality Dividend Index since 07/14/2015. It has 100 holdings, a dividend yield of 1.73% and an expense ratio of 0.48%. Distributions are paid monthly.
As described on O’Shares website , OUSA invests in “l arge-capitalization and mid-capitalization dividend-paying issuers in the United States that meet certain market capitalization, liquidity, high quality, low volatility and dividend yield thresholds. (…) The high quality and low volatility requirements are designed to reduce exposure to high dividend equities that have experienced large price declines”.
Eligible companies must meet conditions of free float (shares available on the open market) and trading volume. Then, they are screened and weighted based on four factors: quality, low volatility, dividend yield and dividend quality. The strategy rules changed in June 2020, with a greater emphasis on quality. Weight limits are applied to constituents and sectors. The underlying index is rebalanced quarterly and reconstituted annually.
The fund invests almost exclusively in U.S. companies (97.3% of asset value), and in large and mega-caps (94.6%). Therefore, I will use the S&P 500 ( SPY ) as a benchmark. Compared to this index, OUSA overweights healthcare, consumer discretionary, and to a lesser extent, financials, industrials and consumer staples. It underweights technology (which stays the fund’s heaviest sector though) and communication. It ignores energy, materials, real estate and utilities. Sector composition may change over time.
Sector breakdown (chart: author; data: ALPS Advisors, SSGA)
The fund is more expensive than the benchmark regarding valuation metrics, as reported in the next table. Price-to-earnings and price-to-cash-flow ratios are close to the S&P 500 values, but price-to-book and price-to-sales are materially higher.
| OUSA |
| SPY |
| Price/Earnings TTM |
| 20.51 |
| 19.89 |
| Price/Book |
| 5.24 |
| 3.64 |
| Price/Sales |
| 2.96 |
| 2.31 |
| Price/Cash Flow |
| 14.8 |
| 14.62 |
Source: Fidelity
The portfolio is quite concentrated in the top 10 holdings, listed in the next table: their aggregate weight is 39.4%. However, risks related to individual stocks are moderate: the heaviest position is Microsoft with 5.4%.
| Ticker |
| Name |
| Weight |
| EPS growth %ttm |
| P/E ttm |
| P/E fwd |
| Yield% |
| Microsoft Corp. |
| 5.40% |
| -4.31 |
| 32.06 |
| 30.96 |
| 0.94 |
| The Home Depot, Inc. |
| 4.77% |
| 7.51 |
| 17.69 |
| 18.62 |
| 2.83 |
| S&P Global, Inc. |
| 3.91% |
| -16.05 |
| 32.82 |
| 27.61 |
| 1.04 |
| Apple, Inc. |
| 3.87% |
| -2.28 |
| 28.02 |
| 27.65 |
| 0.56 |
| Johnson & Johnson |
| 3.79% |
| -13.75 |
| 23.00 |
| 14.74 |
| 2.92 |
| Merck & Co., Inc. |
| 3.79% |
| 11.08 |
| 18.62 |
| 15.41 |
| 2.74 |
| Marsh & McLennan Cos., Inc. |
| 3.75% |
| -1.60 |
| 27.62 |
| 21.92 |
| 1.42 |
| T. Rowe Price Group, Inc. |
| 3.45% |
| -49.05 |
| 16.89 |
| 16.92 |
| 4.32 |
| Pfizer Inc. |
| 3.36% |
| 42.09 |
| 7.45 |
| 11.27 |
| 4.02 |
| McDonald's Corp. |
| 3.31% |
| -16.85 |
| 33.51 |
| 26.40 |
| 2.17 |
Ratios from Portfolio123
Past performance
OUSA has underperformed SPY by about 1.5 percentage points in annualized return since inception in July 2015. Thanks to a lower volatility, the risk-adjusted performance (Sharpe Ratio in the next table) is close to the benchmark.
| Total Return |
| Annual Return |
| Drawdown |
| Sharpe ratio |
| Volatility |
| OUSA |
| 100.87% |
| 9.48% |
| -33.12% |
| 0.63 |
| 14.34% |
| SPY |
| 122.58% |
| 10.95% |
| -33.72% |
| 0.66 |
| 16.33% |
Data calculated with Portfolio123
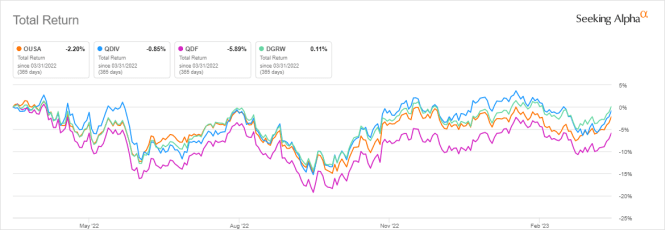
The next chart plots the total return of OUSA in the last 12 months, compared to 3 competitors in the same dividend and quality style:
- Global X S&P 500 Quality Dividend ETF ( QDIV )
- FlexShares Quality Dividend Index Fund ( QDF )
- WisdomTree U.S. Quality Dividend Growth Fund ( DGRW )
The WisdomTree fund is leading, but QDIV and OUSA are close behind.
OUSA vs. competitors (Seeking Alpha)
In previous articles, I have shown how three factors may help cut the risk in a dividend portfolio: Return on Assets , Piotroski F-score , and Altman Z-score .
The next table compares OUSA with a subset of the S&P 500: stocks with an above-average dividend yield, an above-average ROA, a good Altman Z-score, a good Piotroski F-score and a sustainable payout ratio. The subset is rebalanced annually to make it comparable to a passive index.
| Total Return |
| Annual Return |
| Drawdown |
| Sharpe ratio |
| Volatility |
| OUSA |
| 100.87% |
| 9.48% |
| -33.12% |
| 0.63 |
| 14.34% |
| Dividend quality subset |
| 138.13% |
| 11.93% |
| -38.04% |
| 0.69 |
| 16.88% |
P ast performance is not a guarantee of future returns. Data Source: Portfolio123
OUSA lags the dividend quality subset by 2.4 percentage point in annualized return. A note of caution: ETF performance is real and the subset is simulated. My core portfolio holds 14 stocks selected in this subset (more info at the end of this post).
Scanning the portfolio for quality
In my ETF reviews, risky stocks are companies with at least two red flags among: bad Piotroski score, negative ROA, unsustainable payout ratio, bad or dubious Altman Z-score, excluding financials and real estate, where these metrics are unreliable. Here, only two stocks are risky: Verizon Communications ( VZ ) and AT&T Inc. (T). Both have bad Piotroski and Altman scores, and AT&T has also a negative ROA (trailing 12 months). Together, they weigh only 2.6% of asset value, which is a good point.
According to my calculation of aggregate metrics, reported in the next table, OUSA is superior to the benchmark for Altman Z-score and ROA, and equivalent for Piotroski F-score. The weighted average ROA is especially good. These metrics point to an above-average portfolio quality.
| OUSA |
| SPY |
| Altman Z-score |
| 4.86 |
| 3.42 |
| Piotroski F-score |
| 5.55 |
| 5.56 |
| ROA % TTM |
| 13.33 |
| 7.61 |
Takeaway
O’Shares U.S. Quality Dividend ETF selects and weights 100 large-cap dividend stocks using quality and volatility metrics. Its top 3 sectors are technology, healthcare and consumer discretionary. Valuation ratios are not cheap, but aggregate quality metrics are better than in the S&P 500. OUSA has slightly underperformed the large cap benchmark since inception, but its shows a lower volatility. The low yield can’t satisfy income-seeking investors, but high quality and low volatility may help preserve the capital in a bear market.
For further details see:
OUSA: An ETF Focused On Capital Preservation