DFAT - OUSM: Safe High Quality Dividend Fund With No Regional Banks
2023-05-03 20:48:12 ET
Summary
- OUSM is a small/mid-cap dividend fund focused on the quality, low volatility, dividend yield, and dividend quality factors. Its trailing yield is 1.94% and the ETF has $215M in AUM.
- OUSM is 23% Financials but excludes Regional Bank stocks. A focus on return on assets was the reason, and the result is solid outperformance over other extended market funds YTD.
- A key advantage is OUSM's 0.96 five-year beta, low for the category. However, yield and dividend growth rates are also low. Its 0.48% expense ratio also cuts into net distributions.
- While I appreciate a focus on quality, OUSM doesn't seem suitable for dividend investors. I don't recommend buying.
Investment Thesis
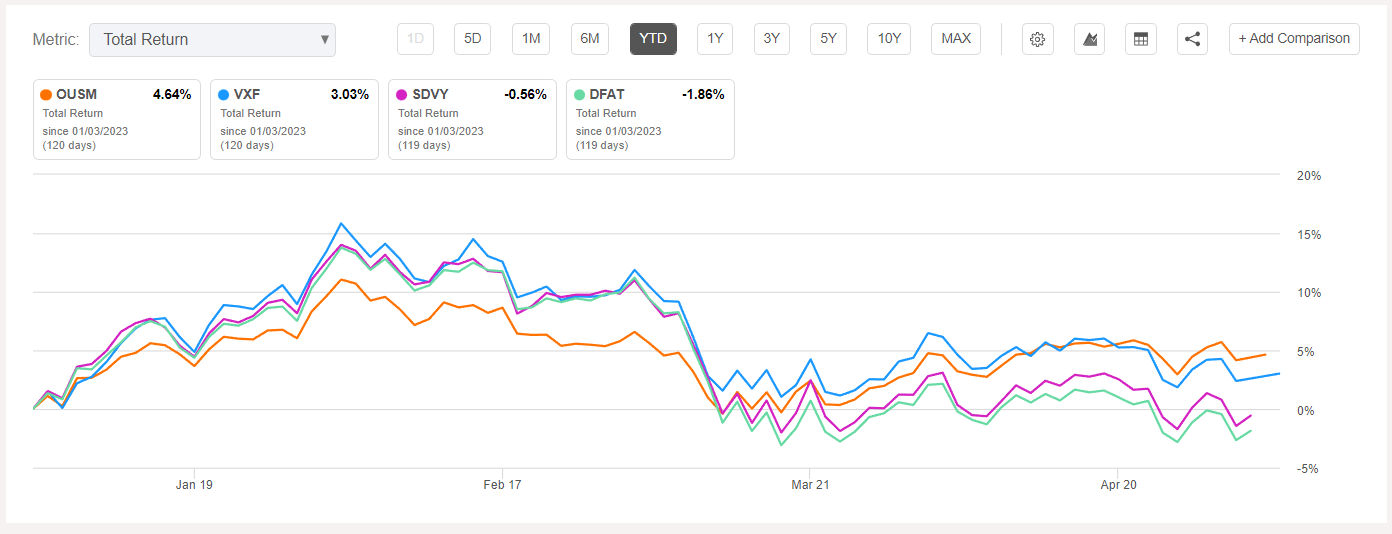
The Regional Bank fallout is hitting small-cap funds hard. Plain vanilla ETFs like the SPDR S&P 600 Small Cap ETF ( SLY ) have 9% exposure to this industry. Of course, hindsight is 20/20, but one value-oriented ETF managed to avoid the fallout altogether: the ALPS O'Shares U.S. Small-Cap Quality Dividend ETF Shares ( OUSM ). OUSM is outperforming SLY and other small/mid-cap funds YTD and this article aims to identify how OUSM did it and, more importantly, whether or not the outperformance will continue. I look forward to reviewing how the fund works and providing alternative ETFs to consider.
OUSM Overview
Strategy Discussion
Since June 2020, OUSM has tracked the O’Shares U.S. Small-Cap Quality Dividend Index. The Index rule book is at this link , and the ten points below summarize the selection process.
1. Eligibility begins with the S-Network US Equity Mid/Small-Cap 2500 Index, which includes securities ranked 501-3000 by market capitalization. Members must also pass a liquidity screen.
2. Energy, Materials, and Real Estate securities are not eligible.
3. Constituents are selected by ranking their score-modified float-adjusted market cap weight. Scores are based on four factors: quality, volatility, dividend yield, and dividend quality.
4. Quality: 70% ROA, 30% Total Net Debt / EBITDA. For Financial securities, it's 100% ROA.
4. Volatility: trailing five-year weekly volatility, with higher scores assigned to less volatile securities.
5. Dividend yield: logarithm of the trailing twelve-month regular cash dividend yield, with higher scores assigned to higher-yielding securities.
6. Dividend Quality: 50% Income Available to Common Shareholders / Gross Dividends, 50% trailing five-year regular cash dividend growth.
7. Each security's float-adjusted market cap is multiplied by each factor score to arrive at a score-modified float market cap. The top 200 ranked companies initially qualify.
8. The number of constituents per sector is capped at 20. Securities are removed based on their quality scores at each reconstitution. With eight sectors to select from, the maximum number of securities is 160.
9. There is a process to cap security and sector weights at 2% and 22%.
10. Annual reconstitutions are effective after the third Friday in September.
The selection process seems reasonable, but I have three key takeaways. First, despite the name, OUSM is not a small-cap dividend fund. It's float-adjusted market-cap-weighted on a mid/small-cap Index, meaning it tilts more toward mid-caps. Second, the Index excludes Energy, Materials, and Real Estate. That screen helps keep the Index less volatile but doesn't provide much inflation protection.
The third takeaway was the 100% ROA weighting for Financial securities. This screen is how OUSM avoided the Regional Bank fallout. Based on Seeking Alpha data I collected before the crisis on February 28, 2023, three Regional Bank ETFs ( IAT , KBWR , KRE ) had ROA ratios of 1.10%, 1.19%, and 1.05%, respectively. QABA , a Community Bank ETF, had a 1.22% ROA, which paled in comparison to the 5.80% figure offered by the iShares U.S. Financial Services ETF ( IYG ) at the time. Today, the average ROA for Regional Banking stocks is just 1.15%, so I don't expect OUSM to select any going forward.
Sector Exposures and Top Ten Holdings
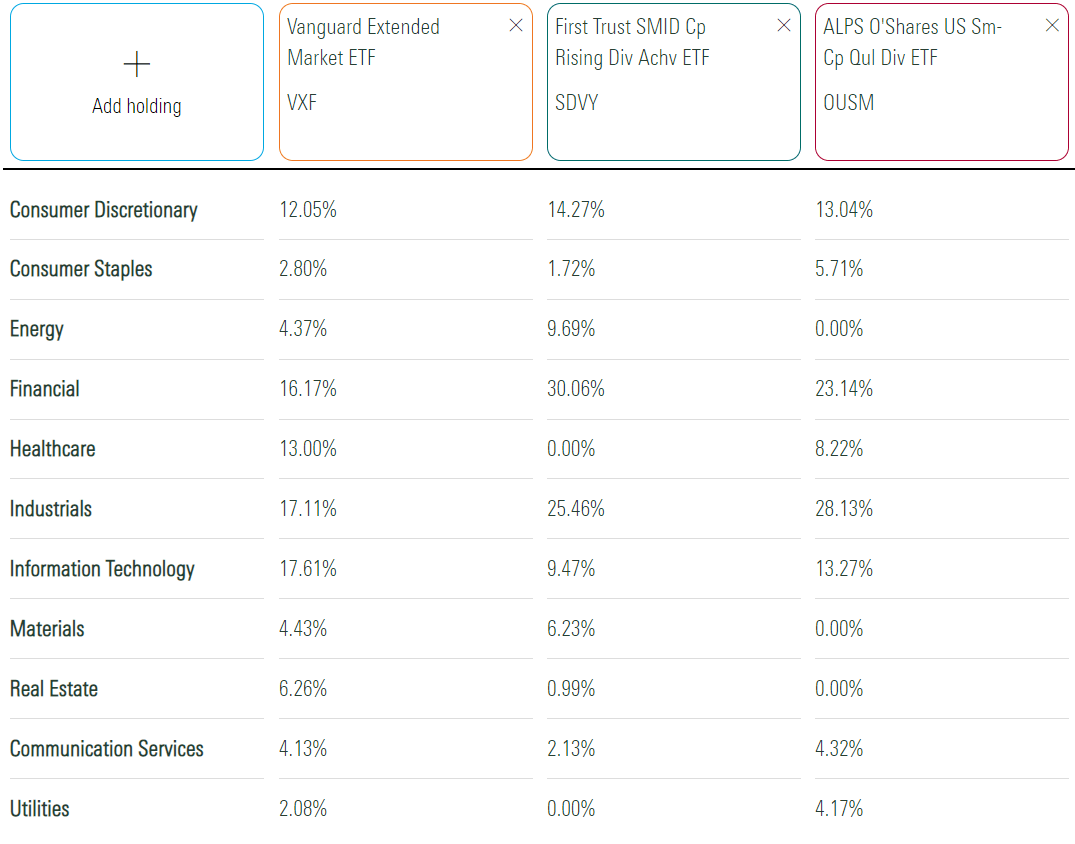
The following table highlights OUSM's sector exposures alongside the Vanguard Extended Market Index ETF ( VXF ) and the First Trust SMID Cap Rising Dividend Achievers ETF ( SDVY ). Remember that OUSM is an extended market ETF, so comparing it against small-cap ETFs with much lower market capitalizations would be misleading.
Morningstar
OUSM may avoid Regional Banks, but Financials comprise 23% of the portfolio. That figure is 30% for SDVY, arguably its closest comparator. OUSM also overweights Industrials (28%) and has 13% exposure to Consumer Discretionary and Technology. VFX, a benchmark for the extended market, is 26% Technology but is low yielding. For the sectors OUSM includes, the balance seems reasonable.
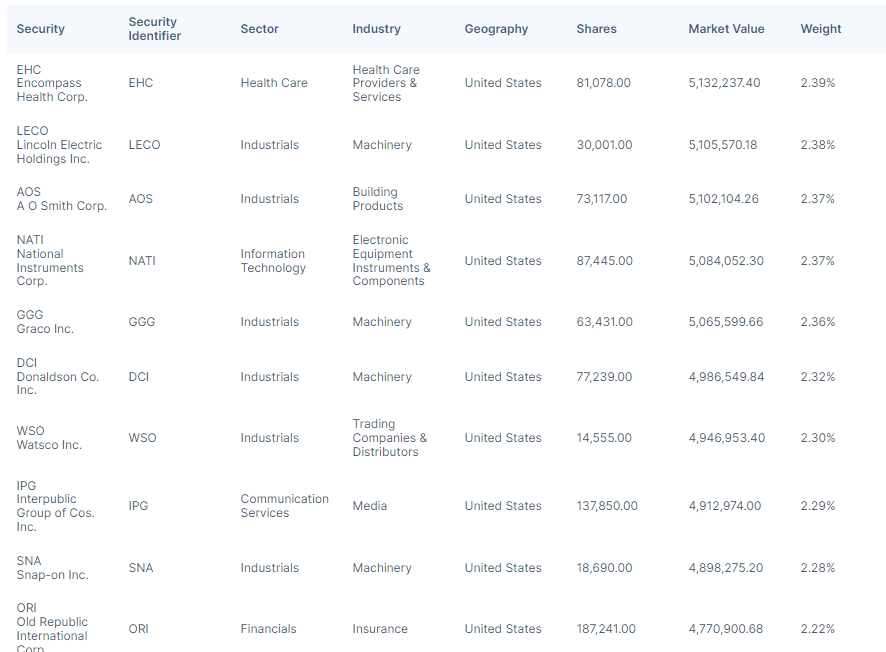
OUSM's top ten holdings are listed below. There are 116 in total, but the most prominent are Encompass Health ( EHC ), Lincoln Electric Holdings ( LECO ), and A.O. Smith ( AOS ).
ALPS Advisors
Performance Analysis
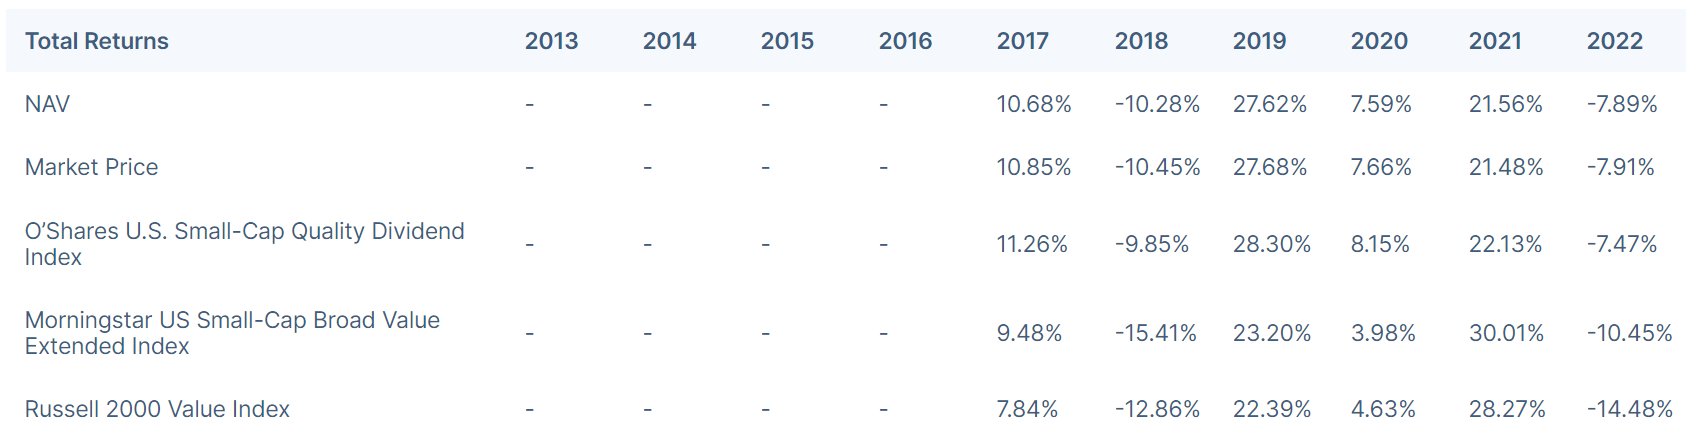
The APLS Advisors' website lists calendar year returns for OUSM, its Index, the Morningstar US Small-Cap Broad Value Extended Index, and the Russell 2000 Value Index. As a reminder, the ETF has only tracked the current Index since June 2020. However, we can see OUSM underperformed in 2021 but outperformed in 2022. These are small-cap benchmarks, though, so they aren't the best comparators.
ALPS Advisors
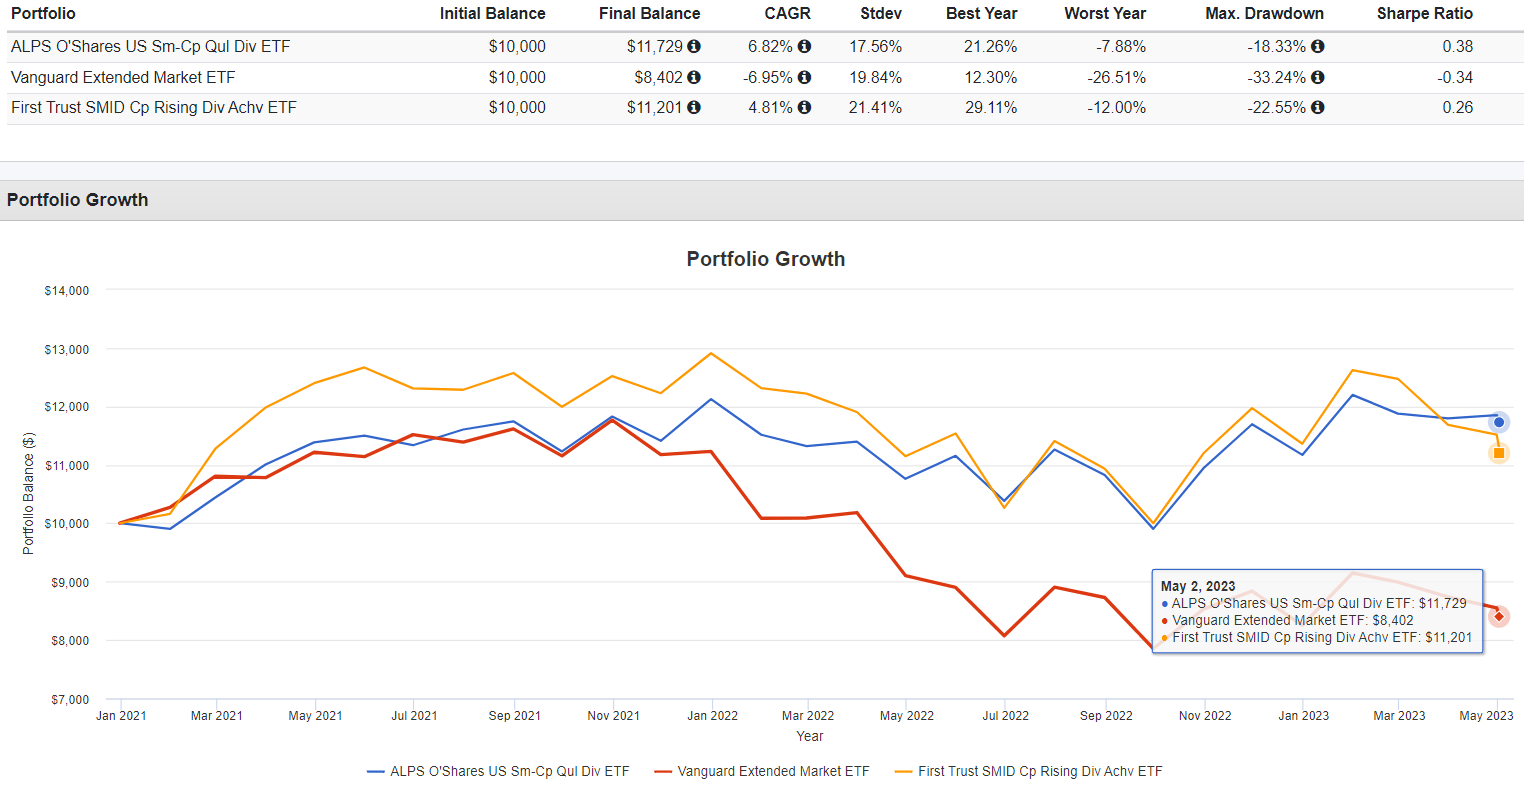
Since January 2021, OUSM has outperformed VXF and SDVY by an annualized 13.77% and 2.01%, respectively. It also was less volatile, leading to better risk-adjusted returns (Sharpe Ratio).
Portfolio Visualizer
OUSM's 2021 returns were average in a peer group of 14 extended market ETFs. However, its 2022 returns were second-best in the category. The Dimensional U.S. Targeted Value ETF ( DFAT ) is worth considering if your primary objective is total return rather than dividends or dividend growth.
OUSM Fundamental Analysis
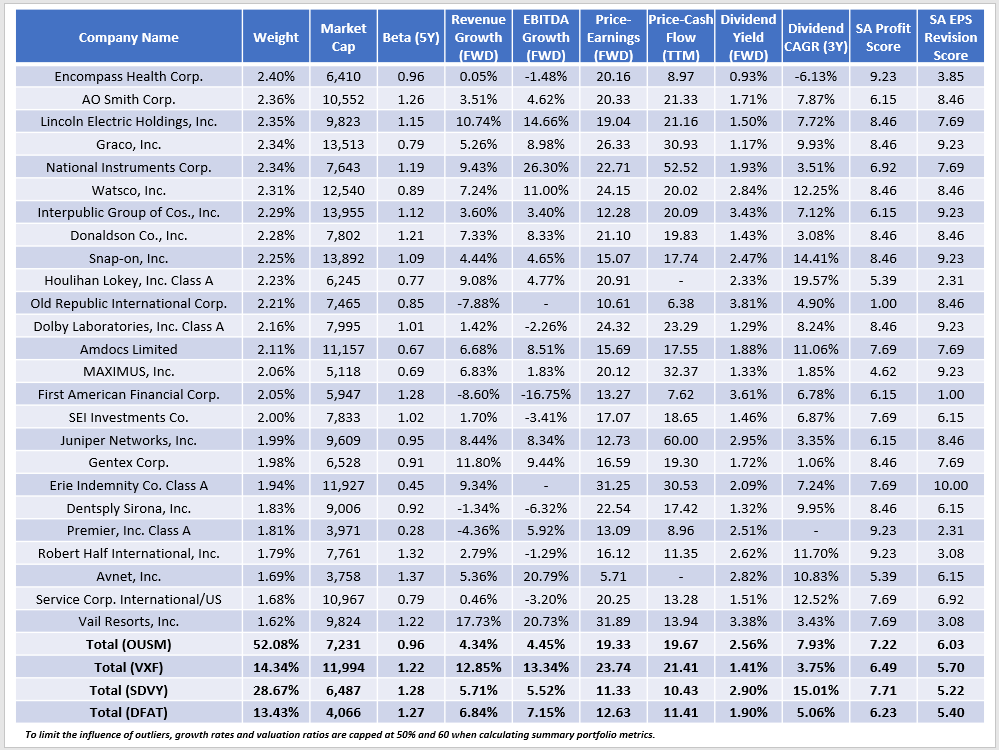
The following table highlights selected fundamental metrics for OUSM's top 25 holdings, which total 52% of the portfolio. Summary metrics for OUSM, VXF, SDVY, and DFAT are in the final rows.
The Sunday Investor
A few observations:
1. OUSM is the least volatile of the four, as indicated by its 0.96 five-year beta. It's low for a small/mid-cap value fund, primarily because its Index excludes Energy and Materials. The exclusion of Regional Bank stocks, while not explicitly written in the Index rules, also cuts down slightly on volatility. VXF, SDVY, and DFAT have 4.89%, 13.20%, and 13.80% exposure to Regional Banks. This industry may look great on paper, as it typically combines a high dividend yield with a low valuation. However, the previously hidden risks are clear to all now. OUSM's ROA quality screen worked, and shareholders are reaping the rewards this year.
Seeking Alpha
2. OUSM trades at 19.33x forward earnings, which I consider elevated for the estimated sales and EBITDA growth offered (4.34% and 4.45%). However, while VXF offers a much better growth and valuation combination, 28% of the portfolio by weight reported a net income loss over the last twelve months. We see this reflected in lower profitability scores for VXF and DFAT. SDVY's 7.71/10 score is better but remember that its top industry is Regional Banks. For a dividend growth ETF, that's not a composition to be relied on.
3. OUSM has the highest EPS Revision Grade (6.03/10) and is an outlier among extended market ETFs. The next best is the Motley Fool Next Index ETF ( TMFX ), but its 0.50% expense ratio, 0.21% dividend yield, and 31x forward price-earnings valuation indicate it's inappropriate for dividend investors.
Dividends
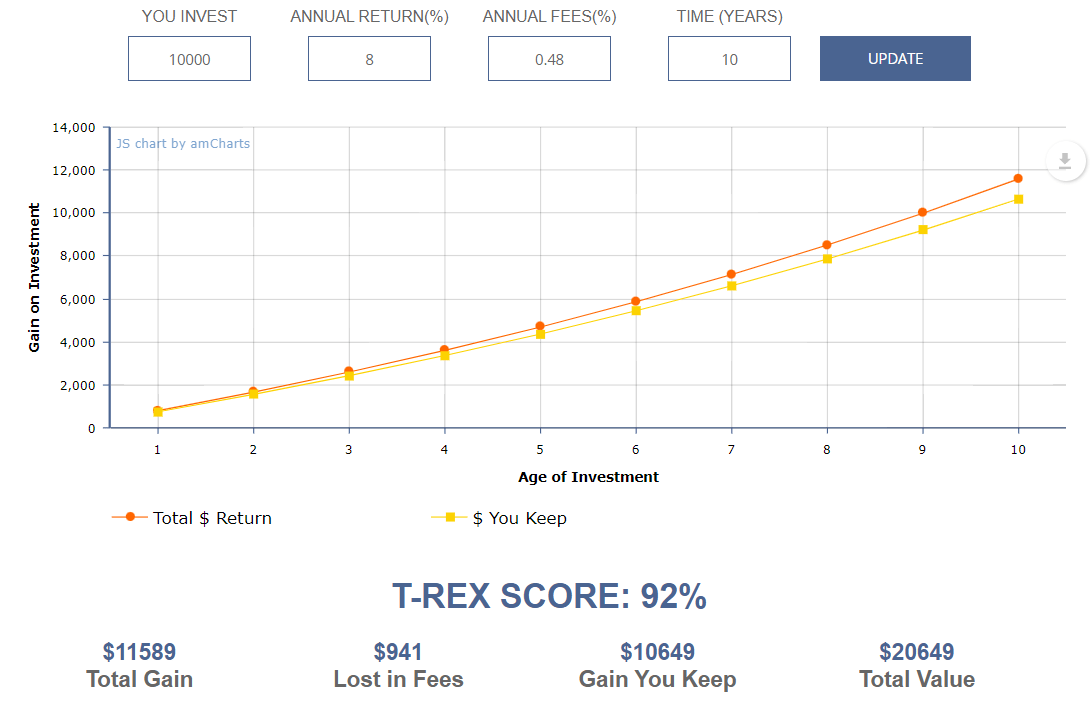
The table above highlights OUSM's 2.56% gross dividend yield and 7.93% five-year dividend growth rate. Those are current Index figures and do not account for fees. After subtracting OUSM's 0.48% expense ratio, shareholders will net just 2.08%. Unfortunately, OUSM's high fees are a primary reason I won't rate OUSM a buy. The fees represent 19% of the Index yield and will compound, just like dividends. According to this calculator , assuming an 8% annual return over ten years, you will have lost 8% of your total gains to fees. Over 20 years, that figure is 11%.
Larry Bates
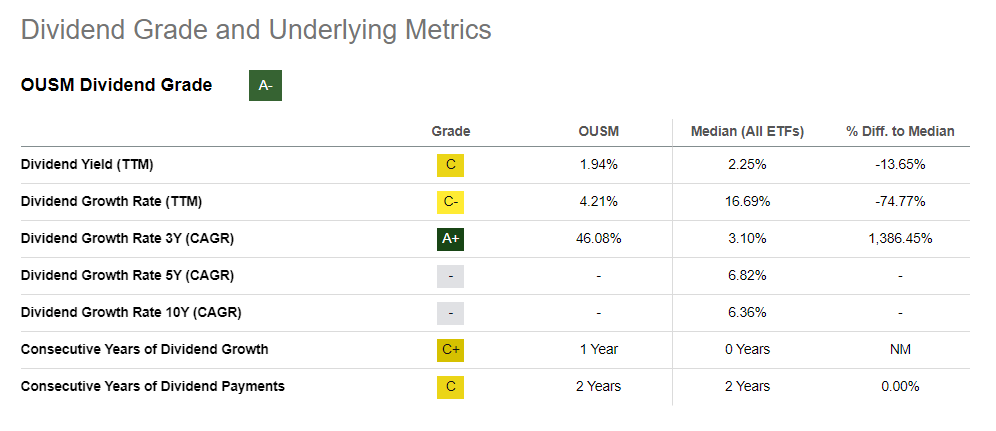
OUSM's trailing dividend yield is 1.94%, and the fund grew distributions by 4.21% over the last year. However, its three-year dividend growth rate is 46.08%, contributing to a strong "A-" Dividend Grade. Let's take a closer look at the calculation behind that number.
Seeking Alpha
OUSM makes monthly distributions, with the last twelve totaling $0.6808 per share. To calculate the three-year dividend growth rate, we divide it by cumulative dividends from May 2019 to April 2020. However, Seeking Alpha's distribution data goes back to January 2020, so eight months are missing. Instead, the calculation assumes no dividend payment in those months, thus inflating the dividend growth figure. As more data comes in, readers should see OUSM's three-year dividend growth rate decline, as should the overall dividend grade.
Instead, I used distribution data from the ALPS Advisors website and calculated the following annualized growth rates:
- 1Y: 11.22%
- 2Y: 12.56%
- 3Y: 3.12%
- 4Y: 3.39%
- 5Y: 0.90%
These growth rates aren't strong and are another mark against the fund. It's not a good fit for most dividend investors.
Investment Recommendation
OUSM may be suitable for small- and mid-cap investors with a total return objective. Its low volatility feature is rare among its category peers, and its quality screen proved effective because it steered clear of the risky Regional Banking industry. As the crisis unfolds , OUSM may outperform even more. However, that's more of a reason not to invest in other extended market funds rather than a reason to buy OUSM.
OUSM has a low 2.08% expected dividend yield, and low sales and EBITDA growth likely won't lead to an improved dividend growth rate. Furthermore, the 0.48% expense ratio runs counter to the investment objectives of dividend investors. Therefore, I don't recommend readers buy OUSM, and I look forward to continuing the discussion in the comments section below.
For further details see:
OUSM: Safe, High Quality Dividend Fund With No Regional Banks