ALTL - Pacer Lunt Large Cap Alternator ETF: This One's Easy Don't Buy
2023-04-06 08:00:00 ET
Summary
- ALTL alternates between a low-volatility and high-beta S&P 500 portfolio based on a relative strength signal. Fees are 0.60%, and ALTL has outperformed the S&P 500 since June 2020.
- However, don't be fooled by this "outperformance". ALTL has only selected the winning portfolio 48% of the time. ALTL beat SPY because the high-beta portfolio was preferable more times.
- This article demonstrates how readers can save themselves the trouble and fees by investing in the underlying ETFs themselves. This approach has a better chance than ALTL in market downturns.
- There's also the question of whether SPLV, ALTL's low-volatility choice, is optimal. My performance chart highlighting returns for 18 low-volatility ETFs suggests it's not.
- I've rated ALTL as a sell because of its poor success rate, sub-optimal selections, and high fees. Investors should avoid it.
Investment Thesis
By reader request, today's article discusses the Pacer Lunt Large Cap Alternator ETF ( ALTL ), a fund whose strategy is to alternate between the S&P 500 Low Volatility Index and the S&P 500 High Beta Index according to a relative strength indicator. Since its June 2020 launch, ALTL has outperformed the SPDR S&P 500 Trust ETF ( SPY ) by 20%. Therefore, it's easy to understand why you might be willing to pay Pacer's relatively high 0.60% expense ratio.
However, I strongly recommend against doing so, and ALTL gets an easy "sell" rating from me. In this article, I will discuss how ALTL's model has a poor track record of selecting the "correct" portfolio each month, the importance of risk-adjusted returns, and why at least one of its underlying Indexes isn't the optimal choice. I look forward to explaining why in further detail next.
Performance Analysis
I want to change the format for how I usually analyze ETFs and focus primarily on performance. Without knowing anything about how ALTL works, please consider the following three-year rolling returns graph and make some observations about the two portfolios. I'll offer my own afterward.
Portfolio Visualizer
1. Portfolio 1 has generally lagged behind Portfolio 2 over the last 12 years. There was a brief period for the three years ending February 2019, where Portfolio 1 outperformed by about 1% per year. However, that was short-lived.
2. Portfolio 1 crashed hard in the early stages of the pandemic. For the three years ending March 2020, Portfolio 1 lost an annualized 0.44% compared to a 5.05% gain for Portfolio 2. It took about two more years for the two portfolios' three-year returns to be equal again.
3. However, Portfolio 1 is ahead by more than 5% per year for the period ending March 2023. The reason is that the poor Q1 2020 results rolled over.
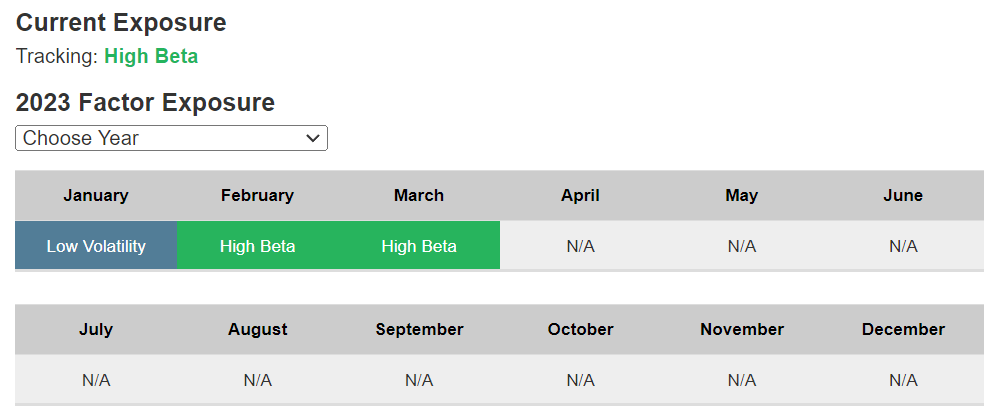
Portfolio 2 is the SPDR S&P 500 ETF and Portfolio 1 is a 50/50 weighting (rebalanced monthly) of the Invesco S&P 500 Low Volatility ETF ( SPLV ) and the Invesco S&P 500 High Beta ETF ( SPHB ). You might wonder why I set it at a 50/50 weighting, given how ALTL's goal is to identify which portfolio is superior ahead of time. The reason is that ALTL has "gotten it right" only 16/33 times for the 33 months between July 2020 and March 2023. Pacer provides the factor exposure history under the "Portfolio" tab on its fund page. I counted how many times its selected portfolio matched the "winning" portfolio each month: SPLV or SPHB. Here's an Excel sheet summarizing the results and a link to the Portfolio Visualizer graph above.
Pacer ETFs
Because of the poor win rate, investors could have achieved similar success by buying SPLV and SPHB in equal proportions and rebalancing every six months or so. Therefore, the benefit of the strategy is reduced to what any ETF offers: the ability to rebalance without creating tax consequences for the shareholder. Take away the six-month rebalancing, which might only sometimes be beneficial, and no advantage remains. I don't know why that commands a 0.60% fee each year.
Portfolio Visualizer
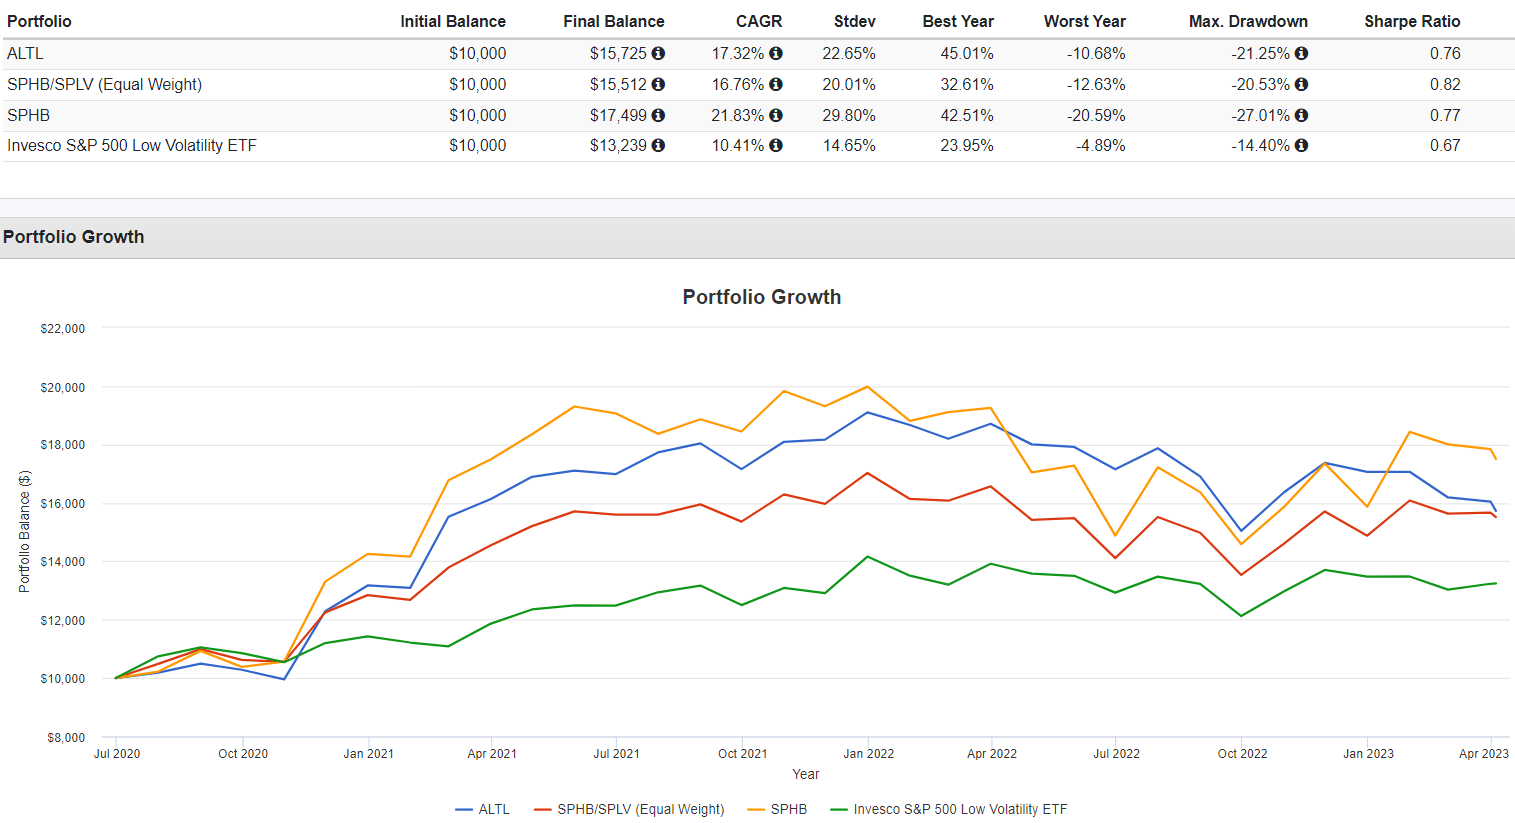
ALTL's 17.32% gain is slightly better than the equal-weighted portfolio's 16.76% return. SPHB and SPLV gained an annualized 21.83% and 10.41%, respectively. Still, you might conclude ALTL has delivered, but look at the volatility (standard deviation) and risk-adjusted returns (Sharpe Ratio). They're inferior and indicate that ALTL's extra gain was because it spent most of its time in an upward-trending market. Unless you dismiss its 48% win rate and have reason to believe it will improve going forward, the earlier graph is the more likely outcome. ALTL will continue to play the guessing game and lag what a more straightforward equal-weight approach would accomplish in less-bullish markets. It may not have even been around today had it launched before the major bull market in Q2 2020.
SPLV: Not The Optimal Choice
When creating ALTL, Pacer Lunt managers had two choices. They could design their own high/low beta portfolios, similar to how OMFL operates in the expansion/slowdown phases. Or, they could use ready-made Indexes. They chose the latter, perhaps for financial reasons, but that's not necessarily in the best interest of shareholders. To illustrate, consider the following returns of large- and total-market-cap low-volatility ETFs.
The Sunday Investor
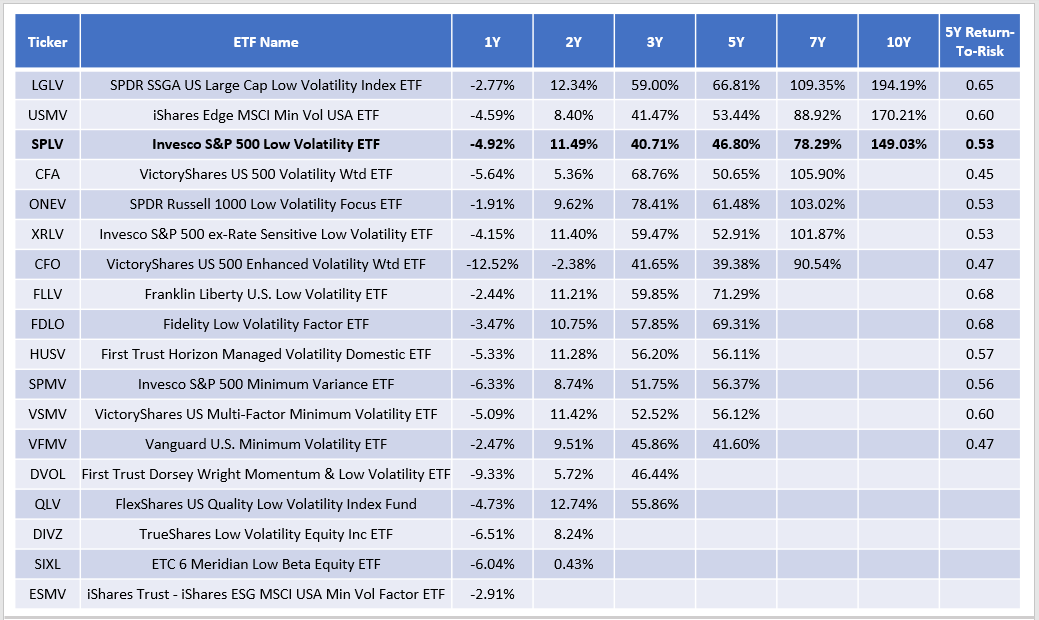
There are only three low-volatility ETFs with a ten-year track record, but SPLV's 149% gain was the worst. The iShares MSCI USA Minimum Volatility ETF ( USMV ) outpaced LGLV by 21%, and the SPDR SSGA US Large Cap Low Volatility Index ETF ( LGLV ) leads by 45%. The selection universes are more extensive for these two ETFs, and as a result, betas tend to be slightly higher than LGLV. Still, their five-year return-to-risk ratios are superior. Unfortunately, this sometimes happens when managers opt for what's effectively a fund-of-funds strategy. Maybe it's because they wanted to hold a strict S&P 500 portfolio, but I imagine most investors don't care. They're results-oriented, and as long as the risk taken isn't outside their tolerance, they'll choose the ETF most likely to deliver the highest returns. That's not SPLV.
On the other end, SPHB was likely chosen because of the lack of alternatives. Using FactSet as my guide, SPHB is the only U.S. equity ETF I could find with "High Beta" listed as the strategy. Here are a few of its distinguishing features:
- Five-Year Beta: 1.47
- Weighted Average Market Capitalization: $144 billion
- Forward Price-Earnings Ratio: 26.46
- Trailing Price-Earnings Ratio: 32.12
- Forward Revenue Growth Rate: 11.98%
- Forward EBITDA Growth Rate: 10.67%
To summarize, SPHB holds highly volatile stocks but avoids mega-caps that would drive up its market capitalization figure closer to around $500 billion, like with the SPDR S&P 500 ETF. These stocks trade at higher valuations but have double-digit estimated revenue and EBITDA growth rates. For reference, SPY trades about three points lower on forward earnings, and its growth rates are about 4% less. You may also consider the ARK Innovation ETF ( ARKK ) as an alternative, but that fund typically holds too many unprofitable, speculative stocks. At least with SPHB, there's a minimum level of quality.
Investment Recommendation
ALTL is an easy "sell" recommendation for me because it's clear the strategy hasn't worked. Its model selected the correct portfolio only 48% of the time since its June 2020 launch, indicating it's essentially guessing. Any favorable backtested results have the benefit of hindsight, and it isn't easy to find a rules-based ETF that doesn't look great in retrospect. ETFs need convincing marketing materials to help them get off the ground, and no prospective investor will be impressed with poor or even mediocre backtested results.
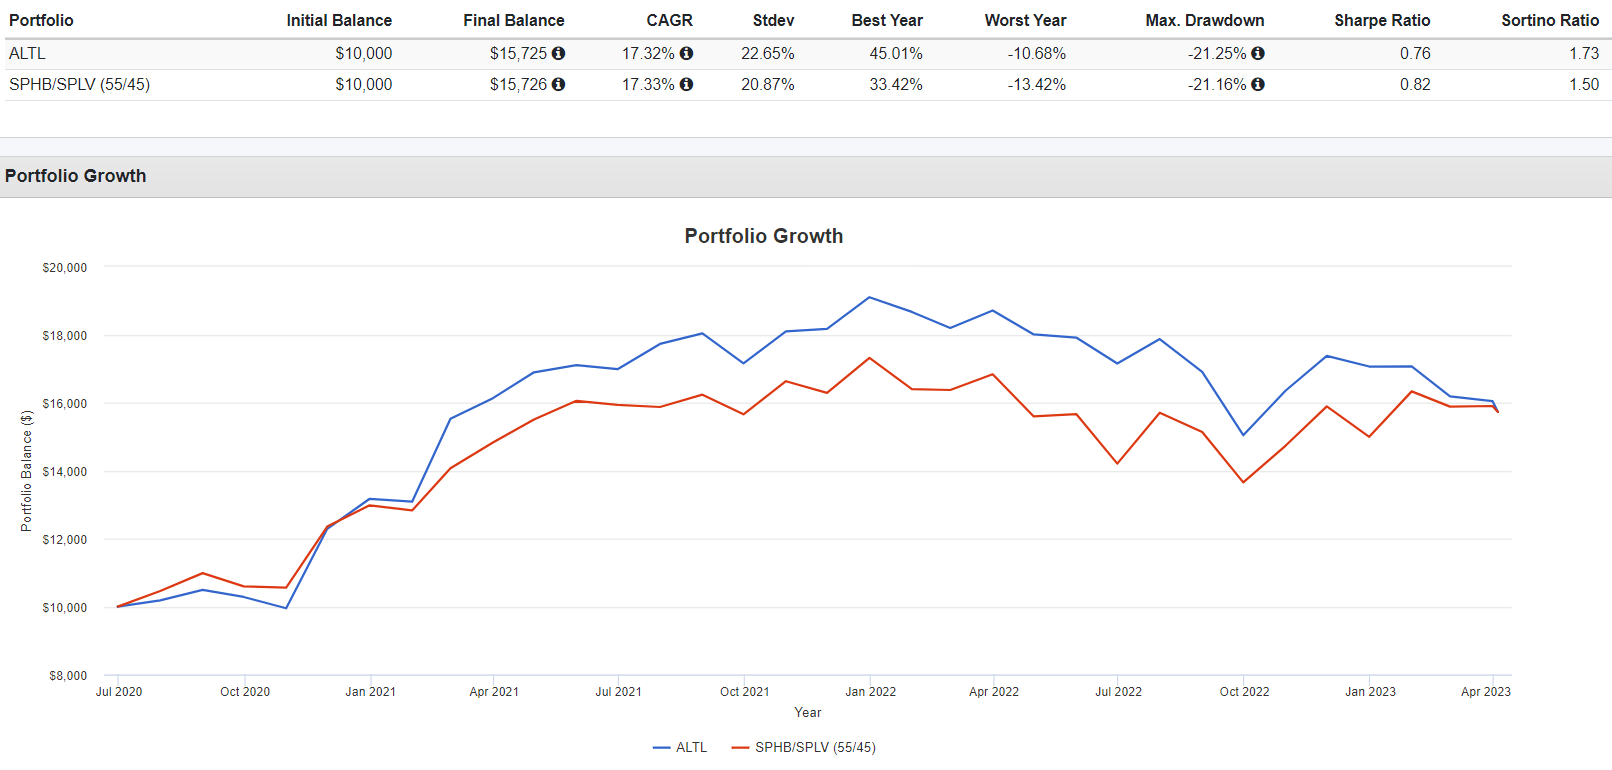
This article demonstrated how investors could replicate the results of ALTL by owning SPLV and SPHB in equal proportion and rebalancing when appropriate. They're also more likely to outperform ALTL in flat or declining markets. Those believing ALTL is worthy because it beat the market since June 2020 miss the importance of using risk-adjusted returns. ALTL selected the high-beta portfolio 55% of the time since its launch. Of course it will outperform SPY because that's what high-beta portfolios do in upward-trending markets. You could do the same by tilting your SPLV/SPHB mix 55/45, and you would have achieved the following:
Portfolio Visualizer
This approach earned an identical return with less volatility and much better risk-adjusted returns, which readers should consider if they're concerned about a market downturn. In summary, ALTL is a poorly thought-out product. I urge readers to refrain from paying high fees for a product that has yet to demonstrate any ability to select the right portfolio type consistently. Thank you for reading, and I look forward to the discussion below.
For further details see:
Pacer Lunt Large Cap Alternator ETF: This One's Easy, Don't Buy