PARR - Par Pacific Holdings: A 'Buy' For Growth-Focused Investors
2023-10-25 01:38:41 ET
Summary
- Par Pacific Holdings is well-positioned for growth with successful acquisitions, diversification into renewables, and a strong financial standing.
- The company operates across multiple business units and has ambitious growth objectives, supported by stock repurchasing and debt reduction.
- While there are risks related to market volatility and commodity prices, Par Pacific's diverse business model and risk management strategies provide a reasonable safeguard.
- The company's valuation implies a strong free cash flow yield.
Investment Thesis
Par Pacific Holdings ( PARR ) is a good stock for growth-focused, aggressive investors willing to engage with the energy sector's volatility. With successful acquisitions like Billings, diversification into renewables, and a robust financial standing characterized by strong liquidity and a focus on debt reduction, the company seems well-poised for both immediate and long-term growth. The financial metrics, including a LTM EBITDA margin of 11.2% and plans for stock repurchasing, further solidify the investment case. Thus, the recommendation would be to 'Buy' based on these analyses.
Overview
In Q2 2023, Par Pacific Holdings posted an adjusted EBITDA of $151 million and an adjusted net income of $1.73 per share. In addition, Par Pacific successfully closed the Billings acquisition on June 1 2023. The acquisition has already started to pay off by exceeding initial performance forecasts of 50,000 barrels per day of throughput. This successful acquisition helps Par Pacific on its growth trajectory, making it appealing to growth-focused investors.
The company operates across multiple business units, including refining, retail, and logistics. Further, it aims to improve reliability and profitability across all units. Par Pacific is actively working on renewable energy projects like the Hawaii distillate hydrotreater conversion. This strategic move is already showing signs of becoming a new revenue stream. This diversification becomes particularly important when you consider the volatile nature of the energy sector.
The energy sector has seen a tightening of global inventories, largely due to solid demand. This indicates improving market conditions that are likely to benefit Par Pacific. The company itself has acknowledged this, noting that market conditions, represented by "market cracks," have been improving throughout the first half of this quarter. This positive industry outlook, coupled with the company's strong performance, makes a compelling case for its future growth.
Par Pacific has ambitious growth objectives for the future. The company is repurchasing common stock worth of $250 million. This dual focus on growth and shareholder value is supported by the company's liquidity position, which stood at $464 million as of June 30. Moreover, the company has been strategically reducing its debt, further strengthening its financial profile.
Par Pacific has a record quarterly throughput of 142,000 barrels per day. This is a testament to the company's operational efficiency and places it ahead of industry averages. Throughput is a vital metric in the energy sector, often serving as a reliable indicator of both demand and operational efficiency, and Par Pacific is excelling in this regard.
Par Pacific operates in an industry subject to geopolitical tensions and market volatility. The company's multi-faceted business model, however, provides a certain degree of protection against sector-specific downturns. Par Pacific is proactive in managing commodity risks. They've employed hedging strategies, specifically mentioning product crack hedging in Hawaii, to offset volatility in commodity prices.
Moreover, the company has specific production costs—$4.33 per barrel in Hawaii and $8.30 per barrel in Wyoming—that investors should monitor. Any significant deviation in these numbers could indicate a change in operational efficiency and impact profit margins. Also, the company has expectations for the third quarter, including a throughput of approximately 200,000 barrels per day, or 92% utilization. While this is a strong indicator of demand and operational efficiency, it's important to note that a drastic change in commodity prices could affect these projections.
In summary, Par Pacific Holdings presents a compelling investment opportunity. Its strategic acquisition of Billings and diversification into renewables provide both immediate and future growth prospects. The company operates in a favorable industry environment and has ambitious but seemingly attainable growth objectives. It also has robust liquidity and is taking steps to further improve its financial standing. While there are inherent risks related to market volatility and commodity prices, the company's diverse business model and proactive risk management strategies provide a reasonable safeguard.
Financial Analysis
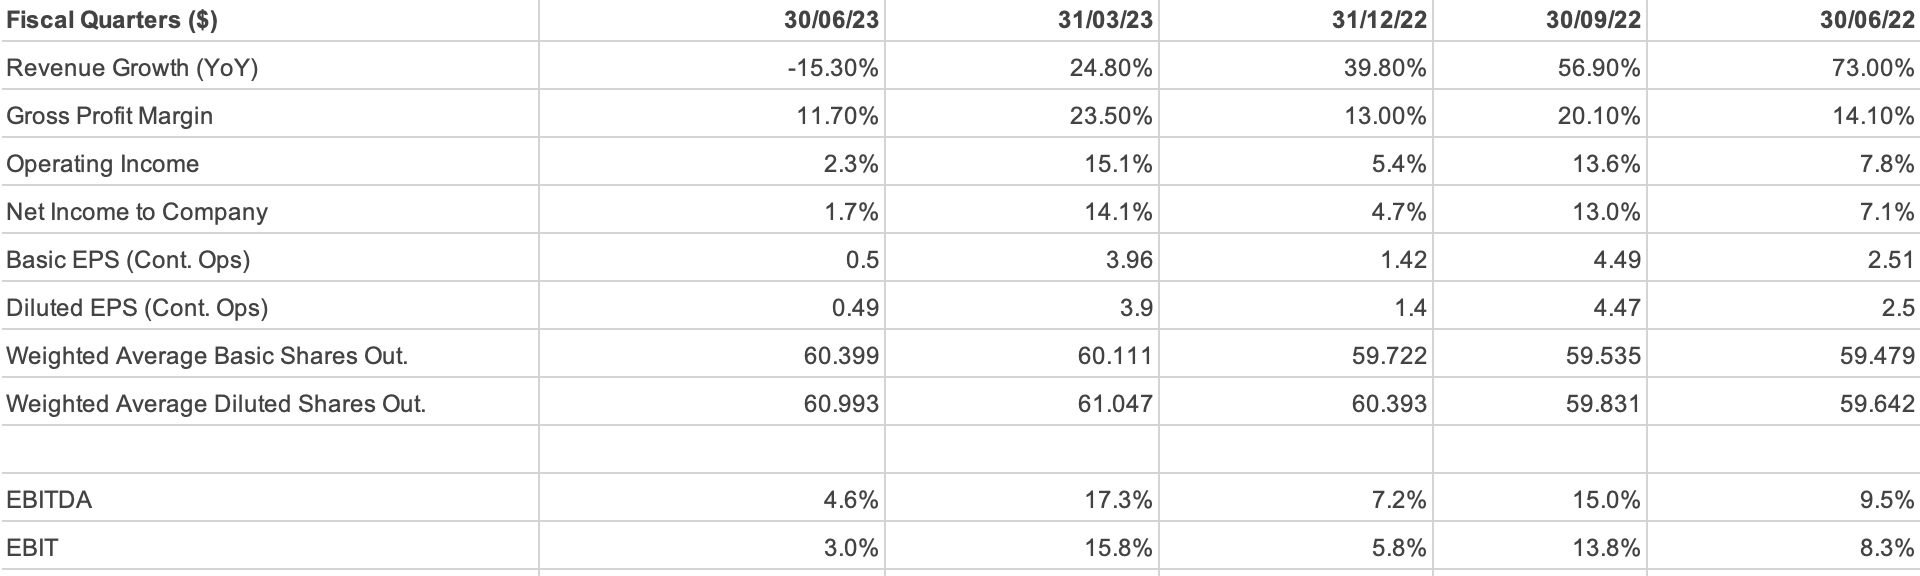
In Q2 2023, Par Pacific Holdings saw its revenues shrink by 15.3%, going down to $1,783.9 million from $2,106.3 million in the same quarter of the previous year. This could indicate a loss of market share. However, the revenues for the first half of 2023 were $3,469.1 million, a slight increase of 0.4% compared to $3,456.6 million in H1 2022, suggesting possible seasonality. The cost of revenues for Q2 2023 was $1,574.8 million, down by 12.9% from $1,808.9 million in Q2 2022. While reducing costs is generally good, this becomes a concern when revenue is also decreasing, as it questions the sustainability of profitability. In the same vein, operating expenses, not counting depreciation, increased by 25.9%, from $80.9 million in Q2 2022 to $101.8 million in Q2 2023. Depreciation and amortization expenses also grew by 10.3%, increasing from $25.6 million to $28.2 million. These rising expenses, in the face of declining revenue, have led to a dramatic fall in net income for Q2 2023, which plunged by 79.9% to $30 million from $149.1 million in Q2 2022. Yet, the net income for the first half of 2023 soared to $267.9 million, an increase of 2118.9% from a mere $12.1 million in H1 2022. This volatility in net income within the same fiscal year is a red flag, pointing to an unstable business environment and the presence of non-recurring items that boosted first-half income. The operating margin plummeted from 8.3% in Q2 2022 to 2.6% in Q2 2023, and the net profit margin declined from 7.1% to 1.7%.
The company operates multiple refineries in locations like Hawaii, Montana, Washington, and Wyoming, producing a variety of refined products such as gasoline, distillates, and fuel oils. This diversification is a strength, mitigating risks associated with market volatility in a particular product or region. On the performance side, the Total Refining Segment Feedstocks Throughput, a measure of operational activity, grew by 14.9% in Q2 2023 when compared to Q2 2022, and by 13.8% for the first half of the year compared to the same period last year. These numbers suggest that the company has expanded its production capabilities and is experiencing increased market demand.
While the Hawaii refinery's production costs per barrel fell from $4.50 to $4.33 in the same quarter, a contraction of 3.8%, and from $4.45 to $4.43 for the half-year, a marginal contraction of 0.4%, the Adjusted Gross Margin per barrel dropped significantly by 35.4%, from $18.71 to $12.08. This contraction in gross margins despite a decrease in production costs is a red flag. It suggests that even though the company is selling more and incurring slightly lower costs, the profitability per unit sold is declining.
The increased throughput and sales volumes suggest quality earnings and effective utilization of resources. However, the fluctuating gross margins and only marginally improved production costs indicate that the company hasn't fully optimized its operational efficiency. Looking forward, if the current rates of growth in throughput (14.9% YoY for Q2) and sales volume (17.7% YoY for Q2) hold, we could anticipate an increase in revenues. However, this growth must be coupled with improvements in gross margins and operational efficiencies to ensure that it translates to the bottom line.
On the risk side, the company needs to pay close attention to fluctuating gross margins and production costs, as these could be potential red flags indicating issues in pricing and cost control. Additionally, the downward trend in crude oil prices, with Brent crude dropping from $111.98/bbl in Q2 2022 to $77.73/bbl in Q2 2023, could impact the company's feedstock costs and overall profitability.
In summary, while Par Pacific Holdings shows promising growth in throughput and sales volume, indicating a positive performance in the refining segment, the volatility in its gross margins and marginal improvements in production costs warrant caution.
Balance Sheet Analysis
The company's cash and cash equivalents have decreased by 61.1%, plummeting from $490.9 million in December 2022 to $190.9 million in June 2023. This $300 million drop is a red flag, which the company used to fund the Billings acquisition. If this cash drain continues, the company will face severe liquidity challenges, undermining its operational and financial flexibility.
Simultaneously, there's a noticeable 16.2% increase in long-term debt, surging by $80.2 million to reach $574.8 million in June 2023, compared to the $494.6 million in December 2022. This upward trend in long-term debt indicates a shift towards debt financing, which, when paired with the dwindling cash reserves, could set the company on a risky financial trajectory. The debt-to-equity ratio stands at 0.62, suggesting a balanced capital structure as of now; however, the uptick in long-term debt needs to be carefully monitored to prevent the company from becoming overly leveraged, which would increase its financial risk.
The company's total assets grew by 10.06%, an increase of about $330 million, from $3.28 billion in December 2022 to $3.61 billion in June 2023. This could be indicative of business expansion and acquisitions. However, the current assets only saw a marginal 0.61% increase, going from $1.88 billion to nearly $1.89 billion.
The company's total liabilities increased by a modest 2.06%, translating to an approximate $50 million growth, moving from $2.64 billion to $2.69 billion. In isolation, this may not seem alarming, but when juxtaposed with the dropping cash reserves and increasing long-term debt, it should raise concerns. The current ratio, calculated using the current assets and liabilities, stands at 1.07, providing only a thin safety margin for meeting short-term obligations.
The net property, plant, and equipment assets spiked by 30.4%, an increase of $254.4 million, suggesting that the company is making significant capital expenditures likely aimed at future growth. However, this also flags concerns about the sustainability and quality of earnings, especially in the context of the dropping cash reserves.
In conclusion, while Par Pacific Holdings does show some signs of stability and an inclination for future investments, as indicated by a debt-to-equity ratio of 0.62 and capital expenditures to the tune of $254.4 million, the critical concerns of a $300 million reduction in cash cannot be ignored.
Free Cash Flow Analysis
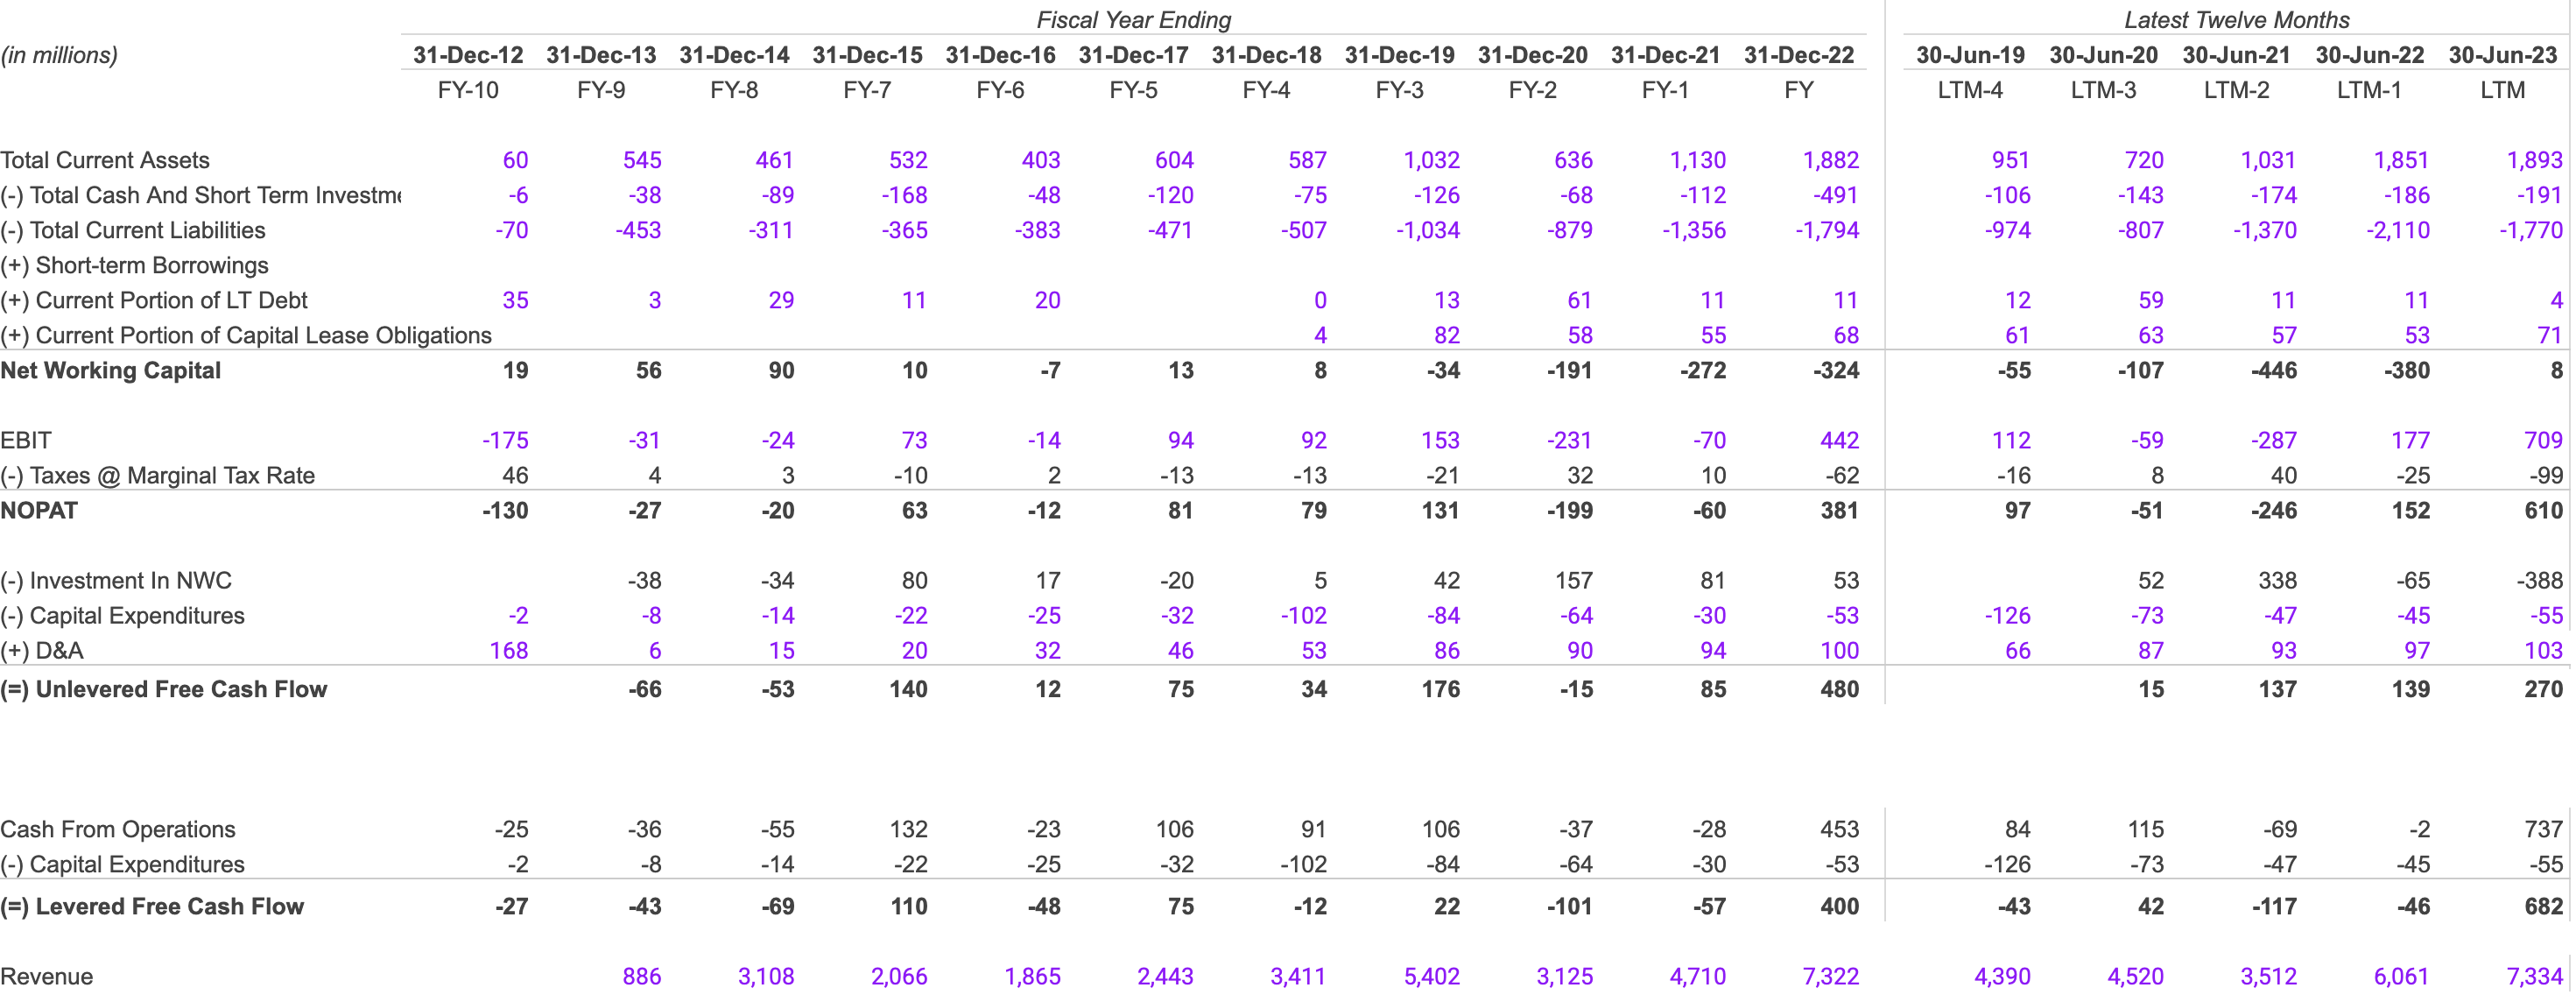
EBIT increased from a negative $287 million in 2021 to $709 million in 2023, marking a growth of 161.67% from 2021 to 2022 and 300.56% from 2022 to 2023. This uptick points to a significant operational turnaround, substantiated by a similar surge in Revenue, which escalated from $3512 million in 2021 to $7334 million in 2023. The growth rate for Revenue was 72.58% from 2021 to 2022 and 21% from 2022 to 2023. NOPAT also flipped from negative to positive, specifically from -$246 million in 2021 to $610 million in 2023, indicating a stabilization of profits. These numbers suggest a transformation in the core business, which also aligns with the industry trends where the company seems to be outperforming the market.
Unlevered Free Cash Flow increased from $137 million in 2021 to $270 million in 2023. Meanwhile, Total Current Assets grew by 79.53% from 2021 to 2022 but only increased by 2.27% from 2022 to 2023. The Liquidity and Solvency appear to be on firmer ground as Net Working Capital turned positive in 2023. Specifically, it moved from -$446 million in 2021 to a positive $8 million in 2023, indicating improved liquidity.
Total Current Liabilities contracted by 16.11% from 2022 to 2023, after increasing by -54.01% from 2021 to 2022. If EBIT sustains its growth trajectory, forecasts suggest it could touch around $1500 million by 2024. The same extends to Unlevered Free Cash Flows, which could potentially reach $400-450 million in 2024, and Levered Free Cash Flows, which might exceed $700 million in 2024, assuming effective debt management.
On the whole, the company has shown resilience and growth, especially in EBIT, Revenue, and NOPAT, making it a focus for both management and investors. However, the slowing growth in current assets could impact liquidity, which is why it's a key metric to watch moving forward. Therefore, the company appears to be on a stable financial footing with a promising future if the current trends continue.
Shareholder Yield
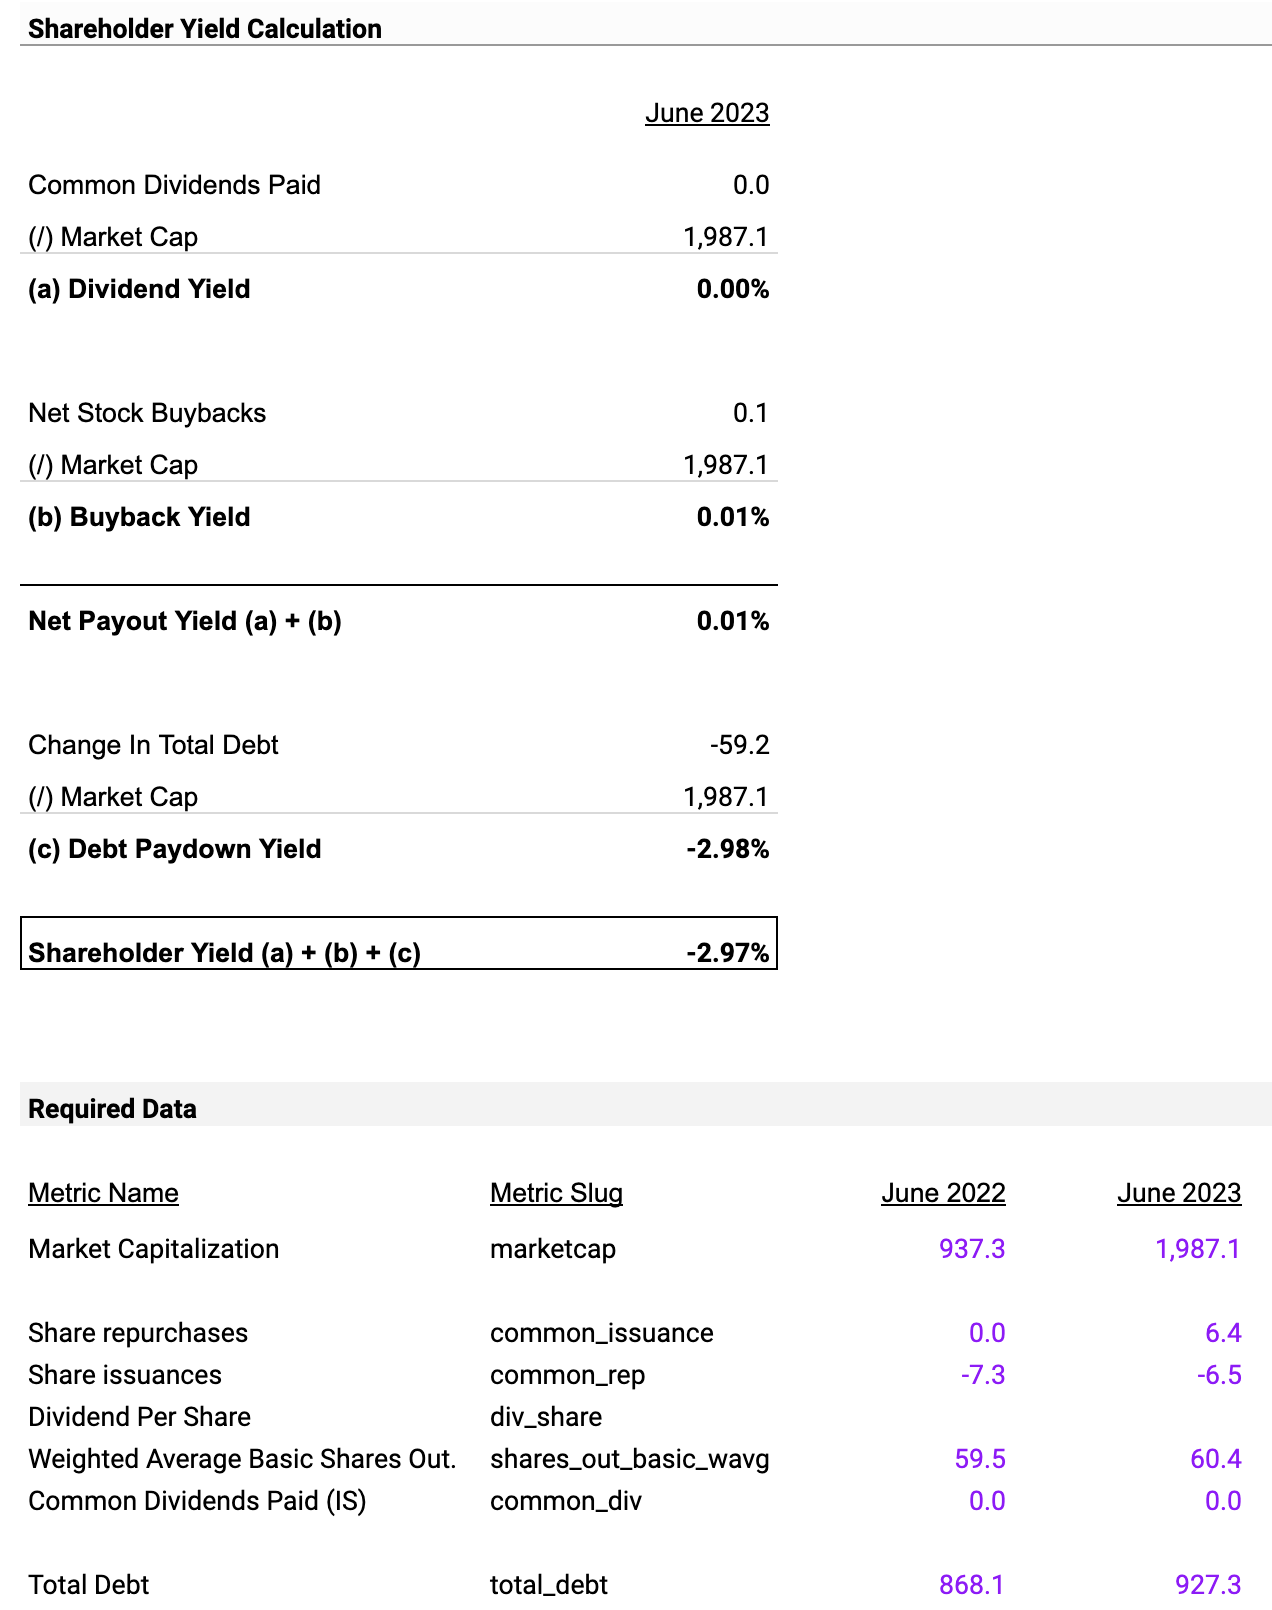
The dividend yield of 0.00% isn't a red flag but could indicate the company's strategy to reinvest earnings into avenues of growth. Similarly, the company's buyback yield is 0.01%, signaling that repurchasing shares isn't a current focus. When summed up, these figures produce a net payout yield of 0.01%, confirming that the company's primary objective isn't to return capital to shareholders at this point. Instead, the focus seems to be on debt reduction. With a debt paydown of -$59.2 million against a market capitalization of $1,987.1 million, the debt paydown yield comes out to -2.98%. This indicates the company's commitment to reduce leverage and improve its balance sheet. When we combine this with the net payout yield, the overall shareholder yield is -2.97%, which appears to be negative primarily because the company is directing resources towards reducing debt rather than rewarding shareholders with dividends or buybacks.
The lack of dividends and the minuscule buyback yield might raise concerns regarding the company's capital allocation strategy. However, if the trend in debt paydown continues, the balance sheet will likely improve further, and this becomes the primary value driver to watch. Thus, the primary financial risk here seems to be the low shareholder yield, which could turn away investors looking for returns via dividends or buybacks.
As for forward-looking analysis, the debt reduction of -$59.2 million suggests that the company could reduce its debt by another similar amount in 2024, thus further strengthening its balance sheet. While the company has not initiated any dividends or significant buybacks as of 2023, the debt reduction could be a precursor to such shareholder-friendly actions in the future.
In summary, the company is focusing on improving its financial health by reducing debt. Although this strategy may not offer immediate returns to shareholders through dividends or buybacks, it sets the stage for a stronger, more resilient business in the long run, making it a potential buy for long-term balance sheet improvement.
Earnings Preview For September Quarter
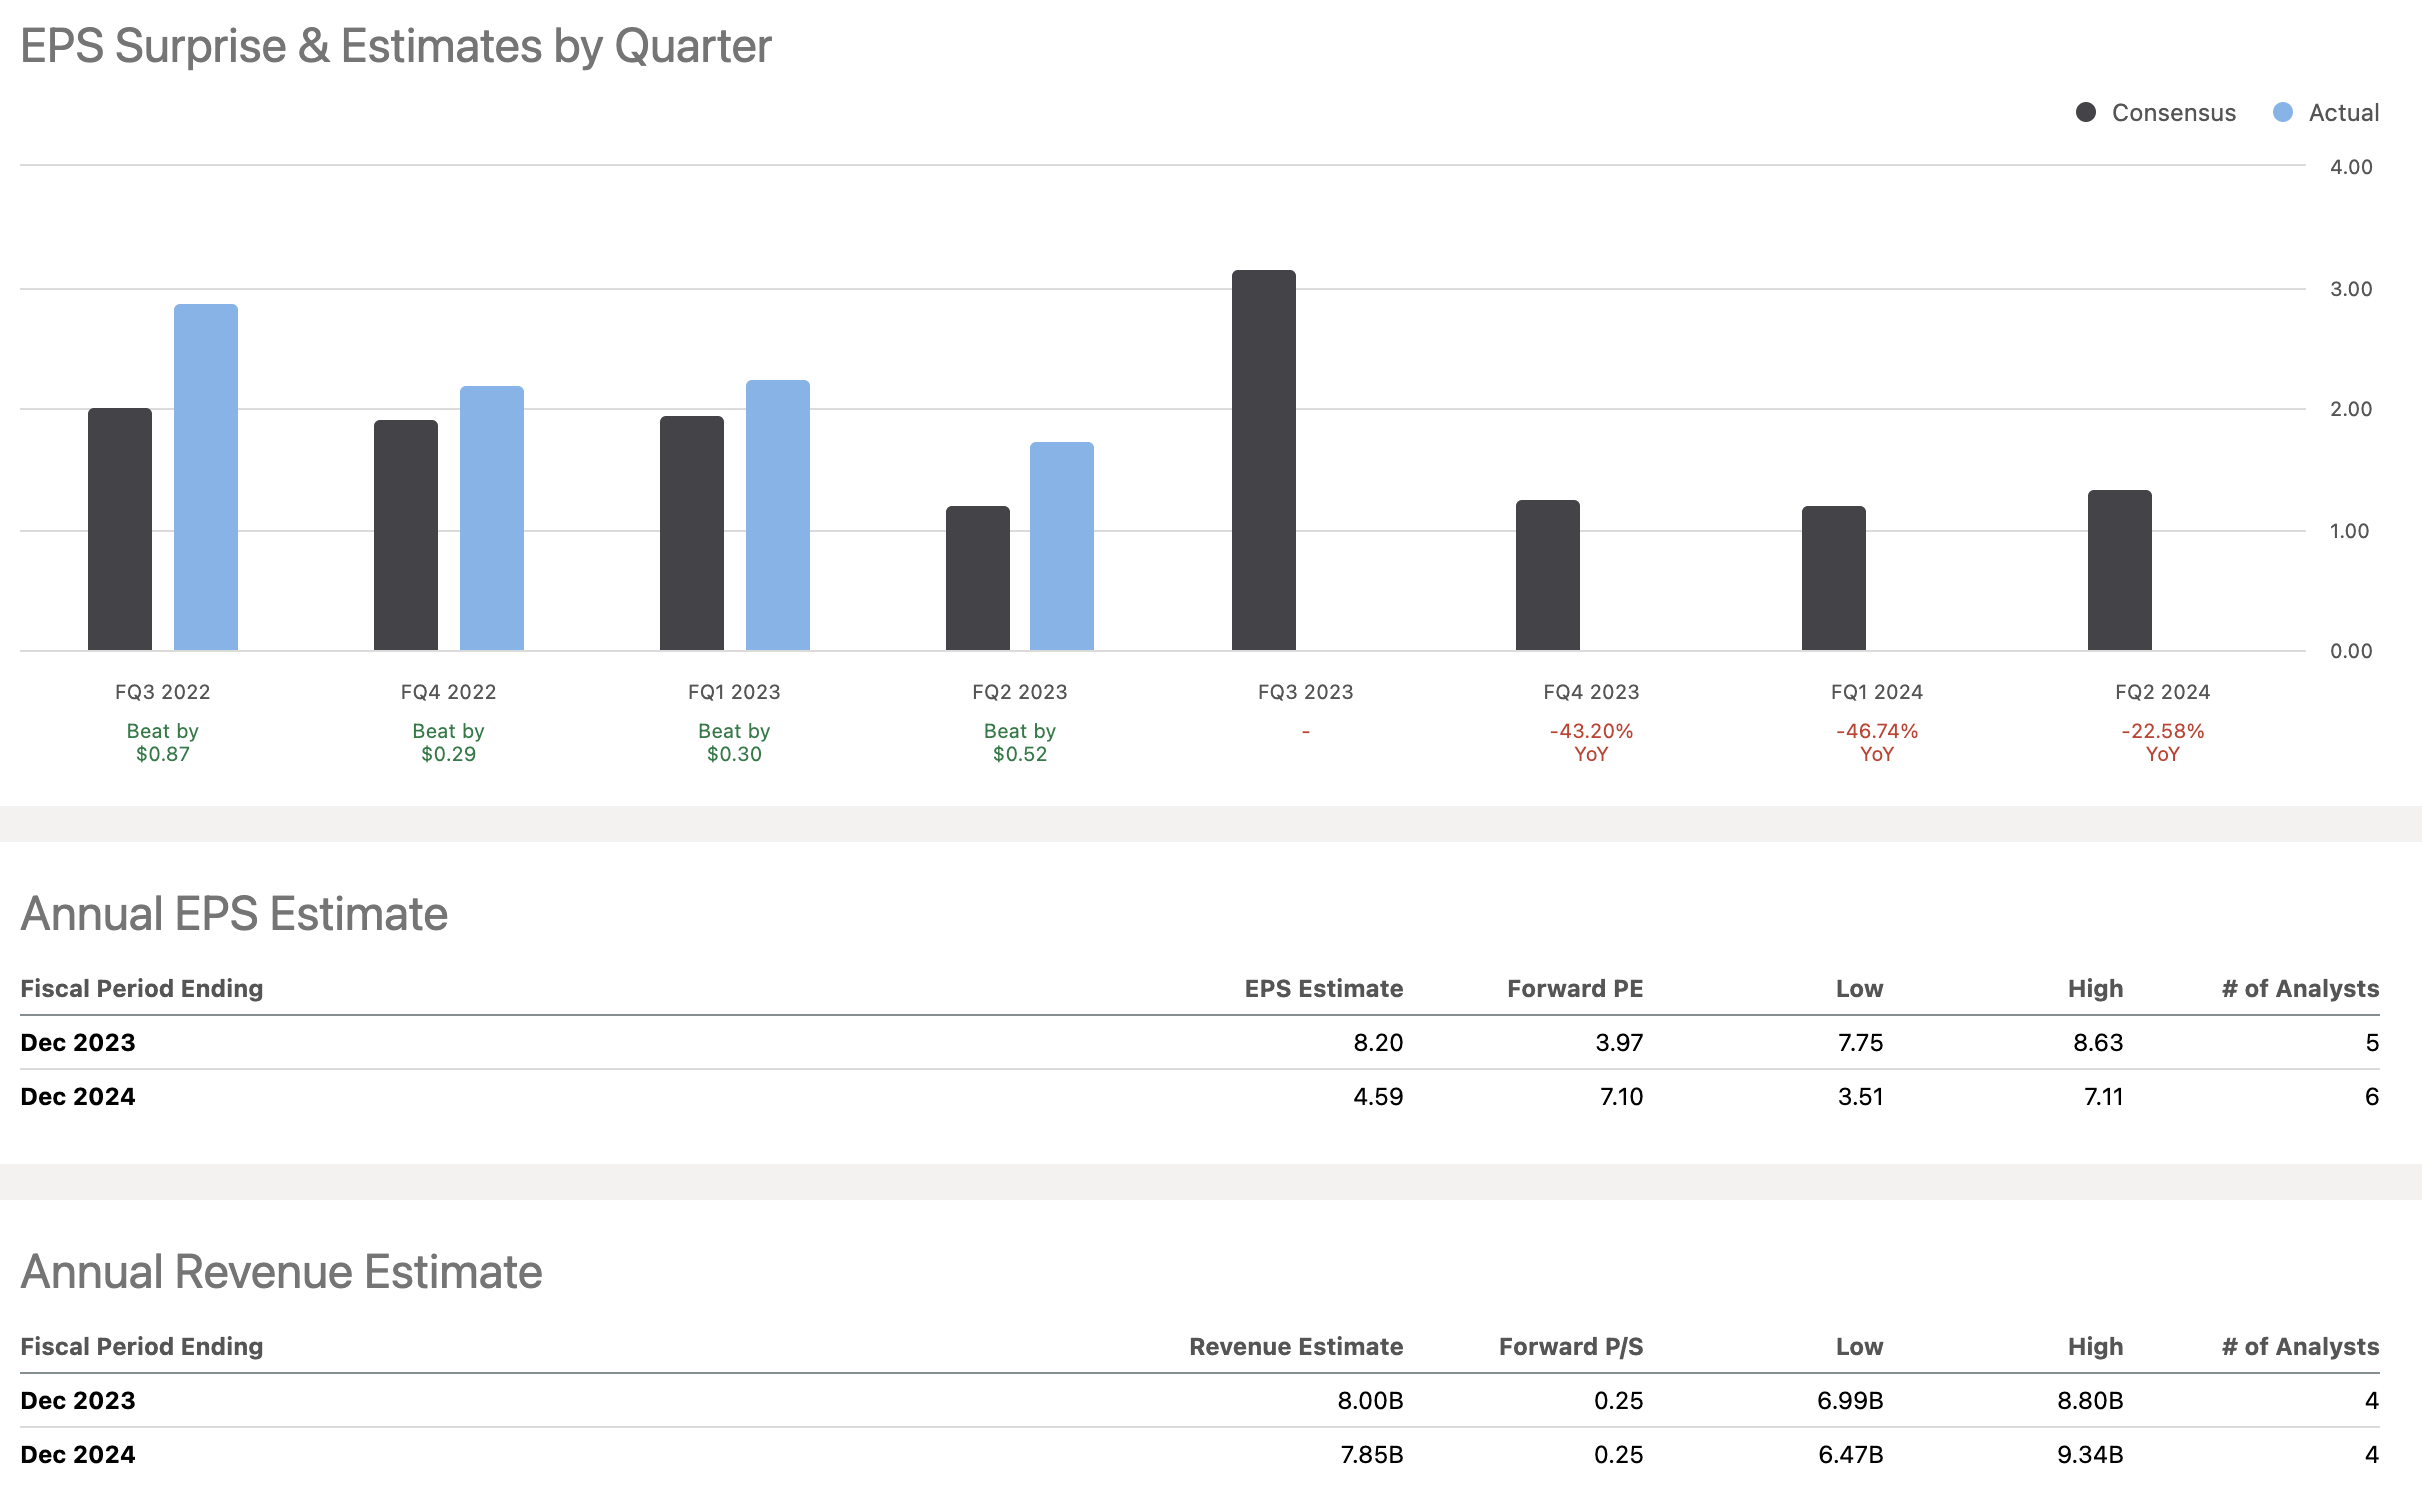
The average revenue forecast also shows a promising increase from $1,611.569 million in June to $2,256.953 million in September, marking an increase of about $645.384 million or a 40.02% rise. The high-end forecast moves from $2,019.26 million in June to $2,533.26 million in September, which constitutes an approximate increase of 514 million or 25.45%.
The median EPS also sees a significant rise from 1.21 in June to 3.17 in September, an increase of 1.96 or a 162.02% jump. This positive trend extends to the average EPS forecast, which also rises from 1.21 in June to 3.15 in September, an increase of 1.94 or 160.33%.
The revenue is expected to grow by an average of 40.02%, and EPS figures suggest a minimum increase of 137% and a maximum of 172.73%. Therefore, from June to September 2023, the financial metrics strongly hint at an improved future for the company in both revenue and earnings per share.
Valuation
In assessing Par Pacific Holdings through the lens of the EV/EBITDA multiple, it's essential to first look at the benchmark companies chosen for comparison.
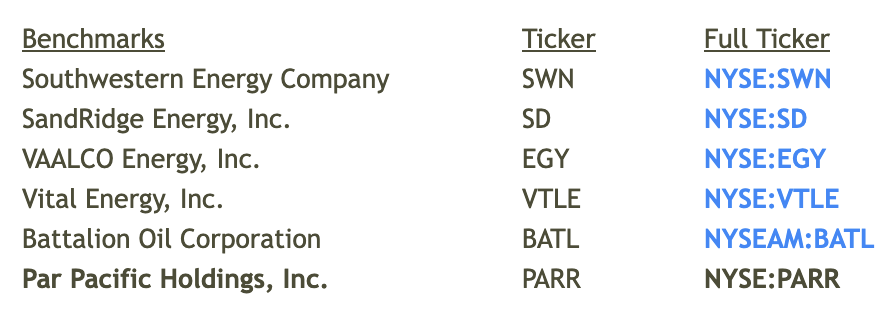
These benchmarks include Southwestern Energy Company (SWN), SandRidge Energy, Inc. (SD), VAALCO Energy, Inc. (EGY), Vital Energy, Inc. (VTLE), and Battalion Oil Corporation (BATL). These companies were selected because they operate in similar sectors and exhibit a range of EBITDA growth and margin metrics, thereby providing a well-rounded comparative set.
Select LTM EBITDA Multiple
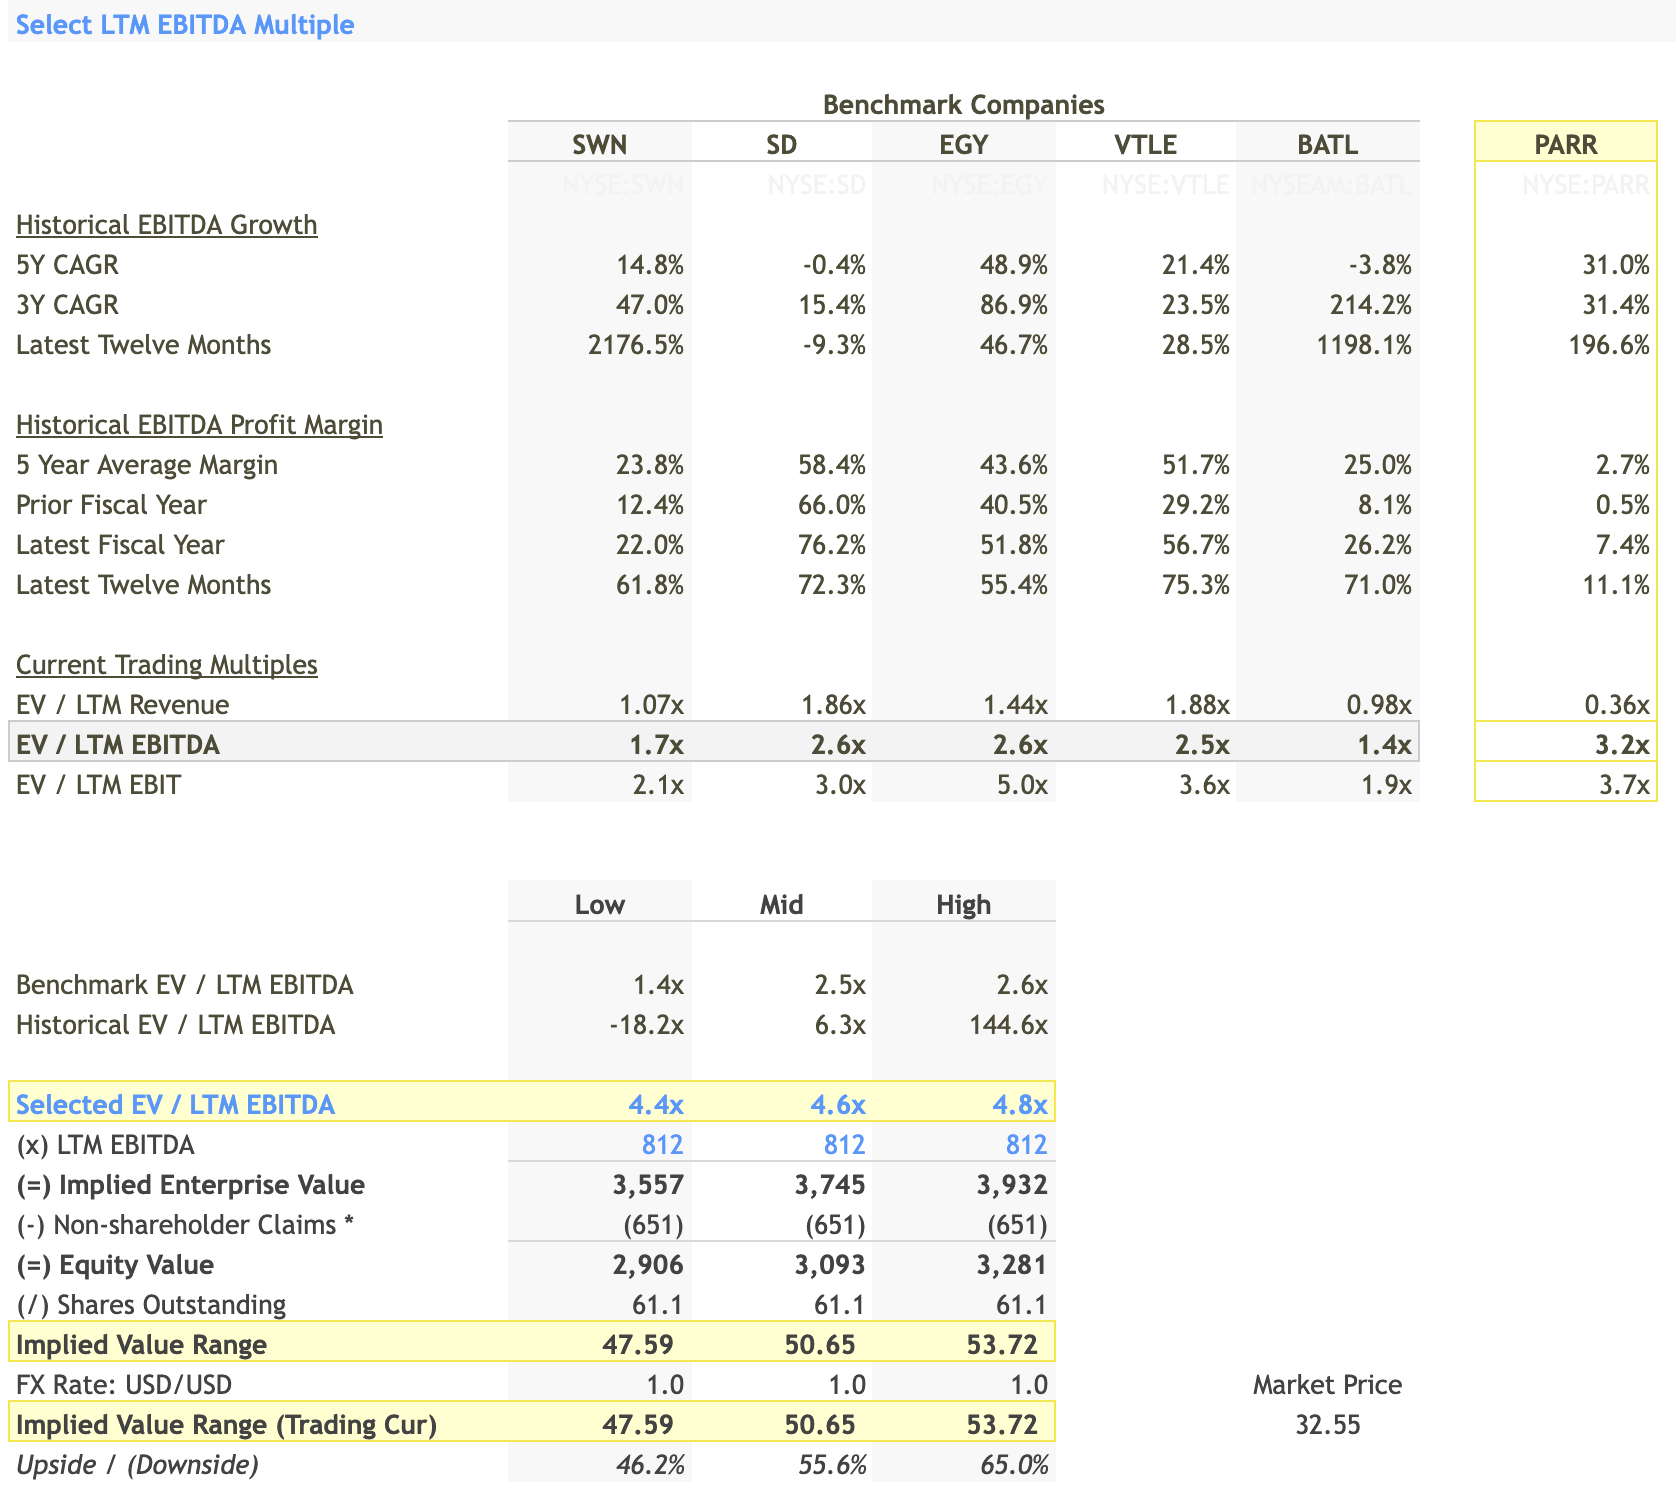
When it comes to Last Twelve Months (LTM) EBITDA, Par Pacific Holdings shows a growth rate of 196.6%, higher than most benchmarks except for Battalion Oil Corporation at 1198.1%. The EV/LTM EBITDA multiple for Par Pacific is 3.2x, which is higher than the benchmark low of 1.4x. Given Par Pacific's strong historical EBITDA growth, especially a 3Y CAGR of 31.4%, a selected EV/LTM EBITDA multiple of 4.6x is reasonable. This leads to an implied enterprise value of $3,745 million, and after adjusting for non-shareholder claims, an equity value of $3,093 million. With 61.1 million shares outstanding, this implies a stock price range of $50.65, well above the current market price of $32.55.
Select Projected EBITDA Multiple
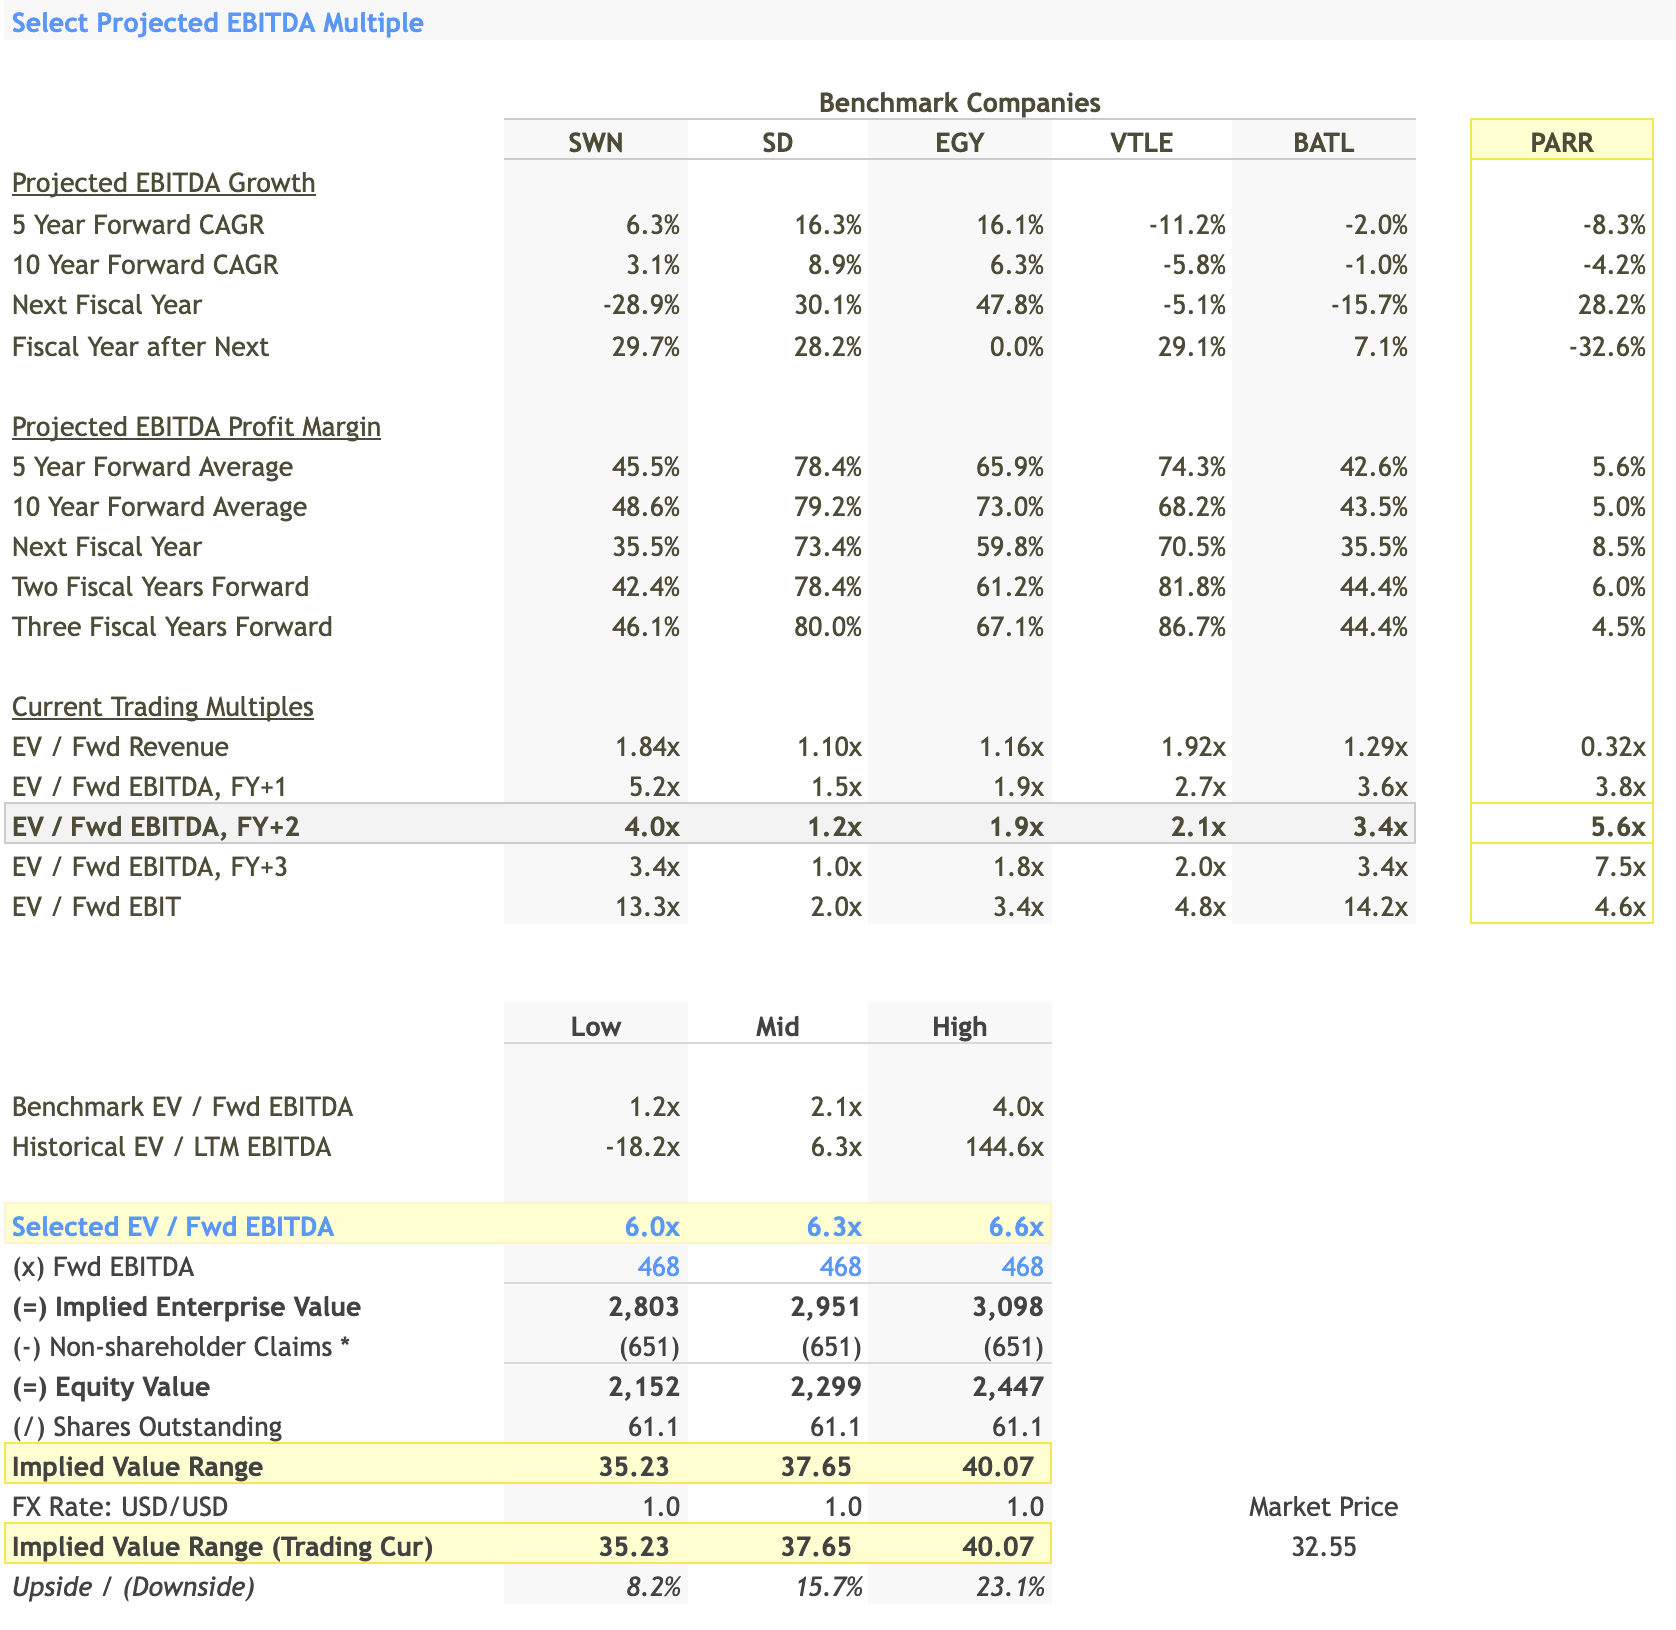
The selected forward EBITDA multiples for Par Pacific range from 6.0x to 6.6x. These multiples are applied to the forward EBITDA projection of $468 million. The multiples are higher than the industry benchmark range, which goes from 1.2x to 4.0x. The choice of a higher forward EBITDA multiple is indicative of high expectations for the company's future performance and the increase in commodity prices due to geopolitical tensions in the Middle East.
Using a 6.0x to 6.6x multiple on a forward EBITDA of $468 million results in an implied enterprise value range of $2,803 million to $3,098 million. After accounting for non-shareholder claims of $651 million, the equity value ranges from $2,152 million to $2,447 million. When this equity value is divided by the outstanding shares (61.1 million), the implied stock price is between $35.23 and $40.07. The current market price stands at $32.55, and thus the upside ranges from 8.2% to 23.1%.
In summary, the selected projected EBITDA multiples suggest that Par Pacific is expected to perform well in the near term, which is backed by a projected EBITDA growth of 28.2% for the next fiscal year.
Fair Value Range and Conclusion
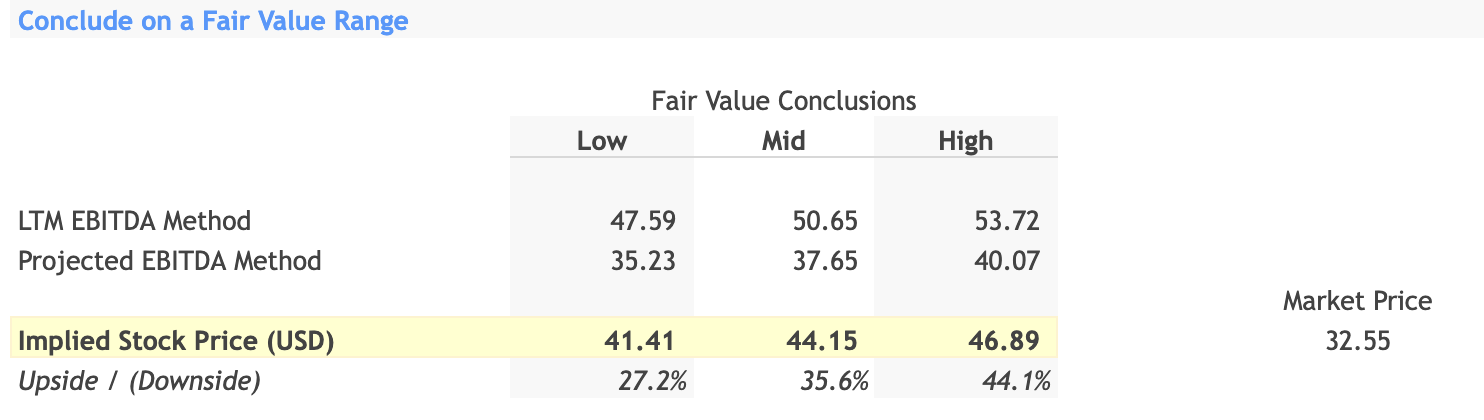
The LTM EBITDA method suggests an implied stock price range of $47.59 to $53.72, whereas the projected EBITDA method suggests a more conservative range of $35.23 to $40.07. Averaging these methods gives a fair value stock price range of $41.41 to $46.89, representing an upside of 27.2% to 44.1% from the current market price of $32.55.
Investment Decision
Based on a detailed valuation of Par Pacific Holdings using both Last Twelve Months (LTM) and projected EBITDA multiples, there's a compelling argument for a "Buy" investment decision. The company's historical performance is robust, with an impressive LTM EBITDA growth of 196.6% and a strong 3-year EBITDA CAGR of 31.4%. This solid track record justifies a higher EV/LTM EBITDA multiple, leading to an implied stock price range between $47.59 and $53.72, which outstrips the current market price of $32.55.
Moreover, both valuation methods—LTM EBITDA and projected EBITDA—suggest the stock is currently undervalued, indicating an average fair value ranging from $41.41 to $46.89. This range is significantly higher than the present trading price, offering potential upside gains.
The company is also expected to grow its EBITDA by 28.2% in the next fiscal year, which could act as a catalyst for stock price appreciation. Additionally, Par Pacific has improved its EBITDA margins to 11.1% in the latest twelve months, up from a 5-year average of 2.7%. This upward trend in margins could potentially lead to increased profitability and a subsequent rise in stock price. Furthermore, if the company maintains its trajectory of EBITDA growth and margin improvement, it may leverage increased cash flows for debt reduction or growth initiatives, each of which could serve as a catalyst for future stock price growth.
Further, the energy sector is on the upswing, which could positively impact Par Pacific. Lastly, the selected forward EV/EBITDA multiple of 6.3x is higher than the industry average but is justifiable given the company's growth prospects and improving margin profile.
In summary, Par Pacific Holdings appears to be an undervalued investment with significant upside potential, thereby strongly supporting a "Buy" decision.
For further details see:
Par Pacific Holdings: A 'Buy' For Growth-Focused Investors