VNQ - Paramount Group: Pull The Plug
2023-11-16 09:00:00 ET
Summary
- Office REITs have been heavily impacted by the work-from-home trend, resulting in a YTD loss of over 20%.
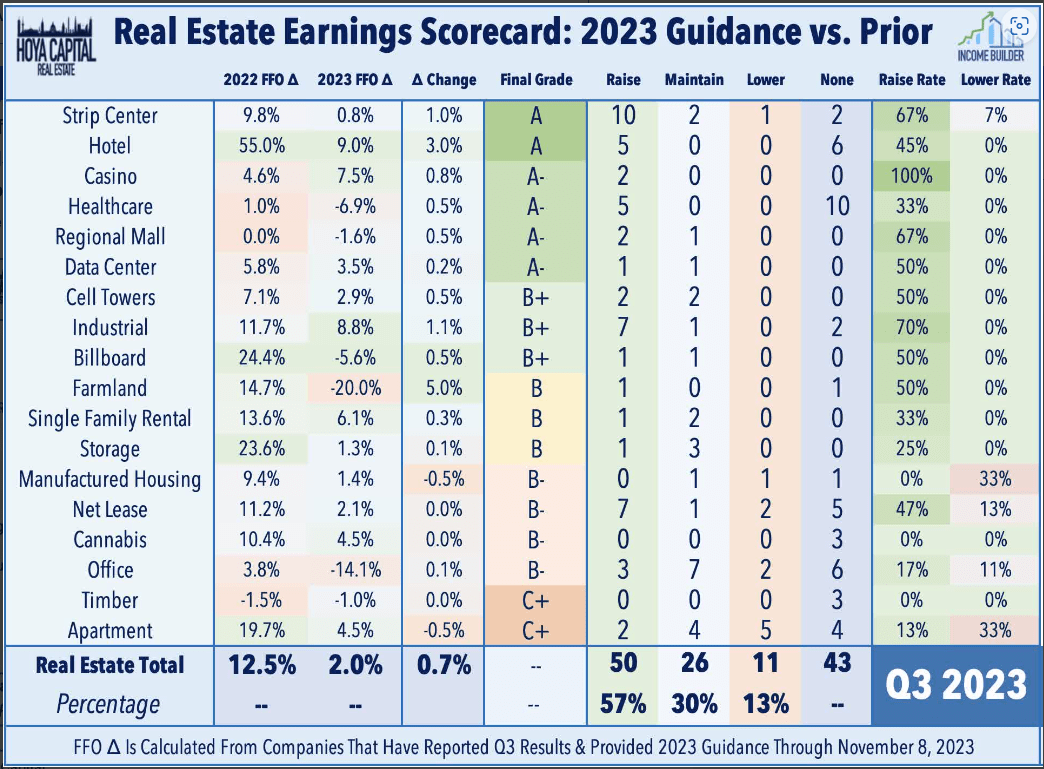
- Office REITs had the third-worst performance of any REIT sector in Q3 earnings season, with a 14% decline in FFO from a year ago.
- Major markets with long commute times, such as San Francisco and New York City, are experiencing ongoing softness in demand for office space.
- Paramount Group specializes in office properties in San Francisco and New York City.
- The company is faced with soft demand, falling revenue, and heavy debt.
The drumbeat of bad news continues for Office REITs. Seriously upwinded by the WHF (Work From Home) trend, Office REITs on the whole have lost more than (-20)% YTD, while all the major indices, except the S&P 600 (Small-Cap), have posted returns in positive territory, led by the NASDAQ, at better than 40%.
Hoya Capital Income Builder
Although there were some bright spots, Office REITs displayed the third-from-worst performance of Q3 earnings season, with only Timber and Apartment REITs doing worse. Although 3 of the 18 companies in this sector raised guidance, and only two lowered, Office REITs as a whole averaged a (-14)% decline in FFO from a year ago.
Although I and other commentators are expecting a turnaround in REITs , Office REITs may be the exception. Although Hoya Capital Income Builder has recently called a bottom for this sector, they acknowledge that the fundamentals are still far from ideal.
Several major markets (SF, NYC, CHI, DC) have an unavoidable structural issue: it takes too long to get to work - largely a byproduct of decades of bad housing policy and urban planning.
Since WFH demands by skilled workers are largely a function of commute time, this spells ongoing softness in demand for office space in San Francisco, New York City, Chicago, and Washington, DC.
Hoya Capital Income Builder
The oversupply is being addressed, as office removals have outpaced groundbreakings YTD, and there is a sharp uptick in conversions of office space to different uses.
Sunbelt office leasing is currently running very near pre-pandemic levels, but leasing in coastal markets is languishing around 75% of 2019 volume.
As a result, there are potentially good buys on a small, select group of Sunbelt-focused REITs, which are well-positioned in markets with net population growth, shorter commute times, and a more favorable industry mix for the WFH era.
This article focuses on a small-cap Office REIT with subpar dividend yield and formidable debt problems, operating in two major coastal markets with long commute times.
Meet the company
Paramount Group, Inc.
Founded in 1978 and headquartered in New York City, Paramount Group, Inc. ( PGRE ) owns and operates 13.0 msf (million square feet) of Class A office properties worth about $8.5 billion, in New York City (8.7 msf) and San Francisco (4.3 msf). The company also manages four properties aggregating an additional 0.8 msf. As of September 30, the portfolio was 88.1% leased, with an average lease term of 6.4 years, although notably, just 3.8 years for the San Francisco portfolio.
Rents for PGRE properties tend to be rather high, owing to their location in business districts of large markets, and tenants therefore tend to be large, well-known and stable companies. Tenant diversification is decent, although the top 4 tenants each account for more than 4% of ABR (annual base rent).
Paramount Group investor presentation
Likewise, tenants are heavily concentrated in four industries, which combine to account for over three-fourths of Paramount's ABR:
- legal services (24.2%),
- technology and media (20.0%),
- banking (17.0%), and
- other financial services (16.3)%
Paramount Group investor presentation
In each of the next three years, expiring leases will exceed 10% of square footage. Operating in markets where WFH is particularly advantageous, leasing this amount of square footage on expiration could be a major problem for PGRE.
Paramount Group investor presentation
Quarterly Results
Paramount just reported a very disappointing quarter. Paced by a huge (-36.3)% drop in FFO compared to Q3 2022, and a 17.4% increase in General and Administrative expenses, absolutely everything went in the wrong direction. About the only good thing you can say about these numbers is that the (-12.5)% decline in FFO/share wasn't as bad as the declines earlier this year. Some of this is connected to a regional bank crisis that led to some unexpected lease terminations this year.
| Q3 |
| Q3 |
| YTD |
| YTD |
| Metric |
| 2023 |
| 2022 |
| % Change |
| 2023 |
| 2022 |
| % Change |
| FFO (millions) |
| $44.1 |
| $69.2 |
| (-36.3) |
| $134.8 |
| $212.5 |
| (-36.6) |
| Core FFO |
| $68.4 |
| $71.6 |
| (-4.5) |
| $206.8 |
| $216.5 |
| (-4.5) |
| FFO/Share |
| $0.21 |
| $0.24 |
| (-12.5) |
| $0.63 |
| $0.73 |
| (-13.7) |
| NOI (millions) |
| $118.3 |
| $120.7 |
| (-2.0) |
| $349.7 |
| $360.3 |
| (-3.0) |
| G&A |
| $15.5 |
| $13.2 |
| +17.4 |
| $46.3 |
| $45.5 |
| +1.7 |
| Interest Expense |
| $39.1 |
| $36.9 |
| +6.0 |
| $112.4 |
| $106.8 |
| +5.2 |
| Same Store NOI |
| $90.0 |
| $96.9 |
| (-7.1) |
| -- |
| -- |
| -- |
President and CEO Albert Behler had this to say on the Q3 earnings call :
We have built the company to withstand economic downturns and this time will be no different. We have a fortress balance sheet with ample liquidity and debt that is non-recourse by design. Our portfolio continues to be leased well above market levels [due] to a roster of blue-chip tenants and we continue to capture more than our fair share of leasing in our markets, as demonstrated by our leasing results.
Does the company have a fortress balance sheet? See below.
Growth metrics
Here are PGRE's 3-year growth figures for FFO (funds from operations), and TCFO (total cash from operations).
| Metric |
| 2020 |
| 2021 |
| 2022 |
| 2023 * |
| 3-year CAGR |
| FFO (millions) |
| $215 |
| $193 |
| $210 |
| $180 |
| -- |
| FFO Growth % |
| -- |
| (-10.2) |
| 8.8 |
| (-14.3) |
| (-5.8)% |
| FFO per share |
| $0.96 |
| $0.88 |
| $0.98 |
| $0.86 |
| -- |
| FFO per share growth % |
| -- |
| (-8.3) |
| 11.4 |
| (-12.2) |
| (-3.6)% |
| TCFO (millions) |
| $237 |
| $244 |
| $247 |
| $206 |
| -- |
| TCFO Growth % |
| -- |
| (-16.8) |
| 2.9 |
| (-15.6) |
| (-4.6)% |
* estimated, based on consensus estimates and prior quarters
Source: Hoya Capital Income Builder, Schwab.com, Seeking Alpha Premium, and author calculations
Meanwhile, here is how the stock price has done over the past 3 twelve-month periods, compared to the REIT average as represented by the Vanguard Real Estate ETF ( VNQ ).
| Metric |
| 2020 |
| 2021 |
| 2022 |
| 2023 |
| 3-yr CAGR |
| PGRE share price Nov. 13 |
| $7.81 |
| $9.42 |
| $6.79 |
| $4.27 |
| -- |
| PGRE share price Gain % |
| -- |
| 20.6 |
| (-27.9) |
| (-37.1) |
| (-18.2)% |
| VNQ share price Nov. 13 |
| $85.38 |
| $109.67 |
| $86.99 |
| $74.96 |
| -- |
| VNQ share price Gain % |
| -- |
| 28.4 |
| (-20.7) |
| (-13.8) |
| (-4.3)% |
Source: MarketWatch.com and author calculations
In each of the past three 12-month periods, PGRE shares have underperformed VNQ shares on price alone, returning an average annual loss of (-18.2)%, compared to the VNQ's (-4.3)%.
Worse yet, for the past 10 years, PGRE's stock price has trended relentlessly downward, and is still seeking a bottom, as the line chart below indicates.
It isn't just the pandemic, or the WFH trend, that is affecting PGRE shares. Maybe it's time to admit this is a failed business model?
Balance sheet metrics
Here are the key balance sheet metrics. PGRE maintains a sturdy Assets/Liabilities ratio of 2.09, well above the Office REIT average, but its debt ratio of 69% and Debt/EBITDA of 8.8x are cause for concern. Not what I would call a fortress.
| Company |
| Liquidity Ratio |
| Debt Ratio |
| Debt/EBITDA |
| Bond Rating |
| PGRE |
| 2.09 |
| 69% |
| 8.8 |
| -- |
Source: Hoya Capital Income Builder, TD Ameritrade, and author calculations
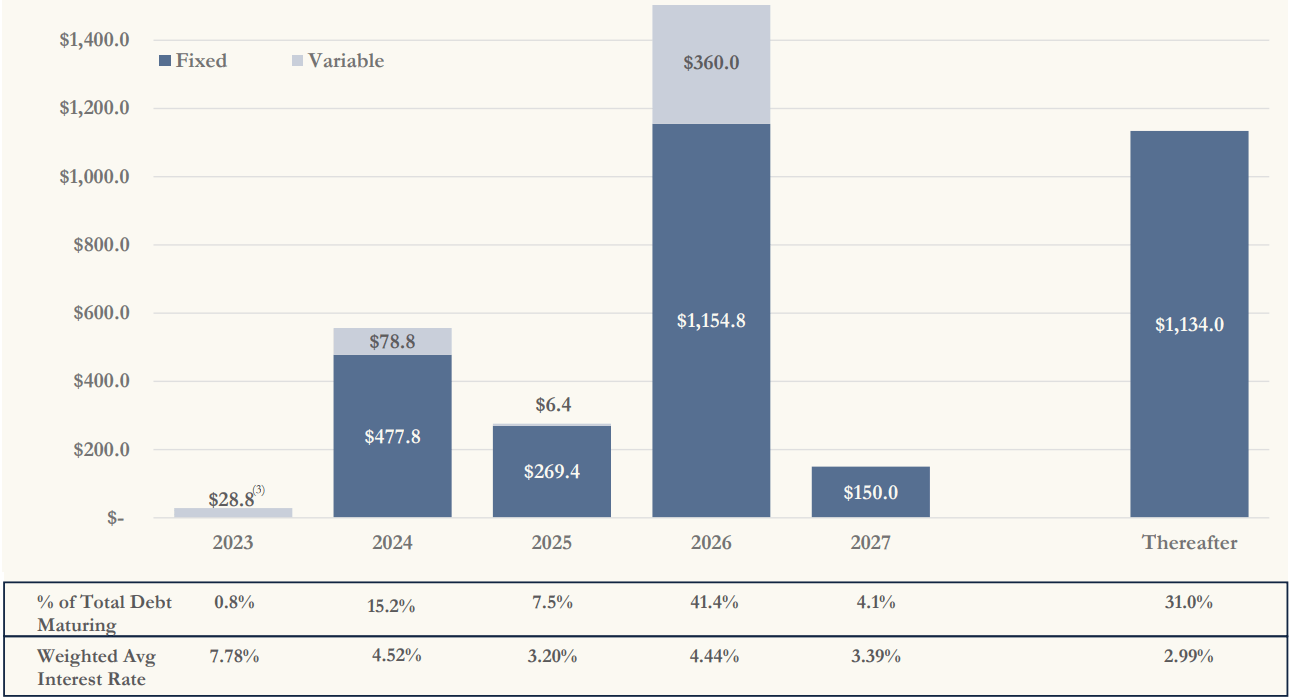
As of September 30, PGRE was holding $467 million in cash, and had $750 million of unused revolver capacity, over against long-term debts totaling $3.8 billion. All of its debt is secured, with a weighted average interest rate of 3.90%. Unfortunately, 13% of the debt is held at floating interest rates, currently at 8.01%, which helps account for the increase in interest expense in the quarterly returns.
Paramount Group investor presentation
Although the company characterizes its debt maturity schedule as "well-laddered," a formidable 15.2% of their debt is due next year, and a staggering 41.4% comes due in 2026. That's the poorest laddering I have ever seen, personally.
Paramount Group investor presentation
Dividend metrics
PGRE slashed its dividend by more than half after Q1 of this year. The dividend is now considerably lower than it was during the pandemic. In a sector where the average yield is well above the prime rate, PGRE stands out as a very poor dividend payer. The low payout ratio of 21% (FFO Fwd) results in a much-too-safe grade of A from Seeking Alpha Premium.
| Company |
| Div. Yield |
| 5-yr Div. Growth |
| Div. Score |
| Payout |
| Div. Safety |
| PGRE |
| 3.28% |
| (-18.9)% |
| 1.75 |
| 21% |
| A |
Source: Hoya Capital Income Builder, TD Ameritrade, Seeking Alpha Premium
Dividend Score projects the Yield three years from now, on shares bought today, assuming the Dividend Growth rate remains unchanged.
Valuation metrics
PGRE sells for a microscopic 5.0x FFO '23, and a whopping 42.3% discount to NAV. This does not make it a bargain. It's cheap for a reason.
| Company |
| Div. Score |
| Price/FFO '23 |
| Premium to NAV |
| PGRE |
| 1.75 |
| 5.0 |
| (-42.3)% |
Source: Hoya Capital Income Builder, TD Ameritrade, and author calculations
What could go wrong?
PGRE faces three consecutive years in which more than 10% of their square footage will be in expiring leases. Given the long commute times in San Francisco and New York City, the company might not be able to lease space as it expires over the next 3 years, resulting in further erosion of revenues.
PGRE's balance sheet shows a relatively high exposure to floating-rate debt, which exposes the company to further increases in interest expense if the Fed should choose to raise rates again, further eroding FFO.
Management characterizes its balance sheet as a "fortress" and its debt maturity schedule as "well-laddered." A simple look at the facts, however, reveals another story. The reader may draw his or her own conclusions as to the implications of this state of affairs.
Investor's bottom line
Mounting debts and falling revenues, and a product that is out of favor in its chosen markets, all add up to a poor investment option, especially when accompanied by a sub-par dividend profile. I rate PGRE a Sell. There are excellent opportunities coming down the pike in REIT investing. This company is not one of them.
Seeking Alpha Premium
Zacks rates PGRE a Hold, as does the Seeking Alpha Quant Ratings system, and 4 of the 7 Wall Street analysts covering the firm (also 2 strong sells and 1 strong buy). The average price target is $4.40, implying just 3% upside, to go with the 3.28% yield. The Street rates PGRE a Sell.
As always, however, the opinion that matters most is yours.
For further details see:
Paramount Group: Pull The Plug