QQQ - Passive Perspectives: Fourth Quarter 2022
Summary
- Market volatility rewarded diversified indices in 2022.
- The case for Stratified Weight in 2023.
- Leading Themes: Infrastructure, Defensives and Inflation.
- Laggard Theme: “Advertising Revenue Model”.
The Stratified LargeCap Index outperformed by 9.3% in 2022
Equities rebounded strongly in Q4 as markets began to discount long-term interest rates lower than had been previously expected. Consumer stocks staged a recovery, as did a wide range of growth companies. Despite the rising markets, Q4 highlighted the danger of taking concentrated stock positions, especially in mega-cap companies, as Tesla halved in value and Amazon fell by over 25%. These two positions alone caused a significant 2% drag on the cap-weighted S&P 500 Index, which rose 7.6% compared to the S&P 500 Equal Weight Index, which gained 11.6%.
The power of business risk diversification in 2022 was demonstrated by the Stratified US LargeCap Index, which substantially outperformed the S&P 500 by 9.3% and, due to its lower allocation to underperforming Information stocks, outperformed the S&P 500 Equal Weight Index by 2.7% (Exhibit 1).
Exhibit 1. Core Index Comparison
| Q4 2022 (%) |
| 12 months (%) |
| Index |
| Benchmark |
| Stratified |
| Benchmark |
| Rel. |
| Stratified |
| Benchmark |
| Rel. |
| Stratified LargeCap |
| S&P 500 |
| 12.20 |
| 7.56 |
| 4.64 |
| -8.79 |
| -18.11 |
| 9.32 |
| Stratified MidCap |
| S&P MidCap 400 |
| 12.83 |
| 10.78 |
| 2.04 |
| -12.30 |
| -13.06 |
| 0.76 |
| Stratified SmallCap |
| S&P SmallCap 600 |
| 9.65 |
| 9.19 |
| 0.46 |
| -18.21 |
| -16.10 |
| -2.11 |
| SEADM * |
| MSCI EAFE |
| 16.03 |
| 17.34 |
| -1.31 |
| -16.30 |
| -14.45 |
| -1.85 |
| Stratified LargeCap |
| S&P 500 Equal Weight |
| 12.20 |
| 11.64 |
| 0.56 |
| -8.79 |
| -11.45 |
| 2.65 |
| Source: Syntax, S&P Dow Jones Indices, MSCI. Total return performance does not reflect fees or implementation costs as an investor cannot directly invest in an index. Performance as of 31 December 2022. *Syntax Stratified Europe & Asia Developed Markets (SEADM) Index is based on the MSCI EAFE universe. |
International indices fared better than their US counterparts, due in part to their dramatically different sector compositions. The MSCI EAFE Index has significantly higher value exposure than the S&P 500, given its large number of Financials and Industrial companies relative to Technology stocks. By diversifying business risk, the Syntax Europe, Asia Developed Market (SEADM) Index allocated a larger weight to Information and IT stocks than the cap-weighted MSCI EAFE Index, resulting in MSCI EAFE’s marginal outperformance of +1.9% in 2022.
This trend was also observed among the smaller cap indices. The Stratified SmallCap Index underperformed the S&P 600 Index by 2.1% in 2022, driven by its 4% overweight (13.8% vs 9.8%) in underperforming tech stocks.
The Case for Stratified Weight in 2023
For most investors, 2022 was a challenging year. Every major benchmark across almost every asset class suffered significant declines. To put it in historical context, over the last 50 years, 2022 was the only year where both global stocks and bonds declined: the MSCI World Index fell 18.1%, and the Barclays Global Agg Index had its worst year ever, falling 16.3%. The main driver of these declines was the significant (inflation-fueled) rise in global interest rates. The Federal Reserve hiked rates from 0.25% to 4.5% in the US, while the UK and European central banks hiked their reference rates from near zero to 3.5% and 2.5%, respectively.
As we have consistently highlighted in our research, market cap-weighted indices often become overexposed to groups of companies with common business risks, such as the current concentration in technology stocks within the US large-cap space. The rising interest rate environment in 2022 created a significant headwind for the S&P 500, whereas the Stratified LargeCap Index fared considerably better.
We expect this relative outperformance to persist for these key reasons:
- Prolonged macroeconomic uncertainty amidst tight monetary policy
- Cap-weighted market indices remain concentrated
- The long-term, consistent outperformance of our Stratified Weight indices, particularly if value stocks continue to outperform.
As we begin 2023, many of the same macro-level risks that framed 2022 remain: heightened geopolitical tensions with China and Russia coupled with lingering global inflation, energy and food shortages and above all else, tightening monetary policy. In other words, we expect more of the same macroeconomic uncertainty that was experienced in 2022.
During periods of uncertainty and volatility, it has historically been prudent to have diversified portfolios. The same market risks, for the S&P 500, that were in place at the start of 2022 remain today, albeit to a lesser extent. These risks include an overreliance on a handful of mega-cap companies to drive performance and a large concentration in high multiple technology stocks.
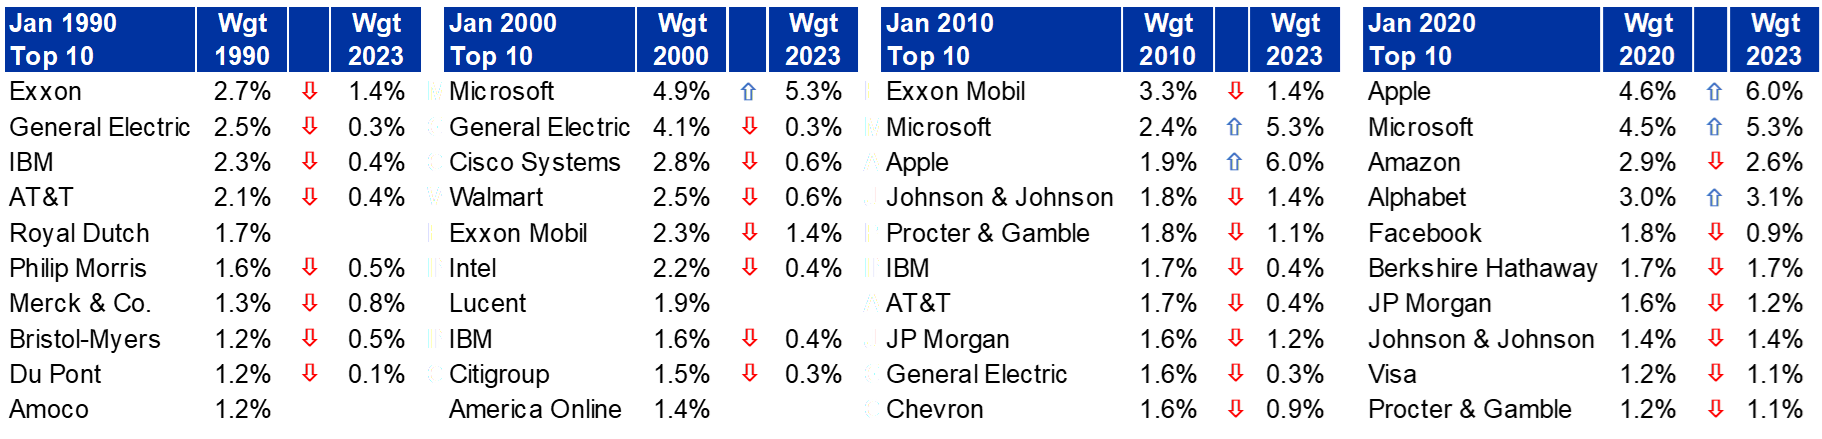
The largest companies in the Index often face specific challenges due to their size. The complexity of the largest companies makes high growth rates harder to achieve and hampers their ability to adapt to change than smaller, more nimble companies. Mega-cap companies also tend to face increased regulatory scrutiny, as is the case with the largest stocks today. These headwinds may explain why the largest cap-weighted companies in the Index do not remain the largest holdings indefinitely (Exhibit 2).
Since peaking as a top index holding, the individual weights of the ten largest stocks in the S&P 500 at the beginning of the last four decades have declined meaningfully.
Exhibit 2. Challenge to Stay on Top - Declining Weight of the S&P 500’s Largest Holdings (1990-2020)
The overdependence on a small number of stocks is only part of the concentration problem of cap-weighted indices. Technology companies remain overrepresented in the S&P 500 Index. At the start of 2022, technology companies made up 42.3% of the S&P 500. Our Affinity ® data shows that stocks exposed to the technology theme fell 25.1% in 2022 (Exhibit 7), explaining why the weight of technology names in the Index has similarly fallen to 33.4%.
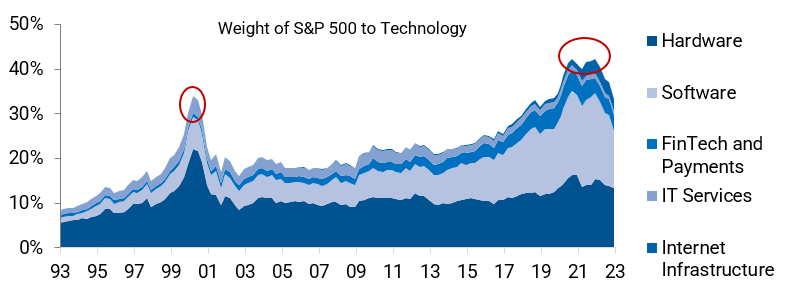
Exhibit 3 below shows the proportion of technology companies in the Index that has declined is currently at the same level as in March 2000 during the peak of the DotCom bubble. However, one interesting observation is that this cycle’s technology concentration is driven by Software, rather than Hardware (as was the case in March 2000) companies.
Exhibit 3: Current technology concentration is at similar levels to that of the DotCom Bubble
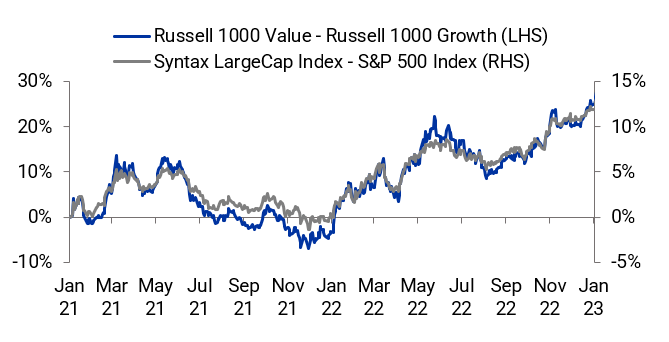
Over the past two years, Value has outperformed Growth and with it, the Stratified LargeCap Index has outperformed the S&P 500. Exhibit 4 shows how the relative performance of Value vs. Growth has had a strong bearing on the relative performance of Stratified vs. Cap-weighted indices in the US.
Since 2021, the correlation between the relative performance of Value vs. Growth and the Stratified LargeCap vs. the S&P 500 was 0.84.
Exhibit 4: Value vs. Growth has been Correlated with Stratified vs. Cap-Weight
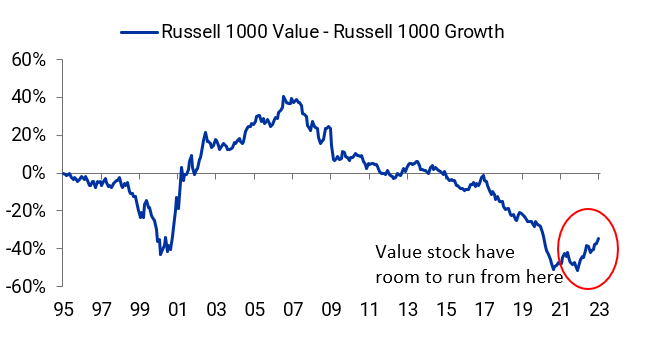
As shown in Exhibit 5, before 2021, Value had persistently underperformed Growth since 2008, and the relative performance of Value over the past two years has plenty of scope to continue.
The lesson from the 2000 episode is that even though growth stocks had underperformed significantly by the end of 2000, their persistently high valuations and their oversized weight within cap-weighted indices created ample room for them to fall further, as investors changed their investment style to focus more on valuations.
Exhibit 5: Growth has Dominated Value since 2008
The business risk concentrations that Stratified Weight indices seek to diversify can cause a meaningful drag on core index performance. We believe that this is why Stratified Weight indices, such as the Stratified LargeCap Index, have outperformed cap-weight indices over the long run. Exhibit 6 illustrates the consistent outperformance of the Stratified LargeCap Index versus the S&P 500 and the S&P 500 Equal Weight, over several key timeframes.
Exhibit 6: Stratified LargeCap Index Performance versus Benchmarks
| YTD |
| 4Q22 |
| 1Y |
| 3Y |
| 5Y |
| 7Y |
| 10Y |
| Since 20 Dec 91 |
| Stratified LargeCap |
| -8.79 |
| 12.20 |
| -8.79 |
| 9.83 |
| 9.90 |
| 11.85 |
| 13.03 |
| 13.05 |
| S&P 500 |
| -18.11 |
| 7.56 |
| -18.11 |
| 7.66 |
| 9.42 |
| 11.48 |
| 12.56 |
| 9.95 |
| S&P 500 Equal Weight |
| -11.45 |
| 11.64 |
| -11.45 |
| 9.01 |
| 9.11 |
| 11.26 |
| 12.40 |
| 11.47 |
| Source: Syntax Stratified LargeCap Index Factsheet, 31 December 2022. |
Stocks aligned with Inflation, Infrastructure and Defensive investing outperformed last year
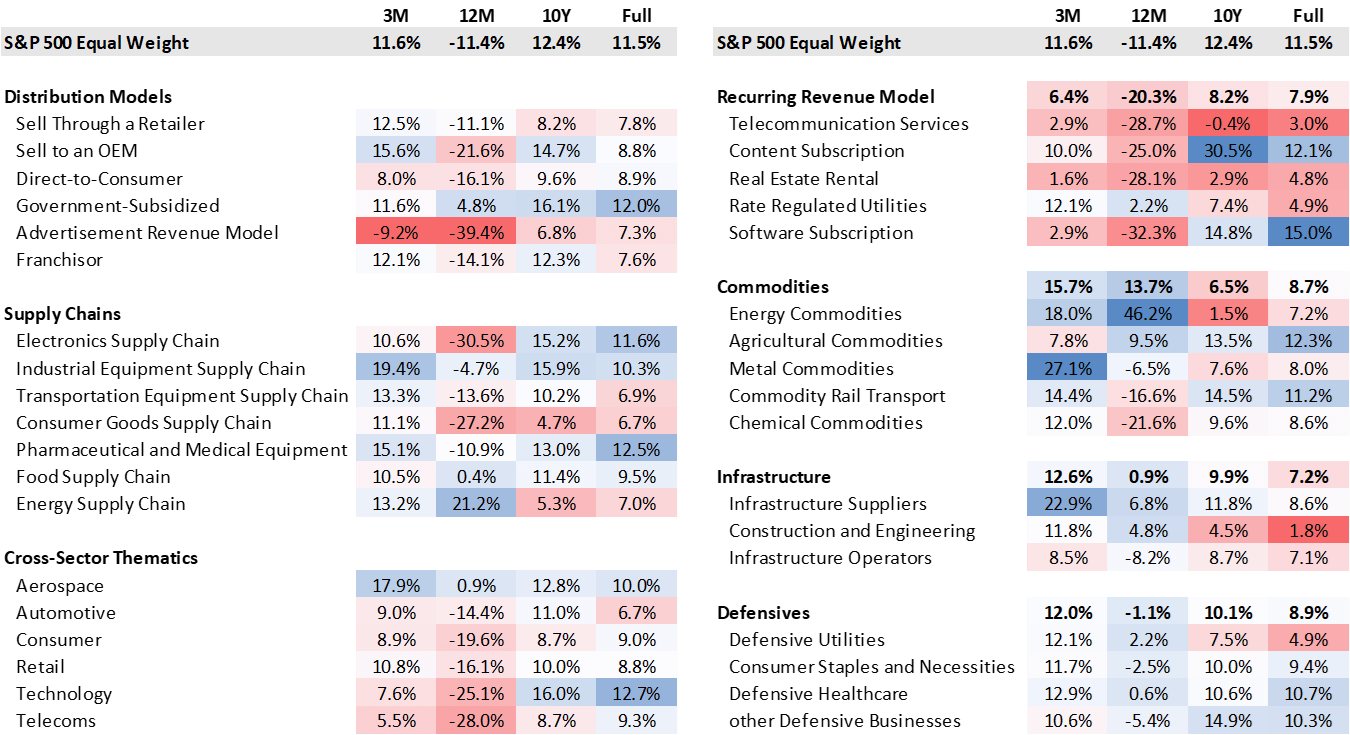
Using the Syntax Affinity ® platform, we view the market through a wide range of thematic lenses and calculate the performance of groups of relevant companies. Themes often persist in the markets for several months, and therefore, related stocks can continually out (or under)perform. In 2022, stocks related to the Inflation, Infrastructure and Defensive themes outperformed the broader market.
Inflation . Global supply chain issues coupled with tight labor markets have driven the prices of many goods and services higher. The rising costs of food, energy, rents, autos and household goods can benefit the revenues of several groups that can pass through these costs to end customers and users. These groups include commodities, clean energy, infrastructure, real estate and royalties. In the S&P 500, Inflation-related companies rose 8.3% while unrelated companies fell 14.6%.
Infrastructure . Large, multi-year infrastructure projects produce stable cashflows. The stability of these income streams is desirable in the current environment, together with the depressed valuations of the underlying companies. This contrasts with the volatile cashflows and high multiples of many growth companies. Infrastructure operators, suppliers and construction and engineering all outperformed on average last year. Infrastructure companies rose 0.9% in 2022 while unrelated companies fell 14.0%.
Defensives . Defensive companies, such as regulated utilities or consumer staples and certain healthcare companies, have enjoyed stable demand and reliable revenues. Their non-cyclical income streams are attractive during periods of high uncertainty or slowing growth as they offer more visible earnings. Defensives outperformed their counterparts by 13.9% in 2022.
Stocks depending on advertising revenue fell 39% on average in 2022
Stocks which depend on advertising revenues (primarily using websites and television) fared particularly poorly in 2022. Advertising revenues are highly cyclical, and investor sentiment has declined with rising recession risks. Hence, the group of stocks whose primary product revenues are derived from advertising fell -39%.
Companies in this group that experienced performance headwinds in 2022 include: Alphabet ( GOOG, GOOGL , -39.1%); Meta Platforms ( META , -64.2%); Disney ( DIS , -43.9%); Comcast ( CMCSA, -28.7%); FOX (-15.8%) and NewsCorp ( NWSA, -17.5%).
Exhibit 7. Thematic Performance within the US LargeCap Universe
| Performance is calculated as the weighted average total return of the subset of the S&P 500 Equal Weight Index constituents who are members of the Affinity Theme. 3M shows total return for 30 September 2022 to 31 December 2022. YoY shows total return from 31 December 21 to 31 December 2022. Full performance period uses period from 31 December 1991 when available. Performance does not reflect fees or implementation costs. |
| Important Disclaimers This document is for informational purposes only and is not intended to be, nor should it be construed or used as an offer to sell, or a solicitation of any offer to buy, any security. Additionally, the information herein is not intended to provide, and should not be relied upon for, legal advice or investment recommendations. You should make an independent investigation of the matters described herein, including consulting your own advisors on the matters discussed herein. In addition, certain information contained in this factsheet has been obtained from published and non-published sources prepared by other parties, which in certain cases have not been updated through the date hereof. While such information is believed to be reliable for the purpose used in this factsheet, such information has not been independently verified by Syntax and Syntax does not assume any responsibility for the accuracy or completeness of such information. Syntax LLC, its affiliates and their independent providers are not liable for any informational errors, incompleteness, or delays, or for any actions taken in reliance on information contained herein. Past performance is no guarantee of future results. The inception date of the Syntax Stratified LargeCap and Syntax Stratified MidCap Indices was December 27, 2016. The inception date of the Syntax Stratified SmallCap Index was January 3, 2020. The inception date of the Syntax Europe & Asia Developed Markets (“SEADM”) Index was January 1, 2016. The inception date of the Syntax Real Asset Index was July 1, 2015. Charts and graphs are provided for illustrative purposes only. Index performance does not represent actual fund or portfolio performance and such performance does not reflect the actual investment experience of any investor. An investor cannot invest directly in an index. In addition, the results actual investors might have achieved would have differed from those shown because of differences in the timing, amounts of their investments, and fees and expenses associated with an investment in a portfolio invested in accordance with an index. None of the Syntax Indices or the benchmark indices portrayed herein charge management fees or incur brokerage expenses, and no such fees or expenses were deducted from the performance shown; provided, however that the returns of any investment portfolio invested in accordance with such indices would be net of such fees and expenses. Additionally, none of such indices lend securities, and no revenues from securities lending were added to the performance shown. The Syntax Stratified LargeCap Index, Syntax Stratified MidCap Index, Syntax Stratified SmallCap Index, SEADM Index are the property of Syntax, LLC, which has contracted with S&P Opco, LLC (a subsidiary of S&P Dow Jones Indices LLC) to calculate and maintain the Indices. The Indices are not sponsored by S&P Dow Jones Indices or its affiliates or its third party licensors (collectively, “S&P Dow Jones Indices”). S&P Dow Jones Indices will not be liable for any errors or omissions in calculating the Index. “Calculated by S&P Dow Jones Indices” and the related stylized mark( S ) are service marks of S&P Dow Jones Indices and have been licensed for use by Syntax, LLC. S&P ® is a registered trademark of Standard & Poor's Financial Services LLC (“SPFS"), and Dow Jones ® is a registered trademark of Dow Jones Trademark Holdings LLC (“Dow Jones”). The MSCI EAFE Index was used by Syntax, LLC as the reference universe for selection of the companies included in the SEADM Index. MSCI does not in any way sponsor, support, promote or endorse the Index. MSCI was not and is not involved in any way in the creation, calculation, maintenance or review of the Index. The MSCI EAFE Index was provided on an “as is” basis. MSCI, each of its affiliates and each other person involved in or related to compiling, computing or creating the MSCI EAFE Index (collectively, the “MSCI Parties”) expressly disclaim all warranties (including, without limitation, any warranties of originality, accuracy, completeness, timeliness, non?infringement, merchantability and fitness for a particular purpose). Without limiting any of the foregoing, in no event shall any of the MSCI Parties have any liability for any direct, indirect, special, incidental, punitive, consequential (including, without limitation, lost profits) or any other damages in connection with the MSCI EAFE Index or the SEADM Index. Prior to March 19, 2018, the SEADM Index was calculate by NYSE. Sector subsets of the Syntax Stratified LargeCap, Syntax Stratified MidCap, and SEADM Indices are calculated using model performance generated in FactSet, and as such may differ from index calculations performed by S&P Dow Jones Indices. The Affinity Thematics are the property of Syntax, LLC, which has calculated their performance using Affinity ® . Syntax will not be liable for any errors or omissions in calculating the Affinity Thematics. Syntax ® , Stratified ® , Stratified Indices ® , Stratified-Weight™, Stratified Benchmark Indices™, Stratified Sector Indices™, Stratified Thematic Indices™, Affinity ® , and Locus ® are trademarks or registered trademarks of Syntax, LLC and its affiliate Locus LP. The S&P 500 ® Index is an unmanaged index considered representative of the US mid- and large-cap stock market. The MSCI EAFE Index is an unmanaged index considered representative of the European, Australian, and East Asian large-cap stock market. Benchmark data for the S&P 500, S&P 500 Equal Weight, S&P MidCap 400, S&P MidCap 400 Equal Weight, S&P SmallCap 600, S&P SmallCap 600 Equal Weight, and S&P Real Assets Equity Indices are provided by S&P Dow Jones through FactSet ® . Benchmark data for the MSCI EAFE index is provided by MSCI through FactSet. |
For further details see:
Passive Perspectives: Fourth Quarter 2022