AGNCO - PDI: 100 Big Yield CEFs REITs MLPs - These 3 Worth Considering
2023-08-31 01:20:30 ET
Summary
- We share updated data on over 100 big-yield opportunities (including CEFs, REITs, and MLPs) and then highlight one particularly attractive opportunity from each group.
- We have a special focus on the PIMCO Dynamic Income Fund, including its big +14% monthly distribution (as well as the hidden and explicit costs of owning it).
- We conclude with our strong opinion on investing in all three (especially PDI) plus more information on where we are seeing the very best big-yield opportunities today.
If you are an income-focused investor, there are a lot of big-yield opportunities (and pitfalls) to choose from. In this report, we share updated data on over 100 big-yield CEFs, REITs and MLPs, and then highlight three (one from each category) that are particularly interesting. We have a special focus on PIMCO's Dynamic Income Fund ( PDI ). Finally, we conclude with our strong opinion on investing in these specific opportunities, plus more information on where we are seeing the very best big-yield opportunities going forward.
Big-Yield Closed-End Funds (CEFs):
Before getting into the details on PDI, it's worth mentioning that CEFs (like PDI) are frequently an income-investor favorite because they can offer some big steady income payments, often paid monthly (for example, see over 30 big-yield CEFs in the table below).
However, there are a few important CEF nuances that investors should be aware of before they invest. For example, similar to other mutual funds and exchange-traded funds, CEFs own a basket of individual securities (such as stocks or bonds, depending on the strategy) and thereby offer some instant diversification benefits. However, unlike other mutual funds and exchange traded funds, CEFs can often trade at wide discounts or premiums (compared to the aggregate value of their underlying holdings) and thereby creating some unique risks and opportunities.
For a little more perspective, the following graphic explains 7 things we always consider before investing in any close-end fund.
Blue Harbinger
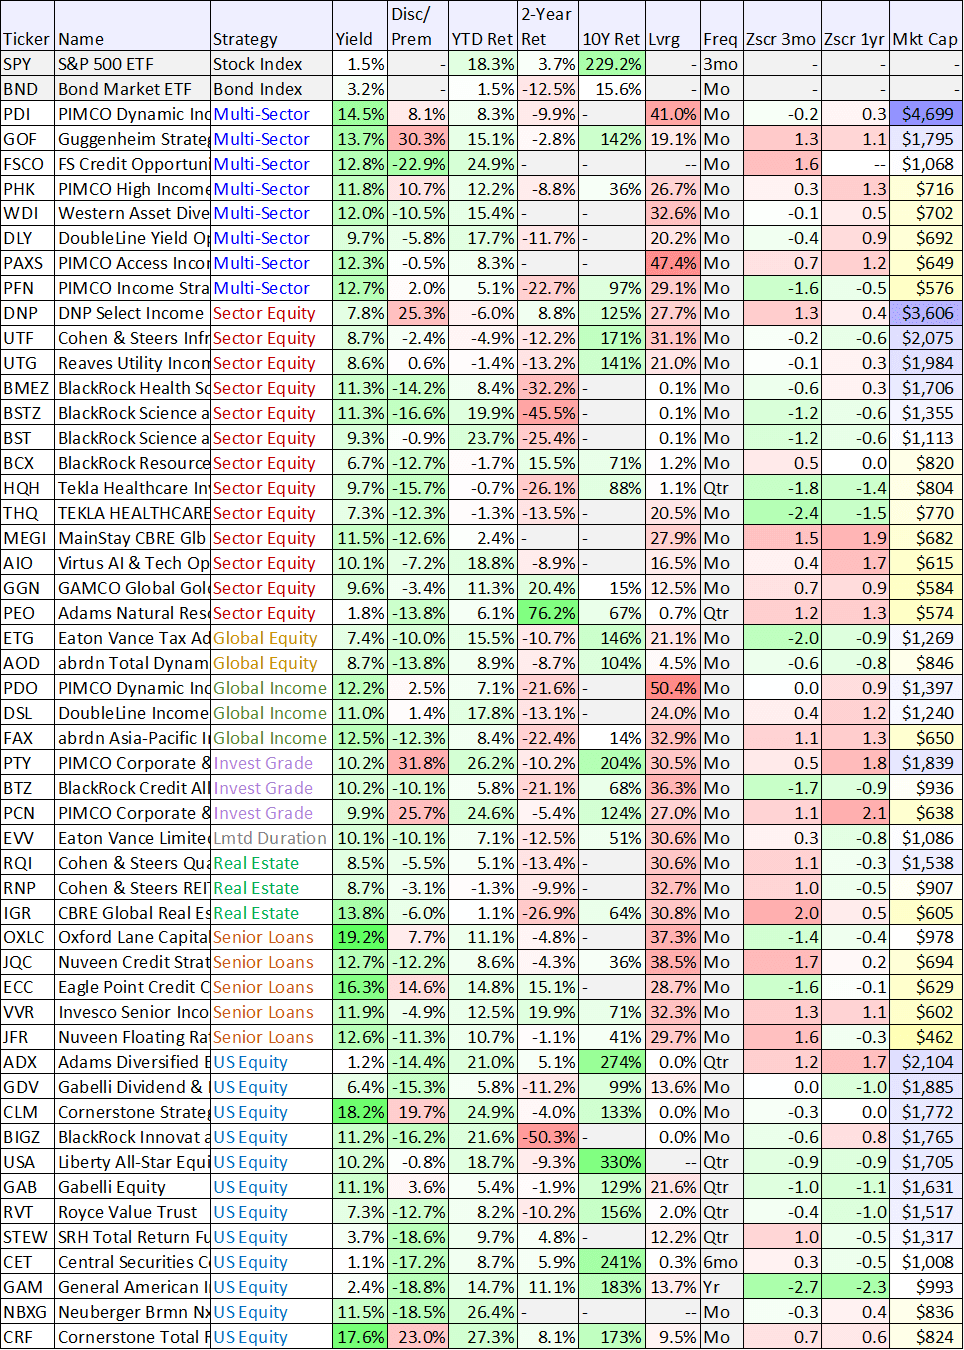
And for more perspective, the following table shares data on a variety of big-yield CEFs.
Data as of 29-Aug-23 (CEF Connect, Stock Rover)
( GOF ) ( PAXS ) ( PDO ) ( PTY ) ( ADX ) ( CET ) ( THQ ) ( THW ) ( BIT ) ( BTZ ) ( RQI ) ( DNP )
As you can see in the table above, CEFs vary widely. And one CEF that we consider particularly interesting is described below.
1. PIMCO Dynamic Income Fund ((PDI))
One name that stands out from the above list is the PIMCO Dynamic Income Fund. PDI is very popular among income-focused investors, and it should be. It offers big monthly distribution payments (that have increased over time), it occasionally pays additional special dividends (see chart below), and the fund is managed by a world-class company, PIMCO. However, there are significant costs, both implicit and explicit, that investors should consider. In the paragraphs below, we weigh PDI's attractive qualities against its various costs, and then share our opinion about why we believe it is still worth considering if you are an income-focused investor.
PDI Overview:
Per the PIMCO website , the PIMCO Dynamic Income Fund ((PDI)):
“Seeks current income as a primary objective and capital appreciation as a secondary objective.”
And as you can see in the distribution chart below, the fund has a long history of successfully delivering strong current income (i.e. its primary objective).
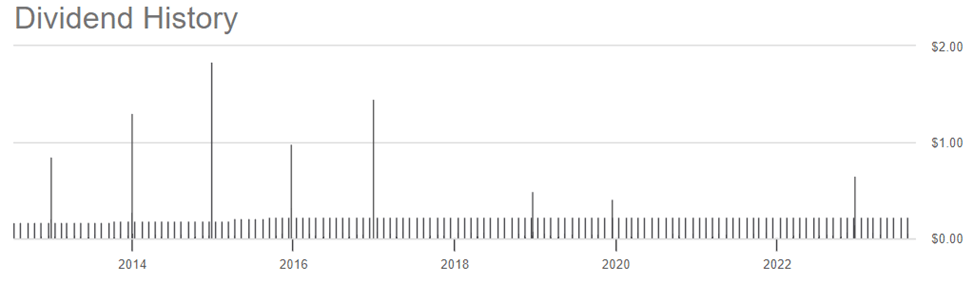
However, the fund’s high current income comes at a cost, namely it detracts from PDI’s secondary objective (i.e. capital appreciation), especially over the last four years (as you can see in the price and net asset value (“NAV”) chart below).
We’ll have more to say about the significant costs (both implicit and explicit) supporting this fund’s big yield (later in this report), but first let’s review some of the fund’s basics.
For starters, here is a look at PDI’s recent investment allocations. As you can see, the fund holds a mix of government, mortgage-backed and high-yield securities (MV is market value and DWE is duration weighted exposure).
PIMCO website
Duration is a measure of interest rate risk. PDI’s duration was recently 3.41 years (reasonable for this type of fund). And the varied maturities of the underlying holdings give the fund some diversification and flexibility in terms of dealing with interest rate movements.
PIMCO website
The fund also uses a significant amount of leverage (or borrowed money). Leverage can magnify income and price gains in the good times, but it increases risk in the bad times (such as the last couple years as interest rates have risen swiftly--as rates rise, bond prices fall).
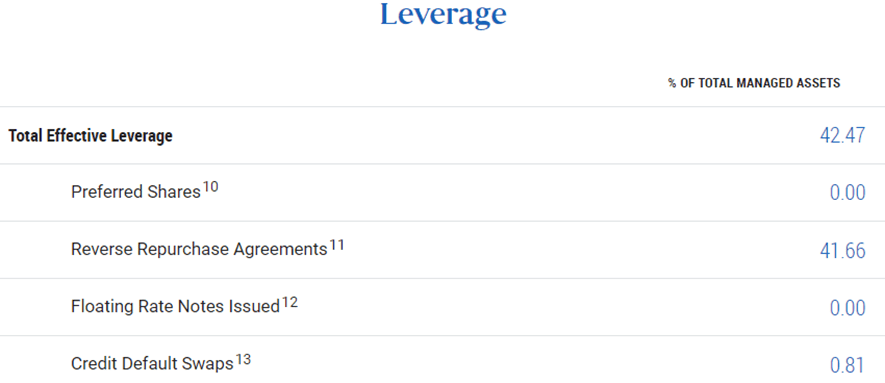
The Costs of PDI (Hidden and Explicit):
As mentioned earlier, PDI’s very big and successful monthly distributions have come at a high price, as described in the paragraphs below.
Management Fees : Perhaps the most apparent and obvious cost to investors are the management fees. In PDI’s case (as per the company website) the management fee was recently 1.10% per year. That is what you pay the PIMCO management team for delivering the strong income this fund has delivered. This fee is fairly high compared to the universe of fund fees, but it is reasonable for this type of bond-focused closed-end fund, especially one managed by PIMCO.
Operating Expenses : PDI’s total expense ratio (excluding interest expense) was recently 2.0%. And if we back out the management fee, that means the operating expense is 0.90%. This is a lot, and it detracts from your total returns. However, as long as the big income payments keep rolling in, many investors don’t mind this very significant (high) total expense ratio.
Interest Expense : The fund’s total expense ratio (including interest expense) was recently 2.64%. So that means the interest expense was recently 0.64% (i.e. 2.64%-2.0%). The interest expenses account for borrowing costs (remember, this fund has a significant amount of leverage, or borrowed money, to help magnify returns and income). A 2.64% expense ratio is a lot! But it’s also reasonable for this type of PIMCO high-income CEF.
Price Premium : As described earlier, PDI currently trades at a price premium of around 8.1%. That means when you purchase shares you pay 8.1% more than the net asset value of the fund’s underlying holdings. That is a big price premium and a big cost to you, but it is fairly common for popular PIMCO CEFs because many investors appreciate and trust the steady long-term income track record.
Return of Capital (“ROC”) : CEFs can source their big distributions from a variety of sources, including dividend and interest income on the underlying holdings, capital gains (both short-term and long-term) and a return of capital (for example, returning some of your own original investment dollars just to support that big steady monthly distribution payment). Many investors don’t mind where the income comes from, as long as they can spend it! But others recognize these various sources of income have various tax consequences and can impact the fund’s long-term sustainability differently. For example, we previously wrote in great detail about PDI's ROC (which many investors don’t realize exists) and how it reduces NAV thereby reducing future earnings potential of the fund and even weakens the long-term sustainability of the distribution. ROC is a risk factor and a cost that investors should be aware of.
Interest Rate Risk : Interest rate volatility impacts the value of this fund (as rates rise, prices fall), and the extremely steep rise in interest rates over the last two years has been a big contributor to this fund’s price and NAV declines. The duration of this fund (a measure of interest rate risk) was recently 3.41 years, which is reasonable and achieved through a wide variety of underlying holdings with widely different maturity and interest payment dates). Even though losses from climbing interest rates aren’t always realized right away, it impacts the operations of the fund, especially with regards to various derivatives instruments PDI uses to offset interest rate risks. Rising rates have been a big cost to this fund.
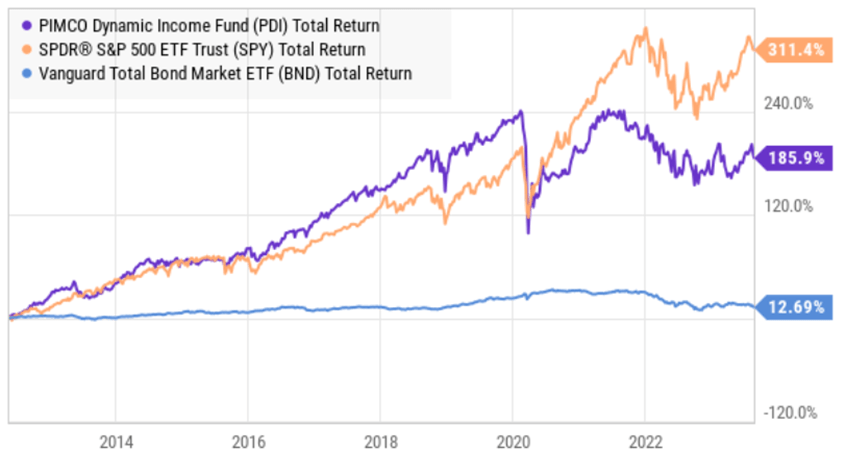
Opportunity Costs : The opportunity cost (or the cost of choosing PDI over other investment opportunities) really comes down to the investment objectives of those who invest in PDI. For example, many people simply invest in PDI because they want those big steady monthly income payments. And throughout its history, PDI has delivered. However, all of the costs described above detract from this fund’s value and capital appreciation (recall, capital appreciation is PDI’s secondary objective). For instance, here is a look at PDI’s 5-year performance (i.e. total return: price appreciation + distributions reinvested) versus unlevered bond ( BND ) and stock ( SPY ) funds.
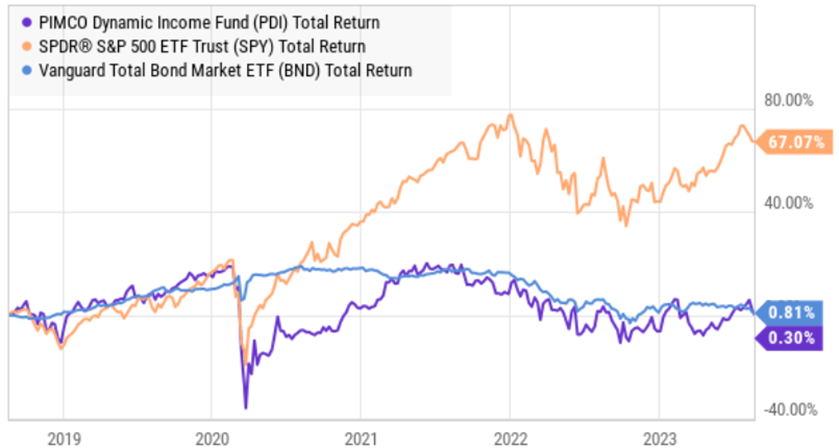
PDI is not impressive over the last five years, but for more perspective, the fund looks a lot better over the longer-term (since inception), but the opportunity costs are still very real and worth considering.
And worth mentioning again, PDI’s future earnings potential has arguably been seriously damaged by the destruction of NAV over time (especially the last few years), as you can see in this next chart showing NAV only (excluding distributions). You can only earn so much income (to pay distributions) based on the NAV you’re working with.
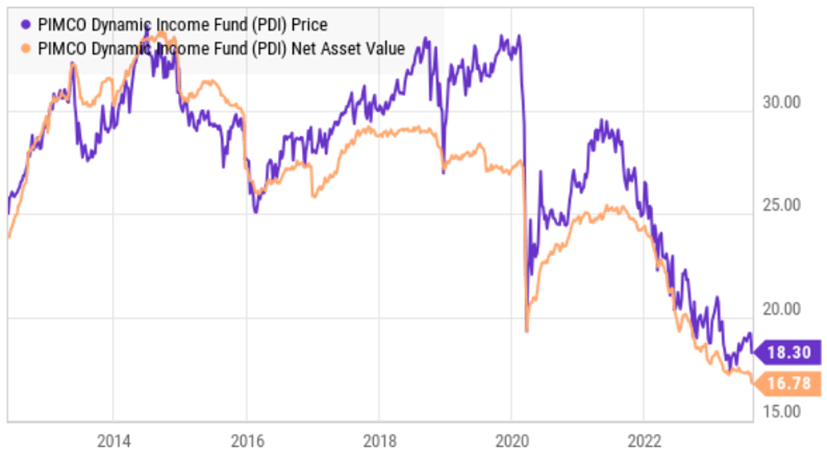
The Bottom Line on PDI
The management team at PIMCO has worked their magic over the last few years (through all kinds of derivatives instruments, income reclassification technicalities and even a fund merger—as we described in the ROC article linked earlier) to maintain the big steady distribution payments that so many investors love. And with interest rate volatility finally seeming to slow down, the road ahead for PDI’s price appears more promising. Just know that the fund’s big steady income payments come at a cost (such as those described in this report).
If you don’t need big steady income payments, it’s probably in your best interest to stay the heck away from PDI (because of all the costs and expenses that detract from long-term capital appreciation and total returns). But if big steady monthly income is your primary objective, then PDI is absolutely worth considering for a spot in your high-income-focused investment portfolio. We currently own shares of PDI in our 27-position "High Income NOW" portfolio.
Real Estate Investment Trusts (“REITs”):
Switching gears to REITs, these ae companies that own, sometimes operate, and/or finance income-generating real estate properties. And REITs come in a wide variety of shapes and sizes, as you can see in the following table.
Data of 29-Aug-23 (StockRover) (PLD) (SPG) (O) (AMT) (CCI) (DLR) (IRM) (NLY) (AGNC) (RITM) (VICI) (WPC) (MPW) (OHI)
A few things you’ll notice about the data in the table above. For one, office REITs have been absolutely terrible over the last two years (because so many people work from home now, especially following the pandemic). Also, mortgage REITs stand out for offering particularly high yields, but you’ll also notice they don’t have particularly long track records of maintaining and growing their dividends (because they are forced to reduce them relatively frequently). Additionally, Industrial REITs have been relatively strong, and we continue to like that group going forward because it is still needed (and growing) despite increases to online shopping habits (unlike many retail REITs, which have struggled).
2. W. P. Carey ( WPC ), Yield: 6.6%
W.P. Carey is a large-cap, blue-chip diversified REIT, specializing largely in industrial properties (as well as retail and office properties, to a lesser extent). The company has a long history of growing its dividend (thanks in part to rent escalators) and it is well positioned to benefit going forward (considering its relatively strong financial position and very solid real estate portfolio). Further, it presents an increasingly attractive contrarian opportunity considering REIT prices (WPC in particular) continue to be weak this year. We recently wrote this one up in detail, and you can access the report using the following link:
Master Limited Partnerships (MLPs), Midstream Energy
MLPs and midstream energy companies are generally involved in the transportation, storage and processing of oil and natural gas. And they are often another income-investor favorite (because of their very high yields). However, before investing, there are a few things you should know.
MLPs are publicly-traded partnerships (i.e. you can buy and sell them on a public exchange, much like a stock) with unique tax advantages and challenges. Specifically, MLPs don’t pay taxes at the entity level, but instead the investors (e.g. limited partners like you) are on the hook for any tax consequences (i.e. MLPs are passthrough securities).
The MLP partnership structure can create challenges at tax time. For example, you’ll receive a K-1 statement (instead of a 1099) at tax time (this can slow down the filing of your annual taxes). Further, some brokerages simply don’t allow you to own MLPs in retirement accounts (such as an IRA) because they can trigger tax consequences in otherwise non-taxable accounts (i.e. more headaches for investors).
If you can handle the MLP structure, then MLPs can offer some extremely attractive high-income opportunities. However, there are also some non-MLP midstream companies that also offer attractive high yields, as you can see in the following table.
Data as of 29-Aug-23 (StockRover) (ENB) (EPD) (ET) (WMB) (PSX) (MMP) (OKE) (KMI) (AMLP) (PAA)
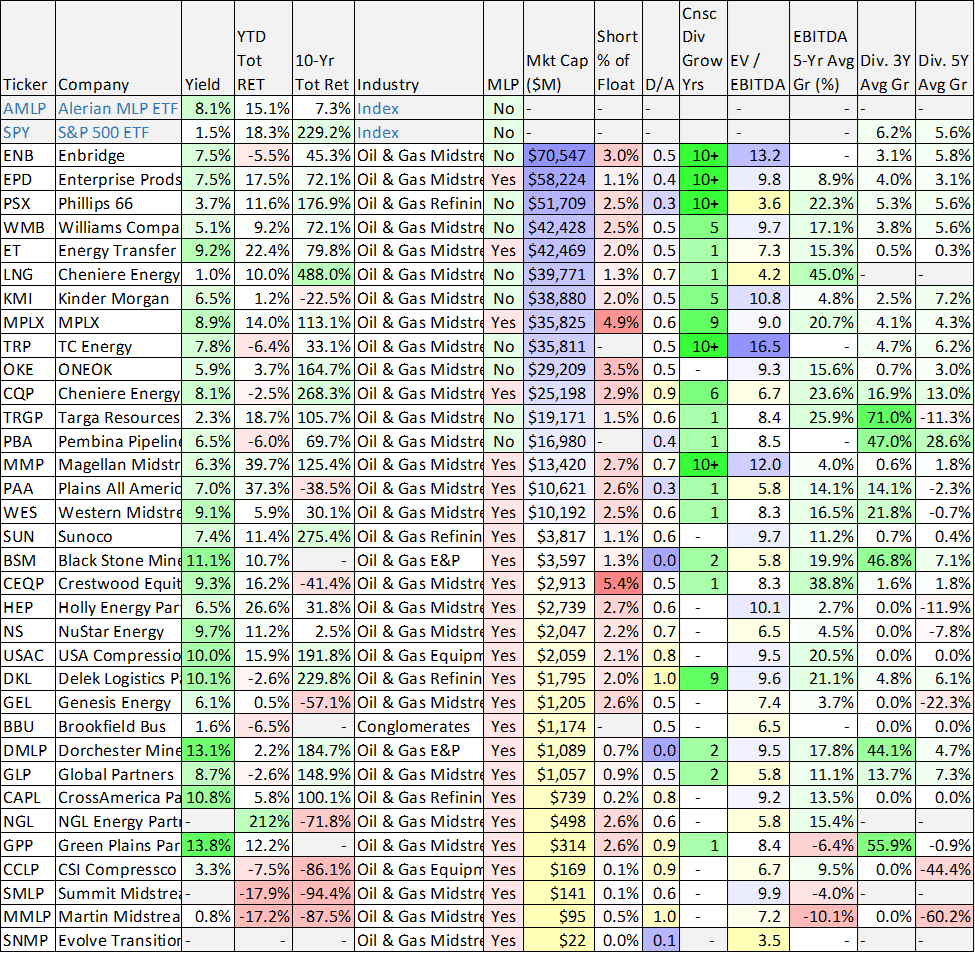
The table includes a mix of MLPs (K-1’s) and non-MLP midstream companies (no K-1’s). You likely recognize a few of your favorites on this list, as well as a few that may have frustrated you with large tax bills when they converted from MLPs to corporations.
3. Energy Transfer ( ET ), Yield: 9.2%
Energy Transfer is an MLP that owns and operates nearly 125,000 miles of pipeline and associated infrastructure in 41 states (and with a strategic footprint in all major U.S. production basins). And if you are an income-focused investor, it offers a very tempting 9.2% yield. Especially considering the stable fee-based income, the healthy distribution coverage ratio and the ongoing volume growth trajectory. In the following report, we provide the details on why we believe ET offers such an attractive balance of risks versus rewards.
Conclusion:
We have ranked W.P. Carey #10, Energy Transfer #9 and PIMCO's Dynamic Income Fund #7 in our new report Top 10 Big Yields . We believe they are all particularly attractive in their own specific categories, and they are all worth considering if you are an income-focused investor. Both WPC and ET are high on our current watch list, and we currently own shares of PDI in our High Income NOW portfolio
For further details see:
PDI: 100 Big Yield CEFs, REITs, MLPs - These 3 Worth Considering