PTY - PDI And PTY's Yield Predicament
Summary
- The PIMCO Dynamic Income Fund and the PIMCO Corporate & Income Opportunity Fund appear to be appealing for several good reasons.
- Their yields of 10%~12% are 3~4 times more than risk-free rates and also slightly above their own historical averages.
- Nonetheless, I see both funds in a yield predicament.
- The yield curve is inverted at the deepest level since the 1980s. The spread between high-yield corporate bonds and treasury rates is very thin also.
- As such, I do not see their yields as high enough to justify these macroscopic risks. Neither do I see favorable price appreciation potential given their high premiums.
Thesis
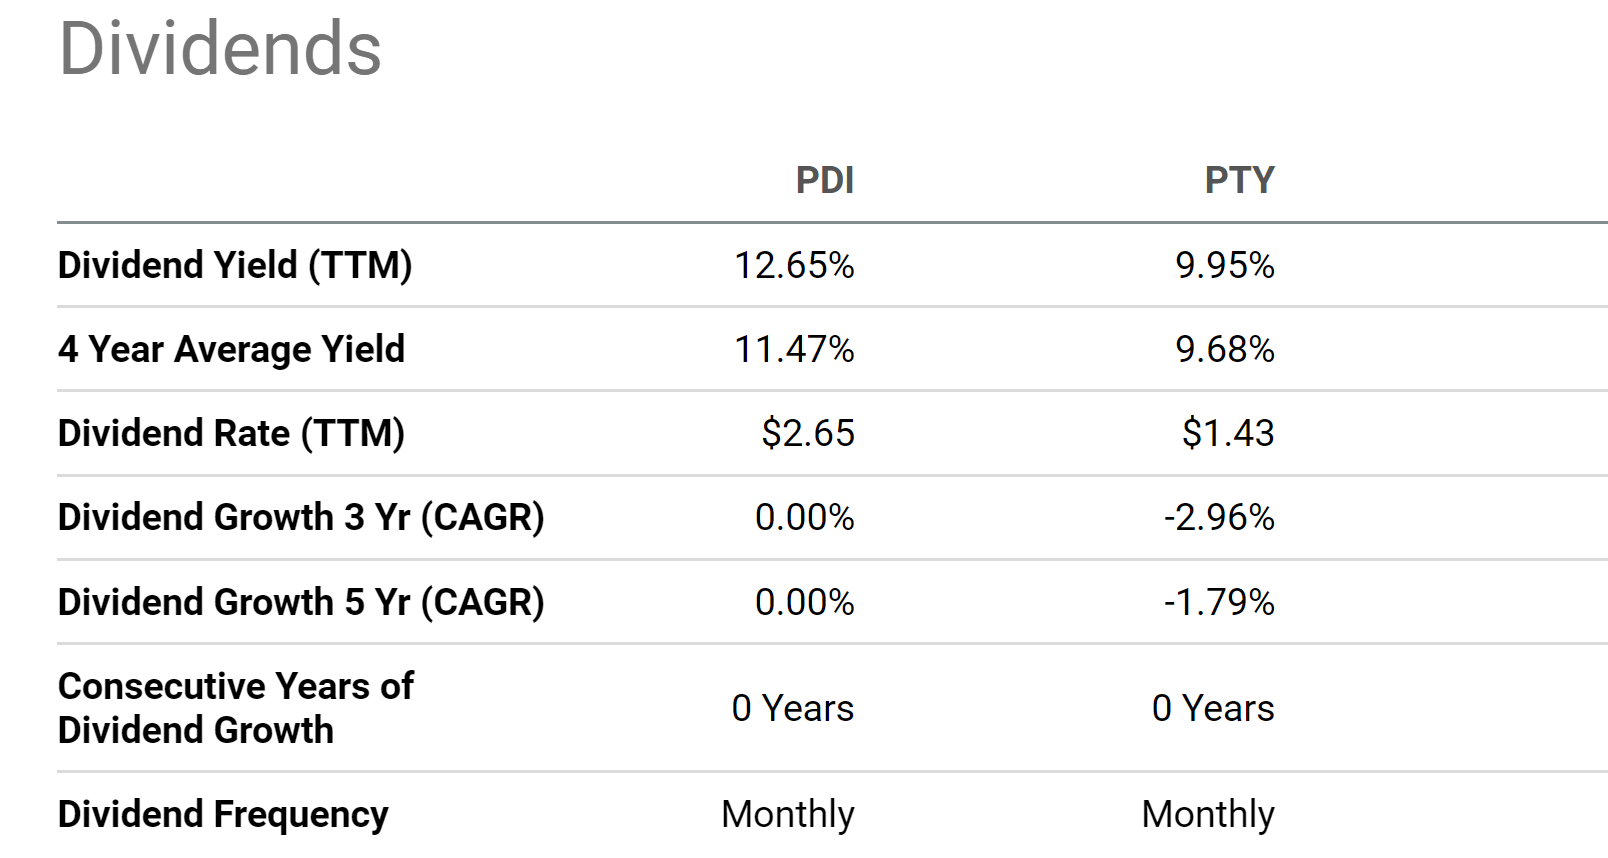
The PIMCO Dynamic Income Fund ( PDI ) and the PIMCO Corporate & Income Opportunity Fund ( PTY ) are popular CEFs for income seekers. They appear appealing for various good reasons. For example, currently, PDI is yielding around 12.6% and PTY yielding 9.95%. Such yields are attractive in both comparative and absolute terms. These yields exceed treasury rates by about 3x to 4x and are also higher than their own historical averages as you can see from the following chart. PDI's current yield of 12.6% is about 10.5% higher than its 4-year average of 11.47%. And PTY's current yield of 9.95% is about 2.8% higher than its 4-year average of 9.68%.
Despite their mouthwatering yields, my main thesis here is that I see a dilemma in both of them under current conditions. Viewed as an income generation vehicle, I do not see their yields as high enough to compensate for the current macroeconomic environment with their exposures (elaborated on in the next section). The yield curve is inverted at an extent that is the deepest level since the 1980s. And the yield spread between high-yield Corporate bonds and 10-Year Treasury Constant Maturity Bonds is close to a historical low. Their current 10~12% yields are insufficient to justify these macro risks the way I see things. Meanwhile, I do not see favorable price appreciation potential given their high premiums and also asset allocations.
PDI vs. PTY: Basic information
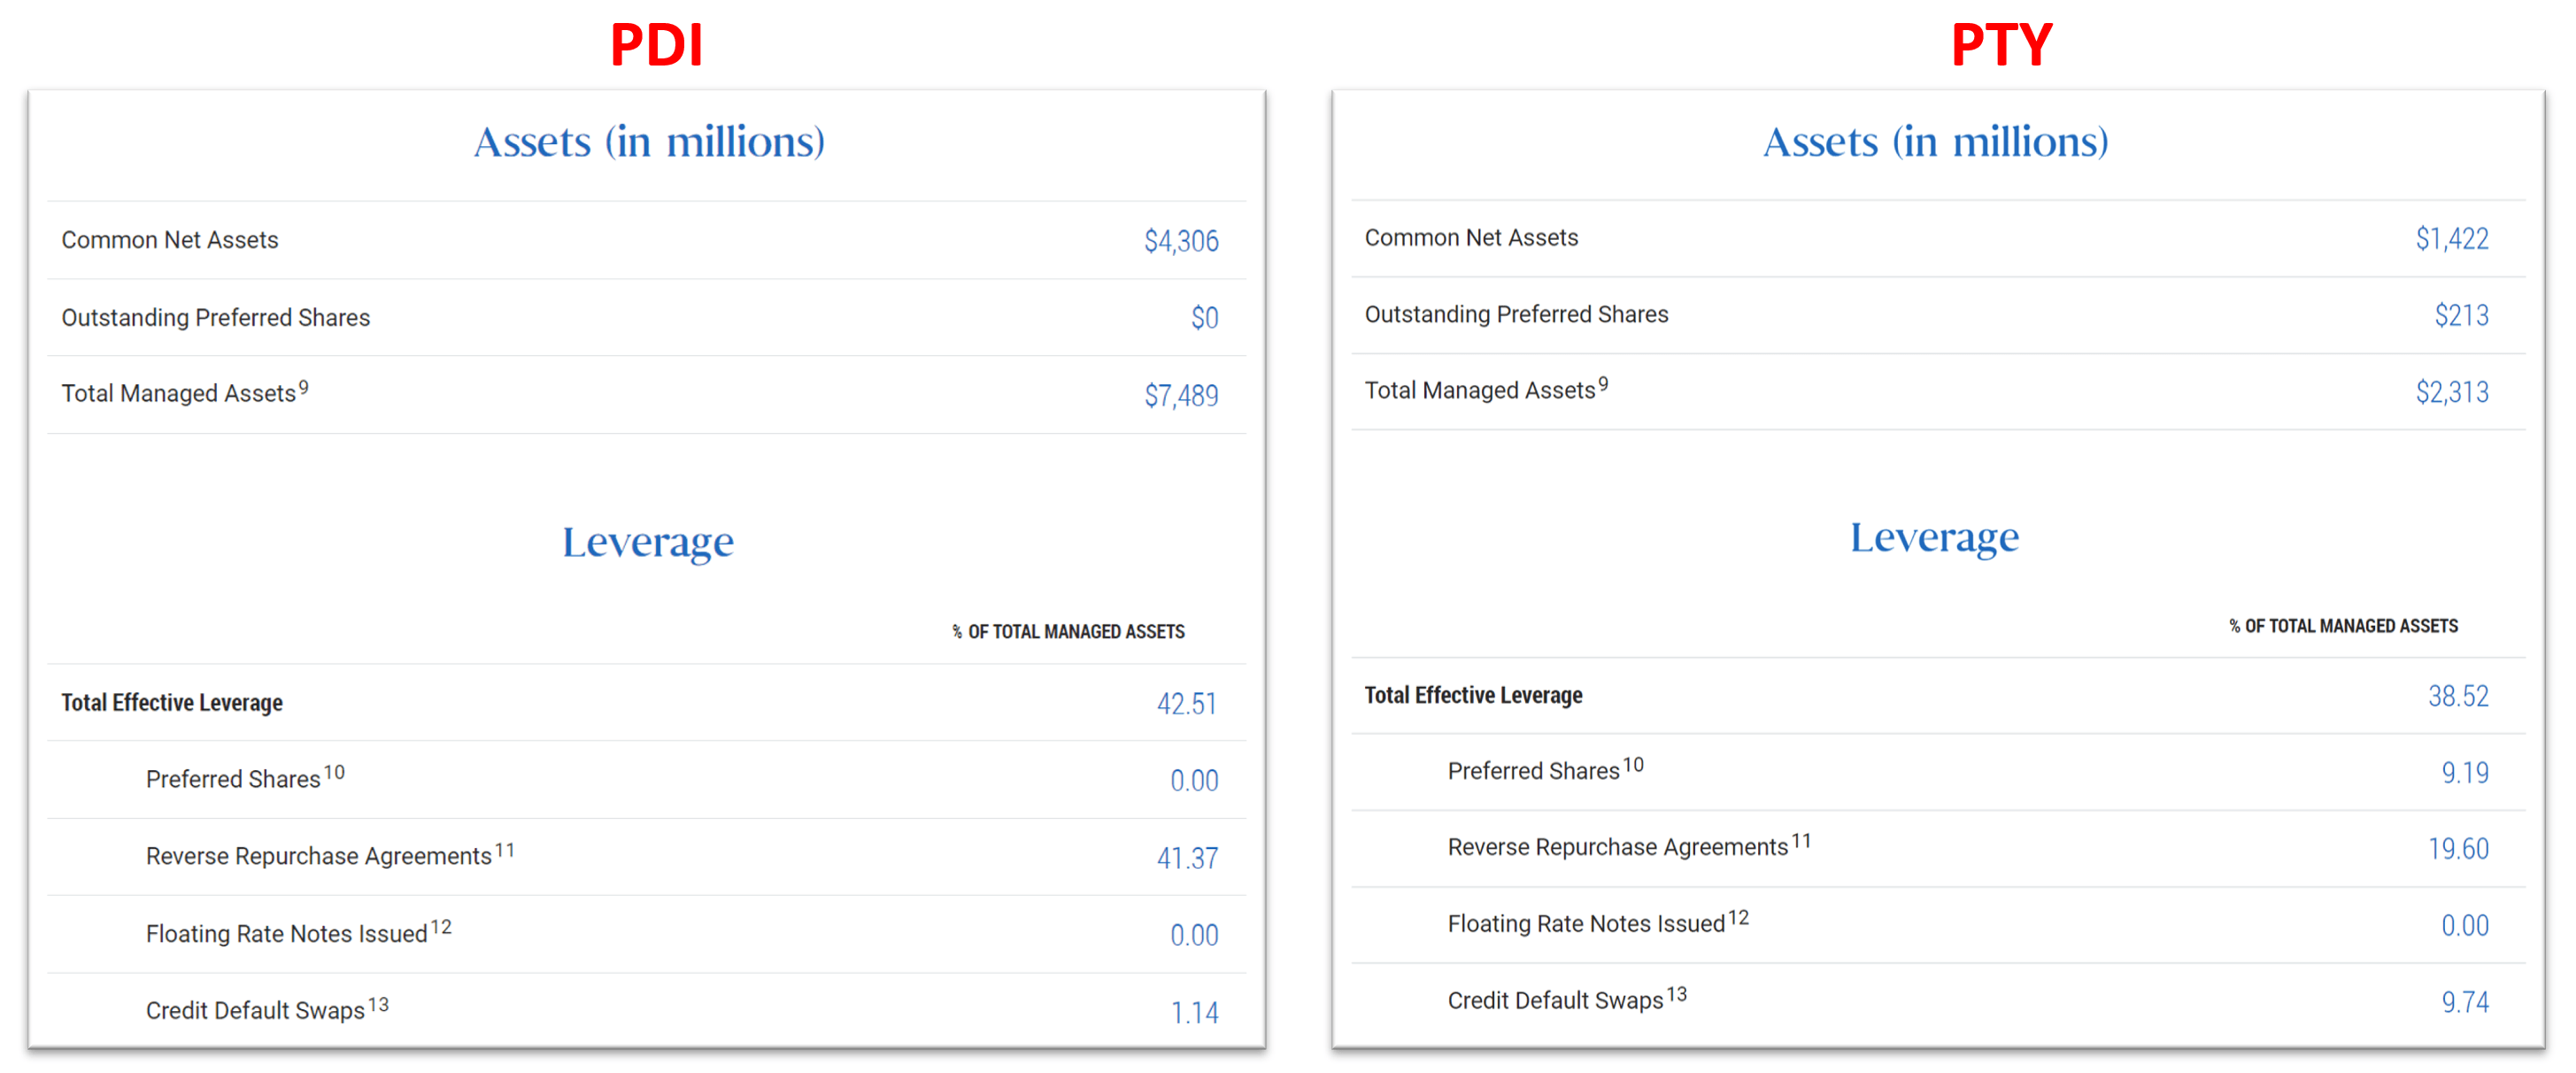
Both PDI and PTY are popular closed-end funds ("CEFs") managed by the Pacific Investment Management Company ("PIMCO"). They share many similarities (and some key differences too, to be detailed in the next section) in terms of their investment objectives, strategies, and holdings. The chart below summarizes their envelope information. PDI has $7.4 billion of Total Managed Assets ("TMA"). And PTY is relatively smaller, with $2.3 billion of Total Managed Assets. Both funds use leverage. With $7.4 billion of TMA and $4.3 billion of Common Net Assets ("CNA"), PDI's effective leverage ratio is about 1.72x. In comparison, PTY's effective leverage ratio is a bit lower, about 1.62x.
Source: PDI and PTY fund descriptions
More importantly, both funds follow a quite similar strategy as described in their fund descriptions as quoted below. The emphases were added by me.
PDI seeks to achieve its investment objectives by utilizing a dynamic asset allocation strategy among multiple fixed income sectors in the global credit markets, including corporate debt, mortgage-related and other asset-backed securities, government and sovereign debt, taxable municipal bonds and other fixed-, variable- and floating-rate income-producing securities of U.S. and foreign issuers, including emerging market issuers.
PTY seeks to achieve its investment objective by utilizing a dynamic asset allocation strategy among multiple fixed income sectors in the global credit markets, including corporate debt, mortgage-related and other asset-backed securities, government and sovereign debt, taxable municipal bonds and other fixed-, variable- and floating-rate income-producing securities of U.S. and foreign issuers, including emerging market issuers.
As seen, both funds primarily invest in corporate bonds and other fixed-income securities with a focus on high yield. And next, I will explain why I am concerned about this strategy.
PDI and PTY's main exposure risks
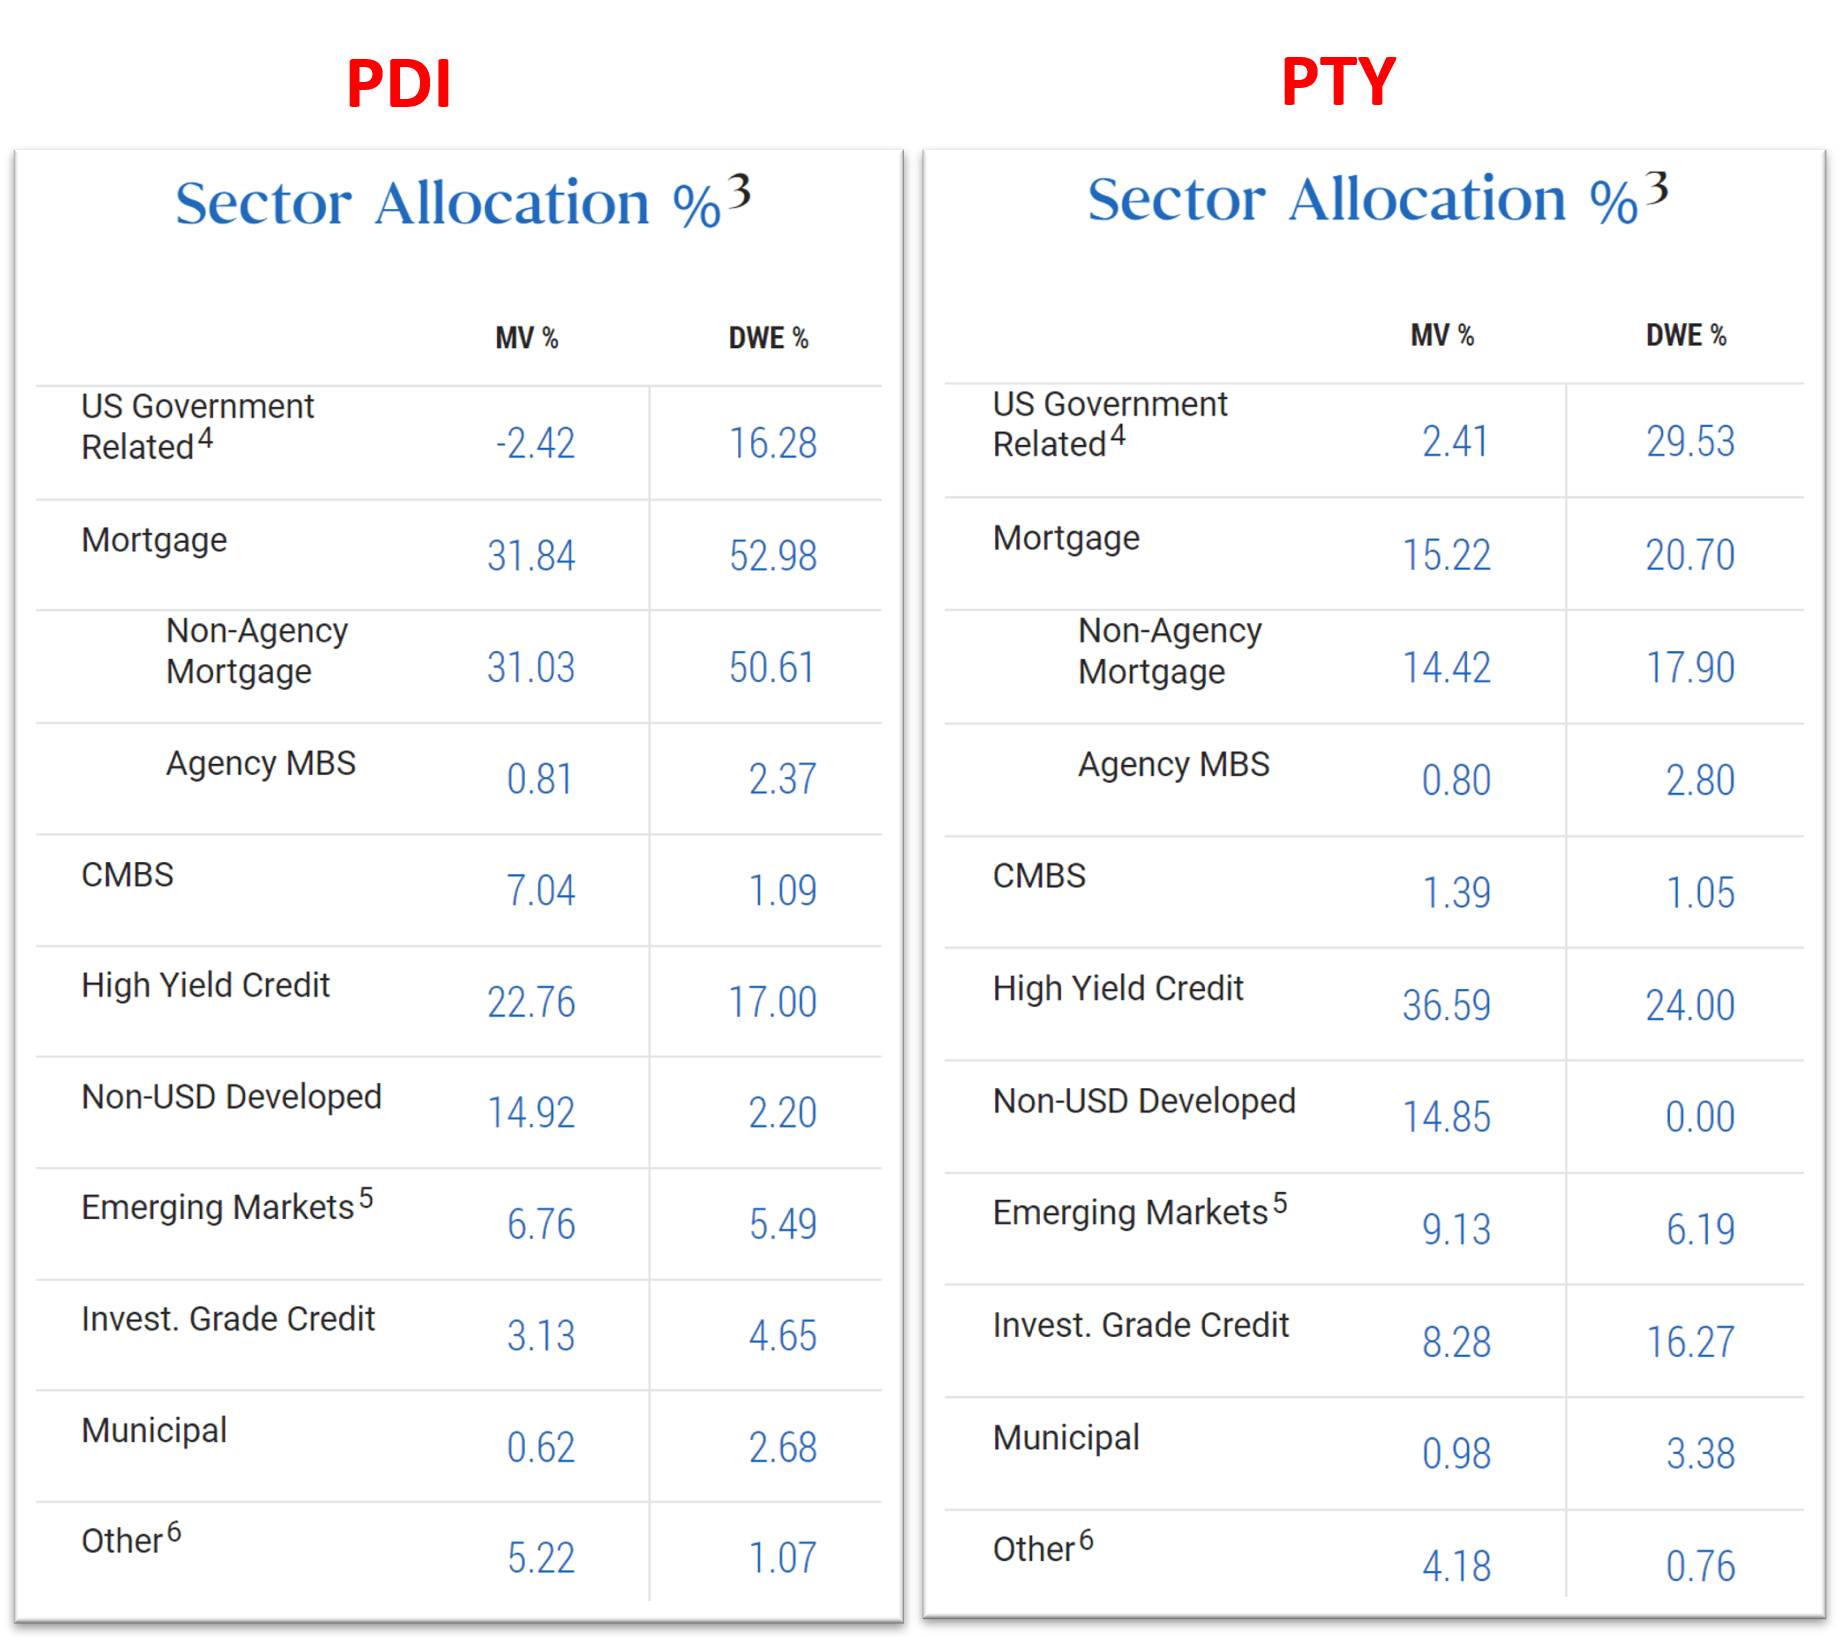
Looking a bit closer, the chart below shows their more detailed sector exposures. In terms of industry exposure, both funds hold their largest allocations in health care, banks, energy, et al. And in terms of sector exposure, both funds' top exposures are mortgage and high-yield credit as seen. To wit, PDI has 31.8% of its total assets invested in Mortgage and 22.8% in high-yield credit, totaling 54.6%, more than 1/2. The picture for PTY is similar. PTY has 15.2% of its total assets invested in Mortgage and 36.6% in high-yield credit, totaling 51.8%, again more than 1/2.
Source: PDI and PTY fund descriptions
I consider the current macroscopic conditions to be very concerning for both types of assets that PDI and PTY heavily bet on. in the remainder of this article, I will concentrate on two such of my top concerns: the inverted yield curve and the spread between the BAA and Treasury rates.
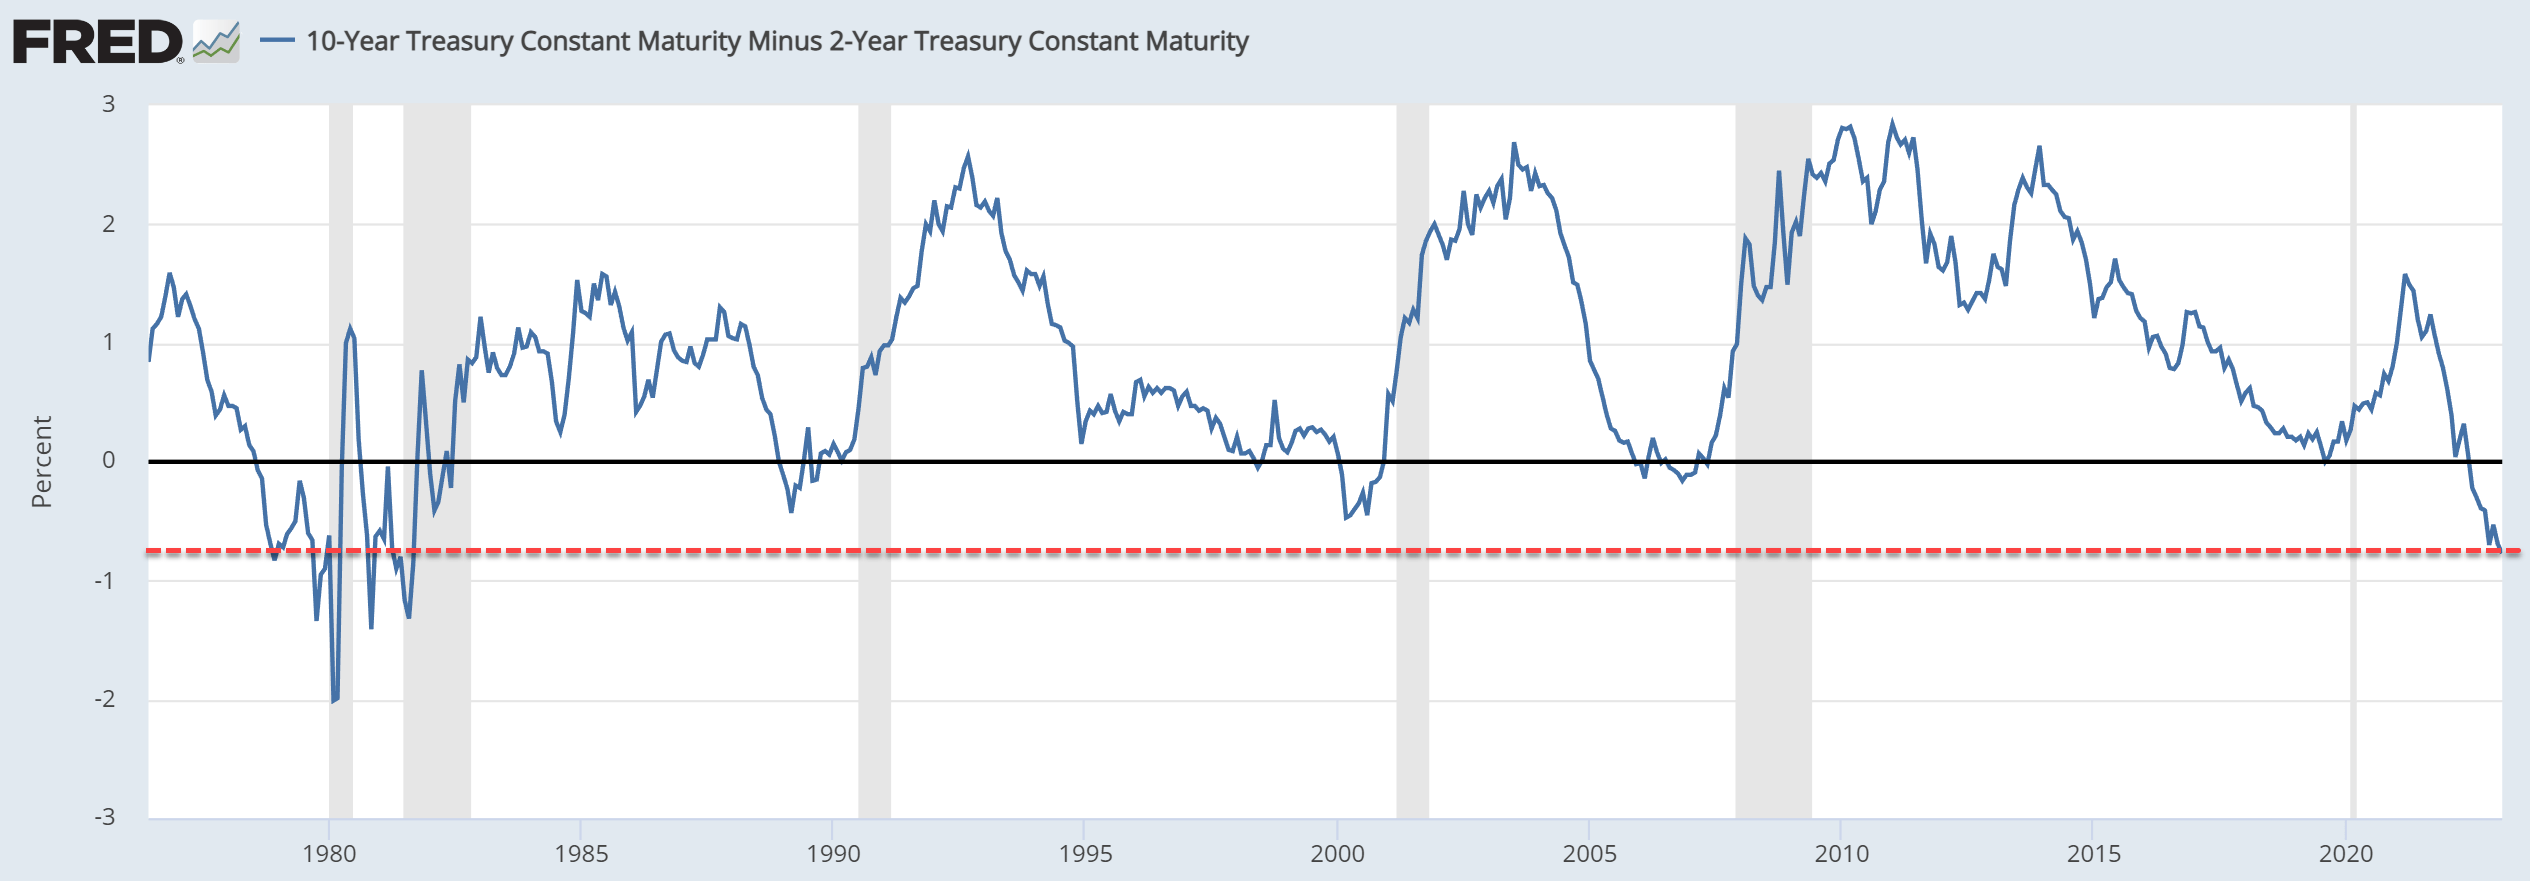
First, the inverted yield curve. The yield spread between the 10-Year Treasury Constant Maturity rates and 2-Year Treasury Constant Maturity rates currently sits at negative 0.77%, the deepest level since the 1980s as seen in the chart. As argued in an earlier article ,
… to fight the ongoing inflation, I see the short-term interest rates will need to rise to somewhere near 4% and long-term rates won't rise too higher above that either. Because ultimately, long-term treasury rates cannot rise above either long-term GDP growth rates or long-term inflation rates. As a result, the yield curve is very likely to remain inverted.
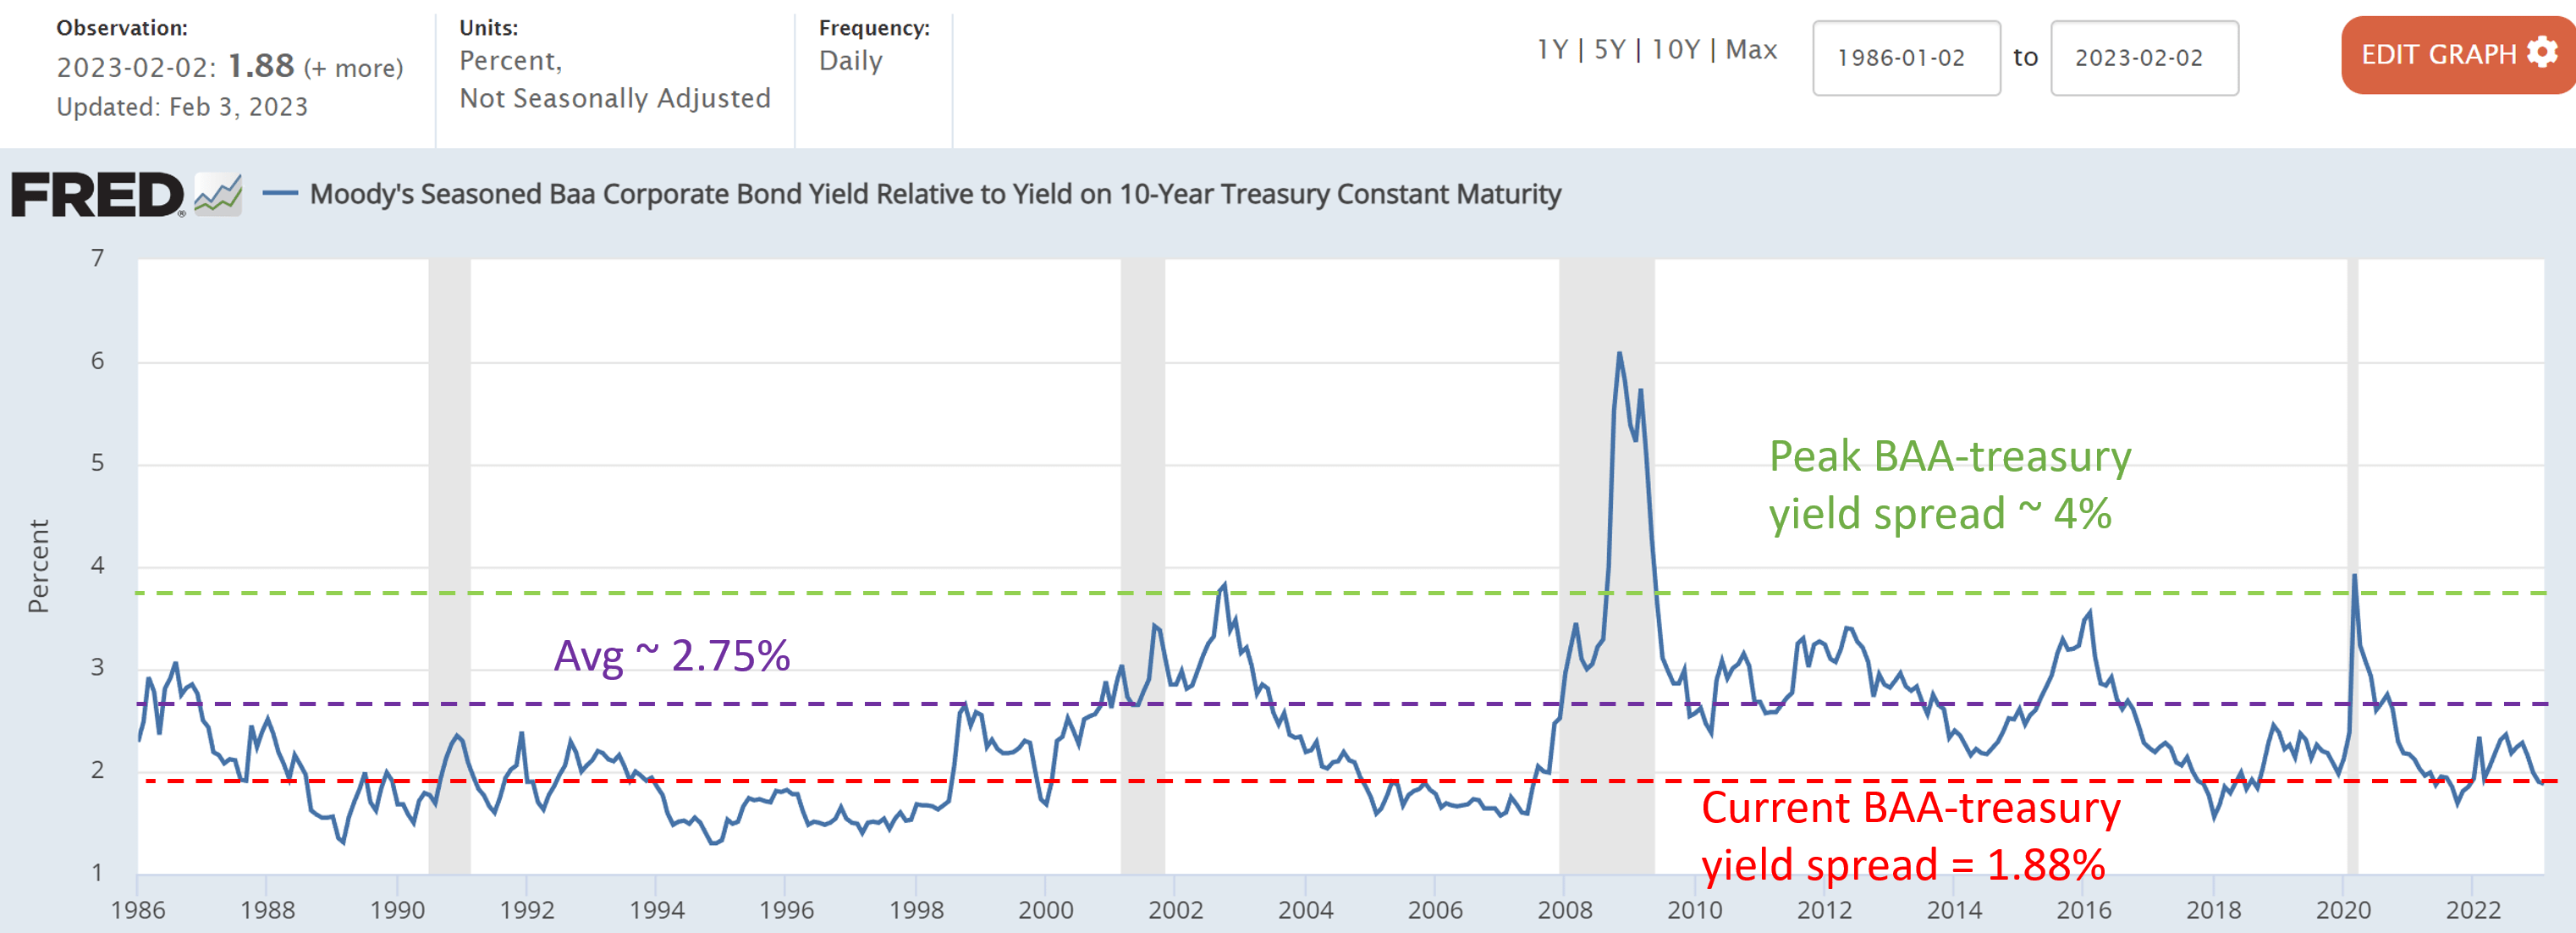
Second, the risk premium of corporate bonds. The next chart shows the yield spread between BAA bonds and risk-free interest rates, defined as the yield spread between Moody's Seasoned Baa Corporate Bonds and the 10-Year Treasury Constant Maturity rates. As seen, the spread is currently only 1.88%, toward the thinnest end of the spectrum in the past 4 decades or so. To be more specific, the yield spread has been as thick as 4% a few times in the past 4 decades and been as thin as 1.25% a few times too. And on average, the spread hovered around an average of 2.75% in the long run. The current spread of 1.88%, therefore, is not alarmingly thin. But it is substantially below the historical average and not that far from the historical troughs.
I see both charts above as strong signals for the high-risk premiums involved in mortgages and high-yield corporate bonds. And such high-risk premiums put funds such as PDI and PTY in a difficult position, at least in two ways. Firstly, these assets are more sensitive to interest rates. Both assets will likely experience significant valuation pressure if the yield curve remains inverted or triggers a recession. And secondly, even if interest rates stabilize in the 4% range as argued earlier, this would mean much higher borrowing costs compared to a few years ago for both funds. And both funds do use significant leverage as aforementioned.
Source: Author based on FRED data
PDI and PTY: Unfavorable price appreciation potential
Putting the yield aside for a moment, let's take a look at their price appreciation potential and their total return profiles.
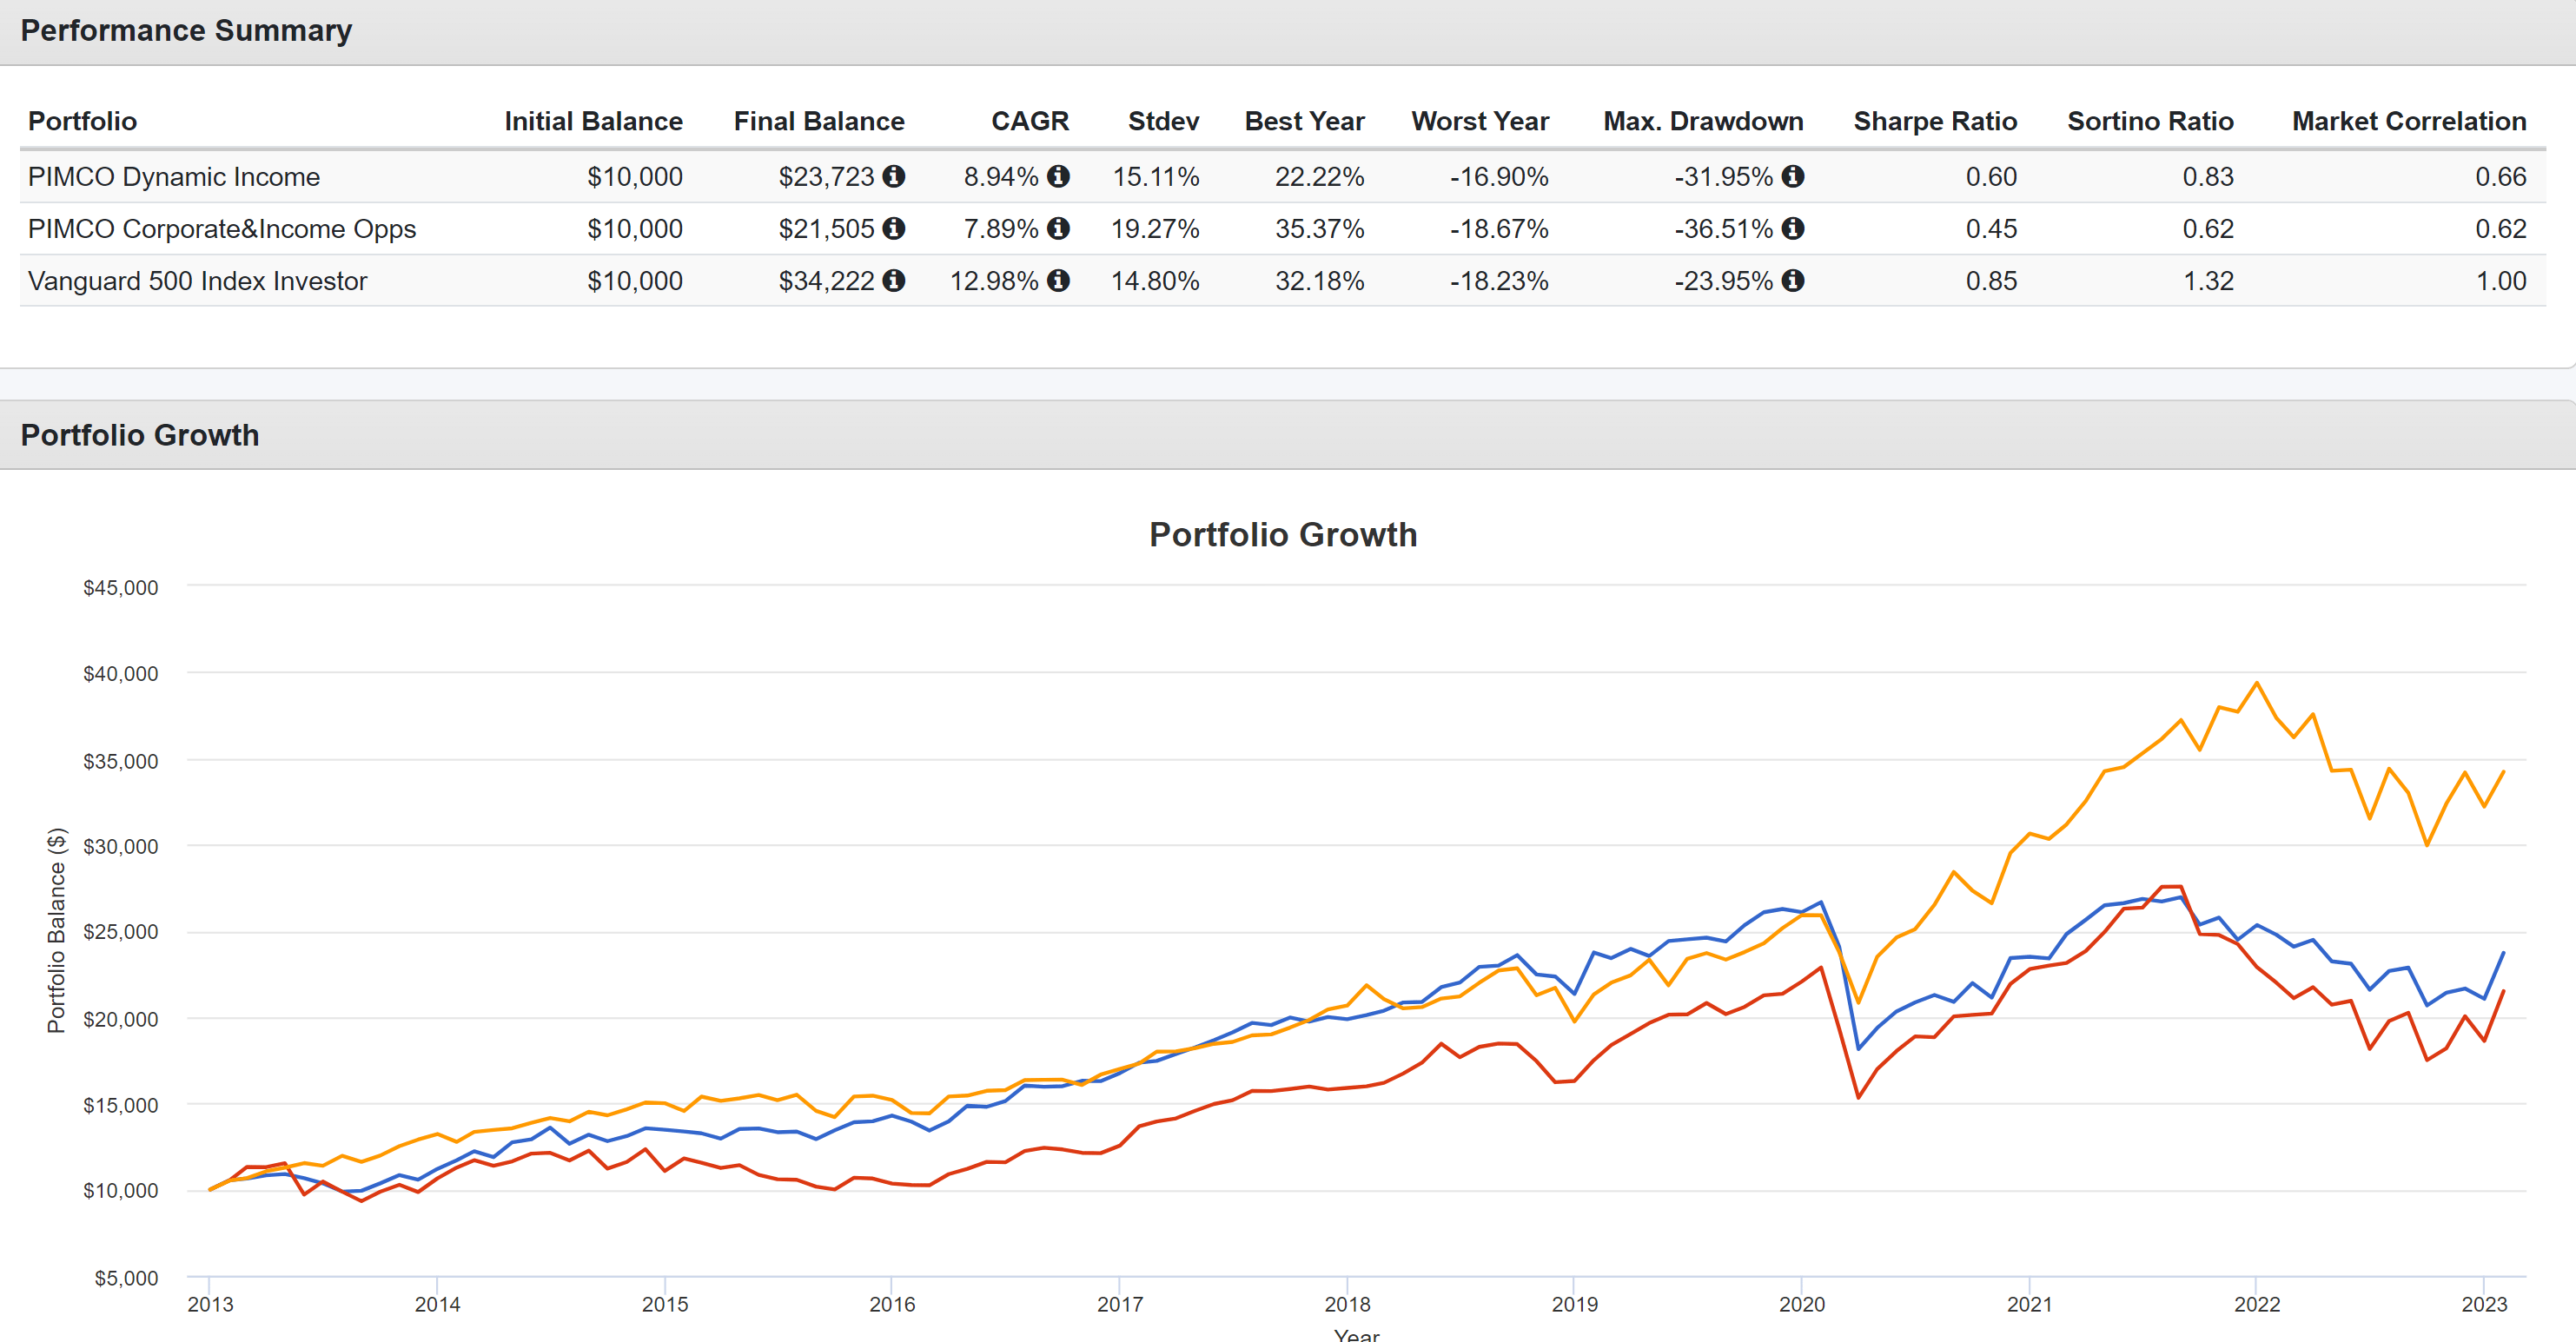
Unfortunately, historical records do not suggest PDI and PTY as the best options for price appreciation or total returns as you can see from the chart below. Of course, the evaluation of price appreciation potential always depends on the benchmark we choose for comparison purposes. And here I will compare their performance against the S&P 500, for two reasons. First, the S&P 500 is always an easy alternative to any other asset. Secondly, you may be wondering if this is an apple-to-orange comparison. After all, it is a default assumption for most investors that stocks and fixed-income securities (aka bonds) go in opposite directions. However, in the long-term, stocks and bonds are POSITIVELY correlated - as they should be (see this post for the supporting data). After all, stocks and bonds are merely the two sides of the same economic coin.
To wit, both PDI and PTY have produced decent total returns in the past since 2013, with PDI delivering a CAGR of 8.9% and PTY 7.9% of total returns. However, these returns compare unfavorably against the overall market (as represented by the Vanguard 500 Index Investor fund), which delivered a double-digit CAGR of almost 13% in this same period.
Looking forward, I see the lag likely to continue or even worsen. To start, fixed-income securities have a built-in cap on their upward potential. And bear in mind, both funds suffered the above lag despite A) their substantial use of leverages, and B) the borrowing costs have been consistently on the decline since 2013 to the historically lowest levels in 2020. Going forward, I foresee these tailwinds that both enjoyed in the past decade to either disappear or even reverse.
Other risks and final thoughts
All in all, both PDI and PTY are in a dilemma the way I see things. Their main draw is their high yield. With current yields in a range of 10%~12%, they are indeed alluring on the surface. However, I do not see these yields as sufficient to compensate for the macro risks due to the inverted yield curve, the narrow BAA-treasury yield spread, and also these funds' concentrated exposure to rate-sensitive assets.
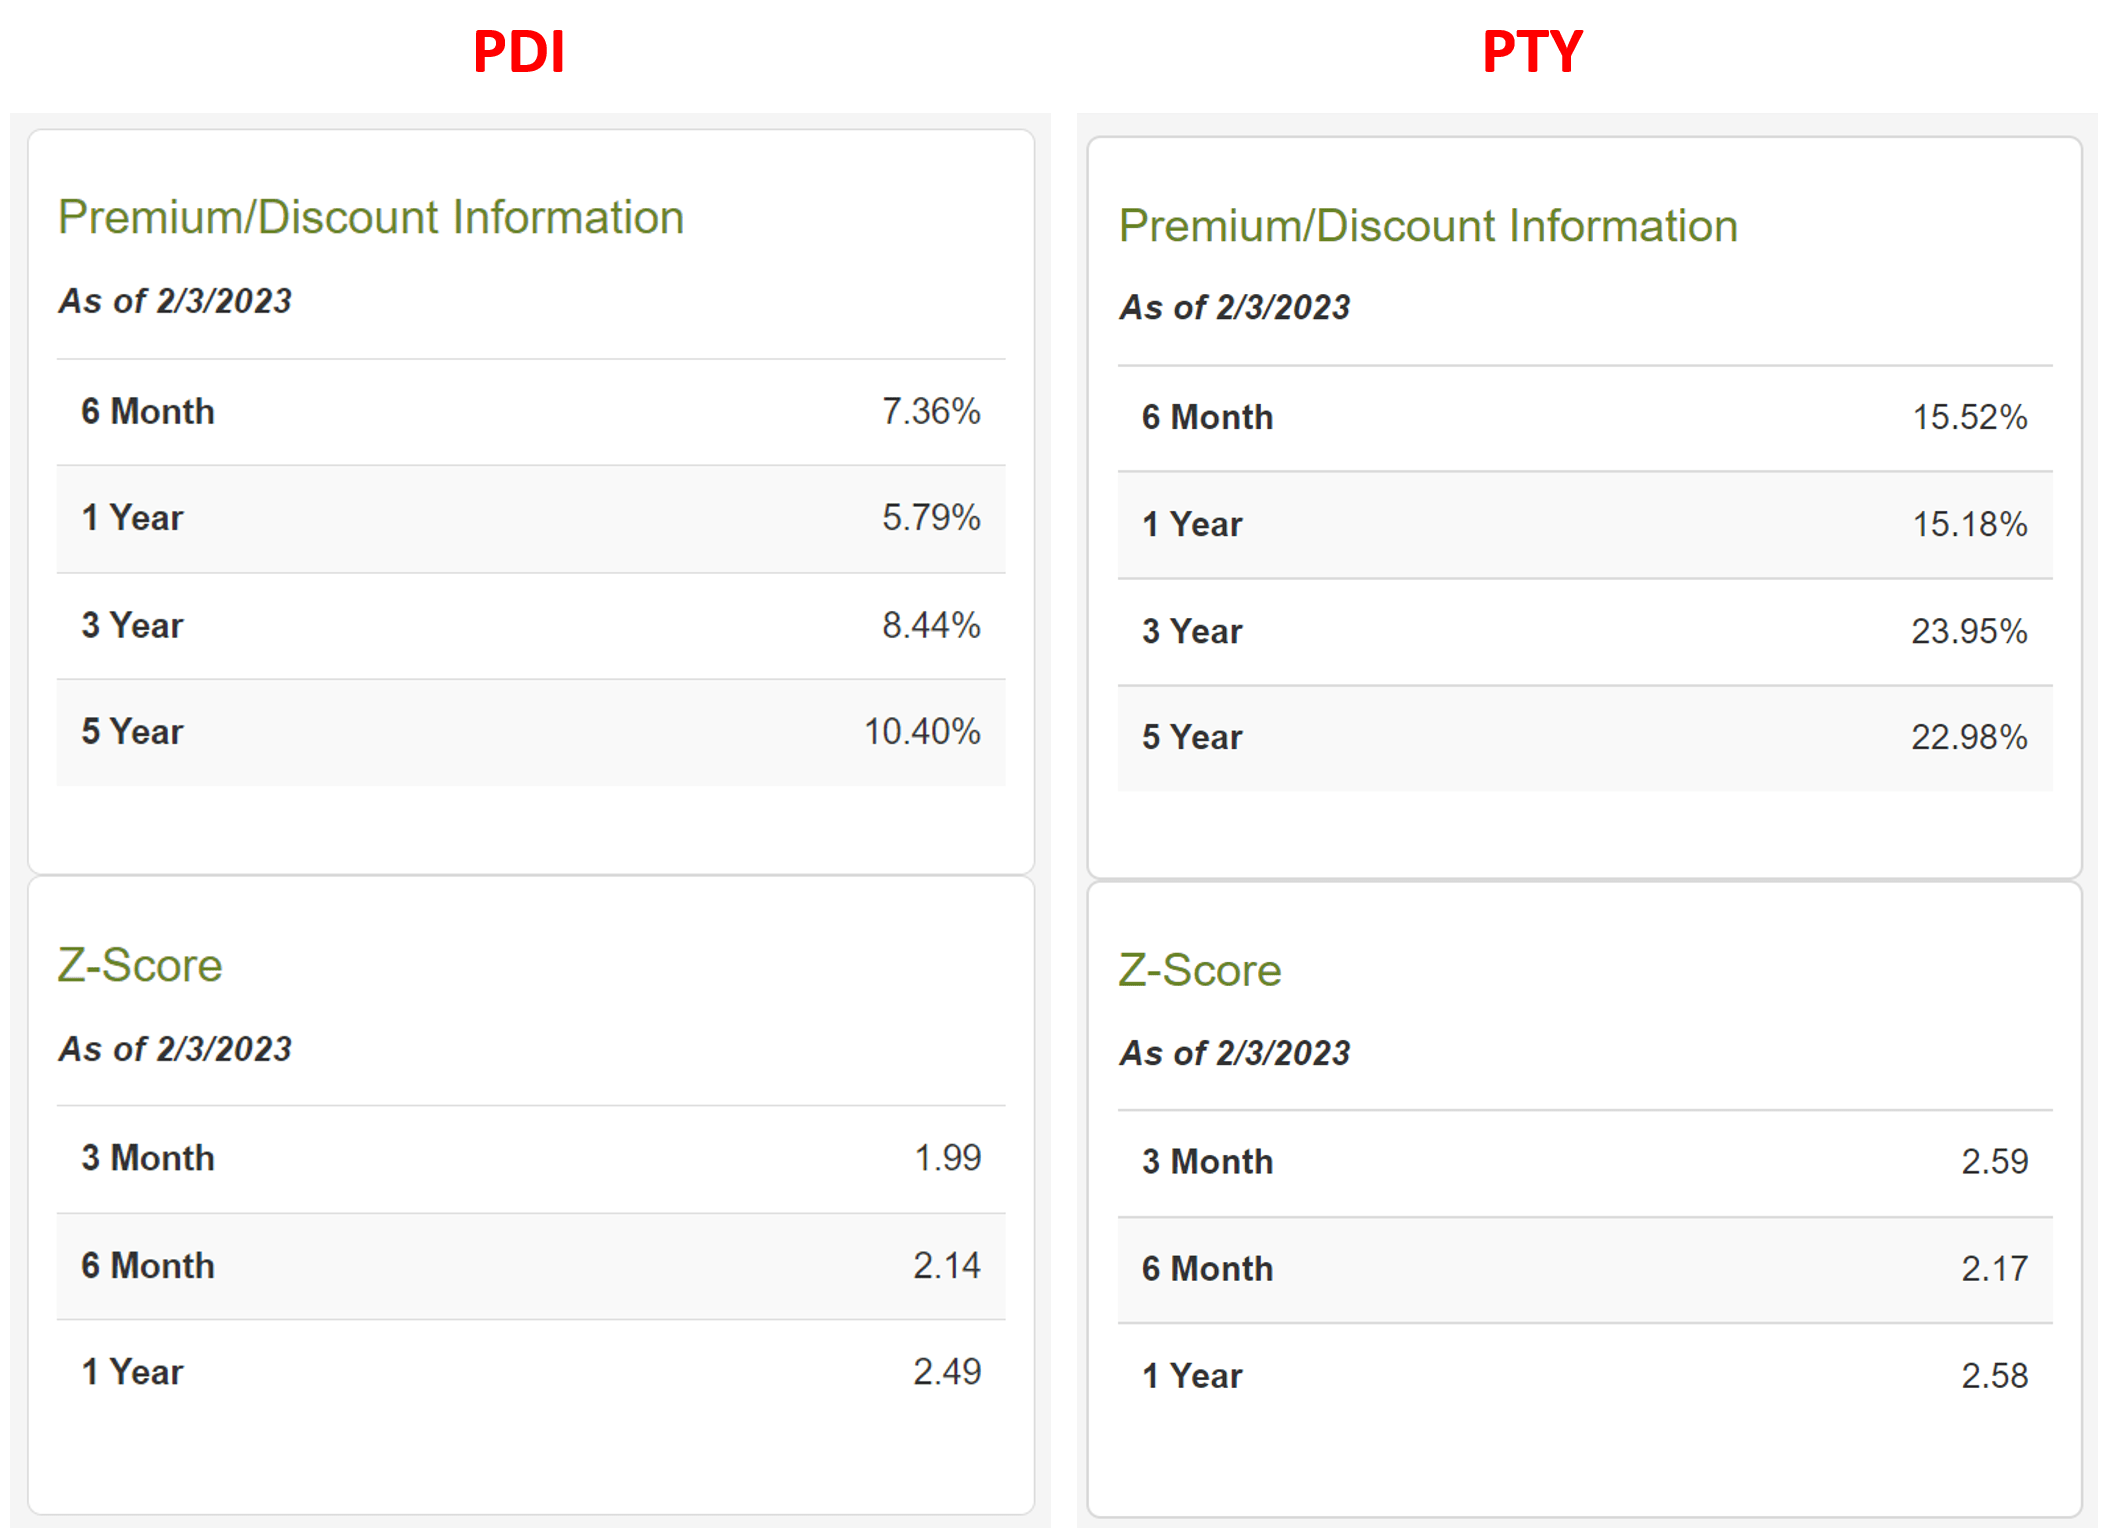
Finally, to add to all these risks, both funds are very pricey too as shown in the chart below. According to CEFConnect data, PDI is selling at a 13.76% premium above its NAV and PTY at a 24.28% premium as of this writing. Such premiums put them at the most expensive valuations in multiple years as seen from the data in the charts below.
For further details see:
PDI And PTY's Yield Predicament