PTY - PDI: The History Lesson
2023-08-21 17:30:11 ET
Summary
- Income investors have good reasons to be attracted to the PIMCO Dynamic Income Fund.
- It provides 14%+ TTM yield currently, paid monthly.
- However, I want to caution potential investors about the risks and argue that its total return is likely to lag other simple models or even be negative in the coming years.
- With its particular exposures and capital structure, I see the inverted yield curve and borrowing costs are the dominating force ahead.
Investment thesis
Income investors have good reasons to be attracted to the PIMCO Dynamic Income Fund (PDI). PDI currently provides a 14%+ dividend yield, and the payouts were made monthly. This is indeed a combination of two very appealing traits for income seekers when treasury rates are at the ~4% level and the stock market is near a historical peak valuation.
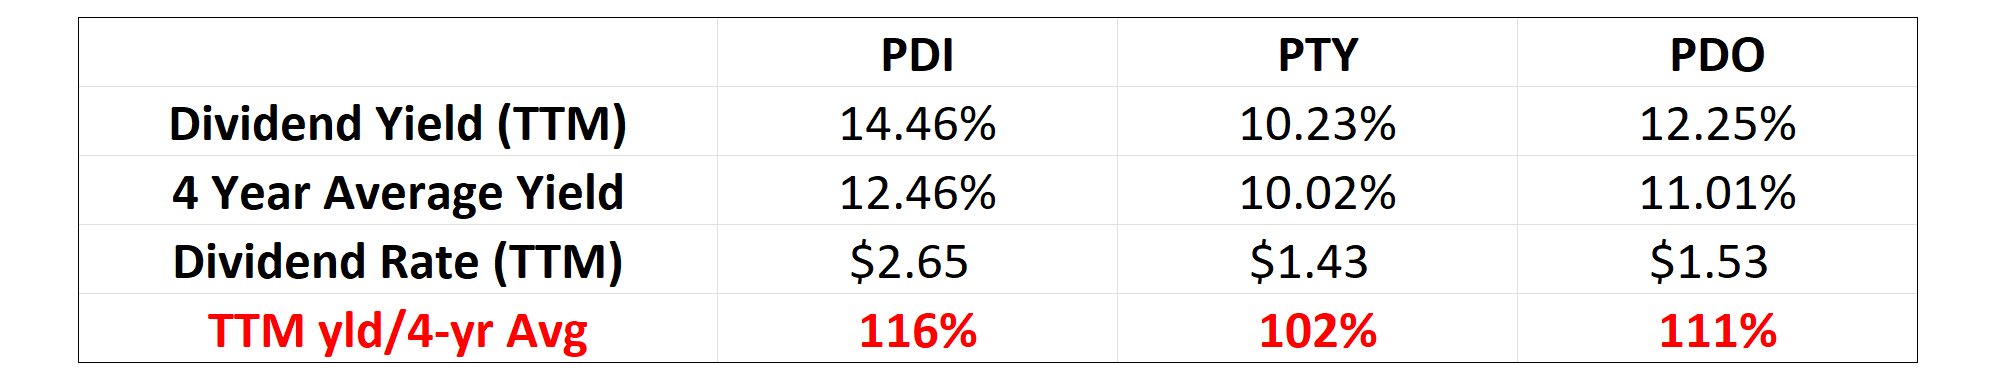
In fact, PDI’s yield is not only attractive when compared to treasury rates or stock market yield, but also when compared to other high-yield funds. The table below compares its yield to two of its sister funds, the PIMCO Corporate and Income Opportunity Fund ( PTY ) and the PIMCO Dynamic Income Opportunities Fund (PDO). As seen, its current TTM yield of 14.46% is about 16% higher than its 4-year average of 12.46%, indicating a sizable valuation discount compared to both PTY and PDO, whose current yields are about 2% and 11% above their 4-year average.
Source: Author based on Seeking Alpha data
After reviewing their positives, my main thesis here is to caution potential readers about the risks behind such mouthwatering yields. And in a nutshell, my thesis is that the current yield is not sufficient to compensate for the underlying risks given the ongoing macroscopic conditions. I will explain why both historical data and first-principle analysis led me to this conclusion. In the remainder of this article, I will argue that with its particular exposures (to be detailed in the next section), the fund’s total return is likely to lag a simple 60-40 model or even be negative in the coming years.
PDI: quick intro
PDI is a popular CEF among income-oriented investors, and plenty of other Seeking Alpha authors have detailed various aspects of its basic information.
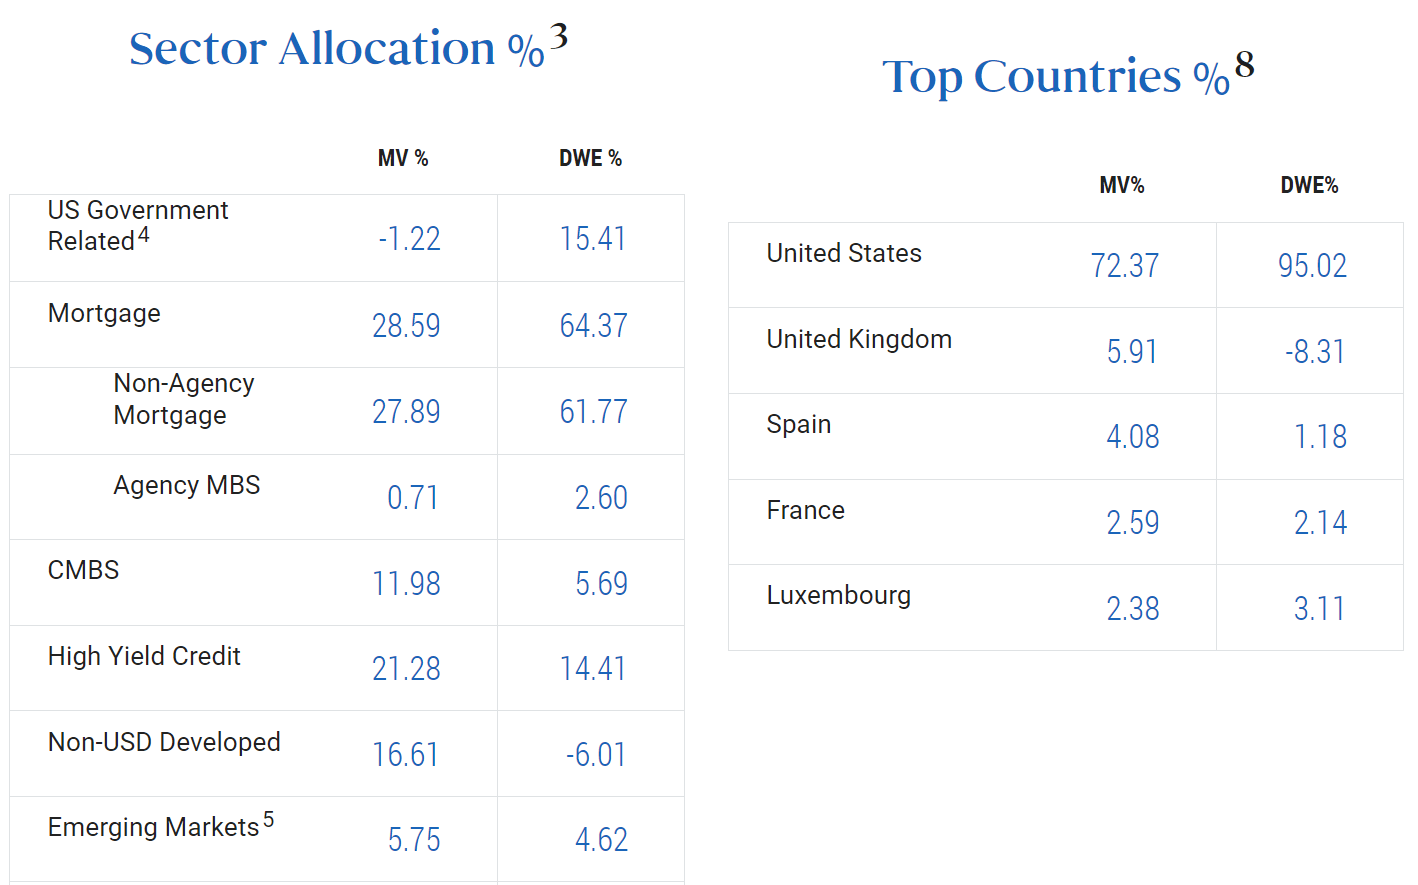
Thus, here I will just focus on the part that is most relevant to the thesis of this article - its sector allocation. As seen in the next chart (left panel), PDI’s top exposures are mortgage and high-yield credit. To wit, by market valuation, PDI has 28%+ of its total assets invested in Mortgage and most of them are in non-agency mortgages. It also has more than 21% in high-yield credit. In terms of duration-weighted exposure, its exposure to non-agency mortgages (almost 62%, i.e., about two-thirds) simply dominates the allocation picture. In the right panel, you can see that its exposure is dominated by the U.S. – more than 72% in market value and more than 95% when duration weighted. As a result, in the remainder of the article, I feel it is well justified to use the economic information in the U.S.
And let’s see what the current U.S. economic conditions are and how would they impact the sectors that PDI is heavily exposed.
The history lesson
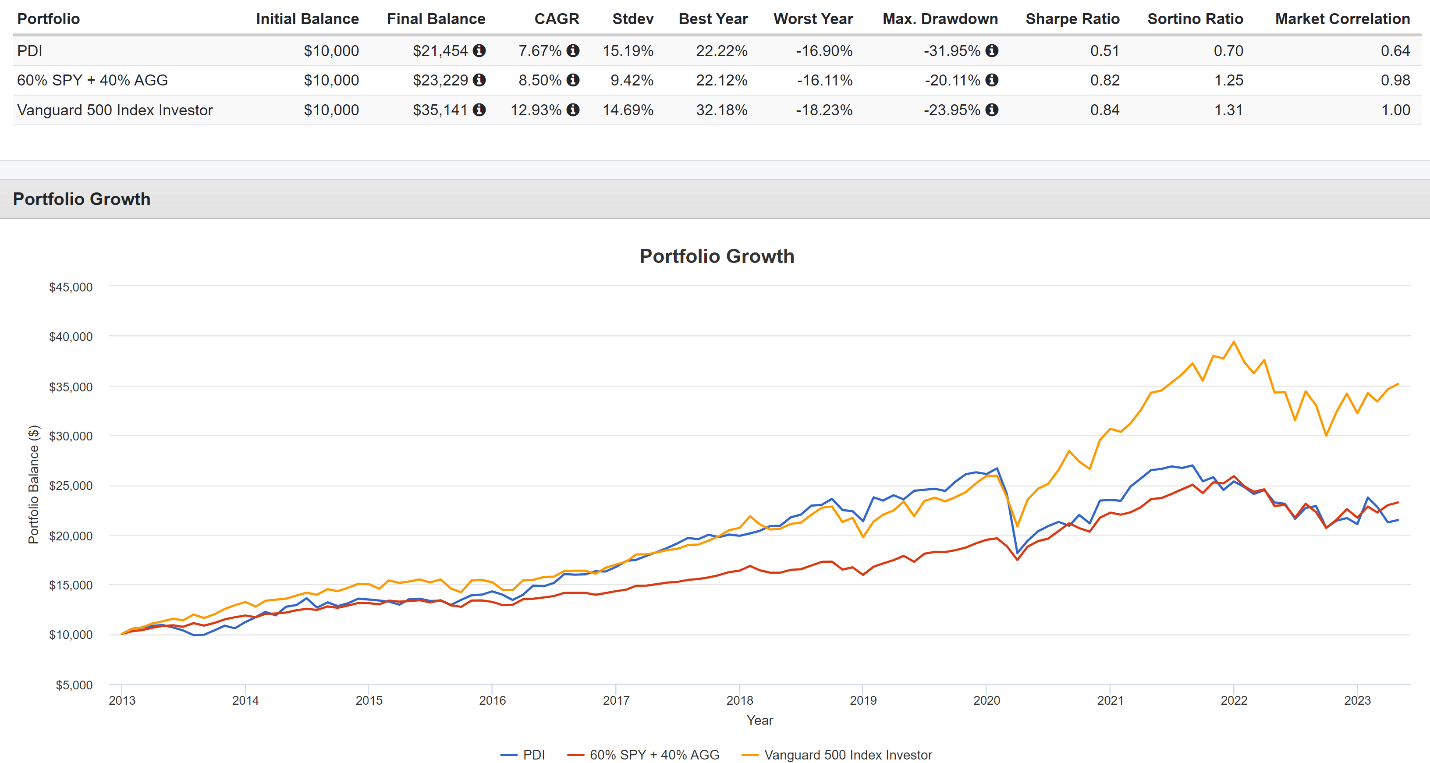
As seen in the chart below, historical performance is not in favor of PDI in the long term. In the past ~10 years, the fund admittedly provided a positive return at an annual rate of 7.6%. But such a performance lagged the overall market (S&P returned almost 13% annually) severely.
Of course, an argument can always be made that funds like PDI are not meant to be benchmarked by the S&P 500. They are intended to generate income (and indeed, most of its 7.6% return came from income generation. However, the argument is debatable. First, you can always realize some of the returns from a non-income fund (such as the S&P 500) to generate income. After all, total return is total return, and it does not matter if it comes from dividend payouts or capital gains.
And second, you can see that PDI also underperformed a simple 60-40 model (which delivered about 8.5% annual return). And also bear in mind that the superior return from the 60-40 model also came with much lower risks than PDI in terms of standard deviation, worst drawdowns, and worst year performance.
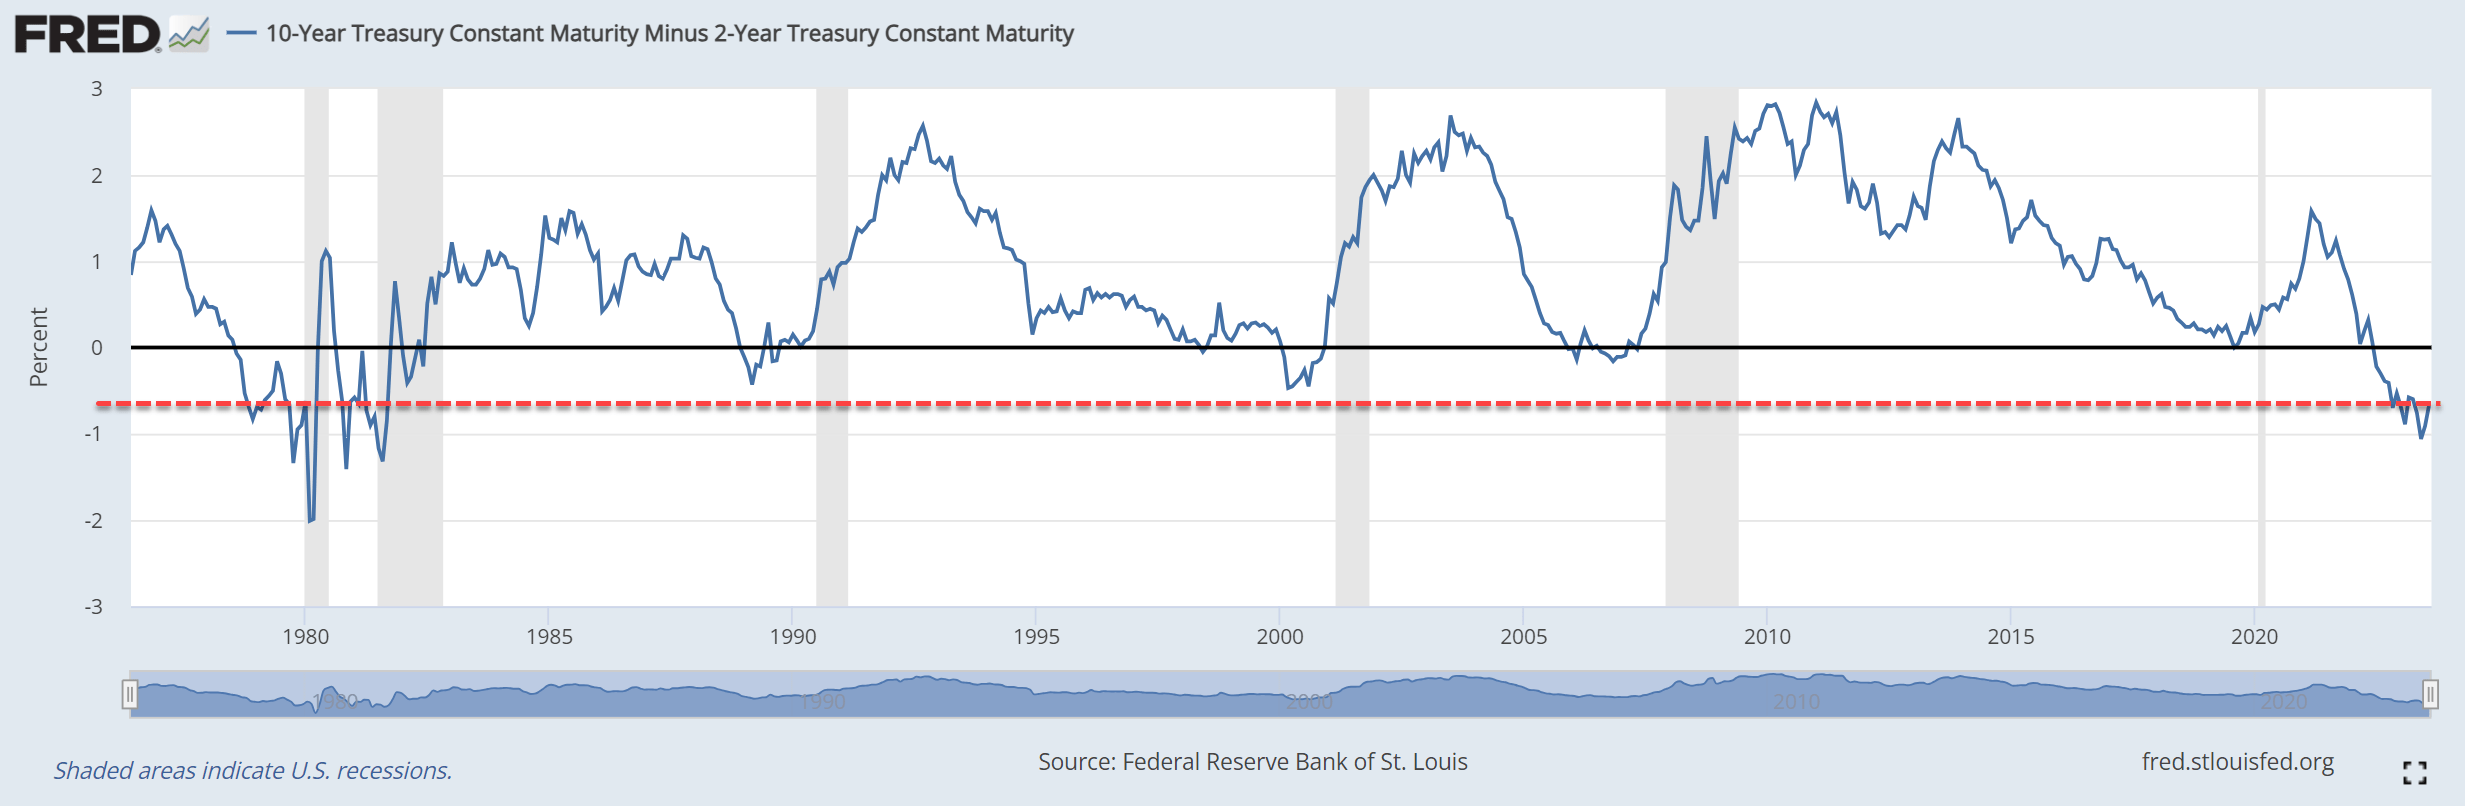
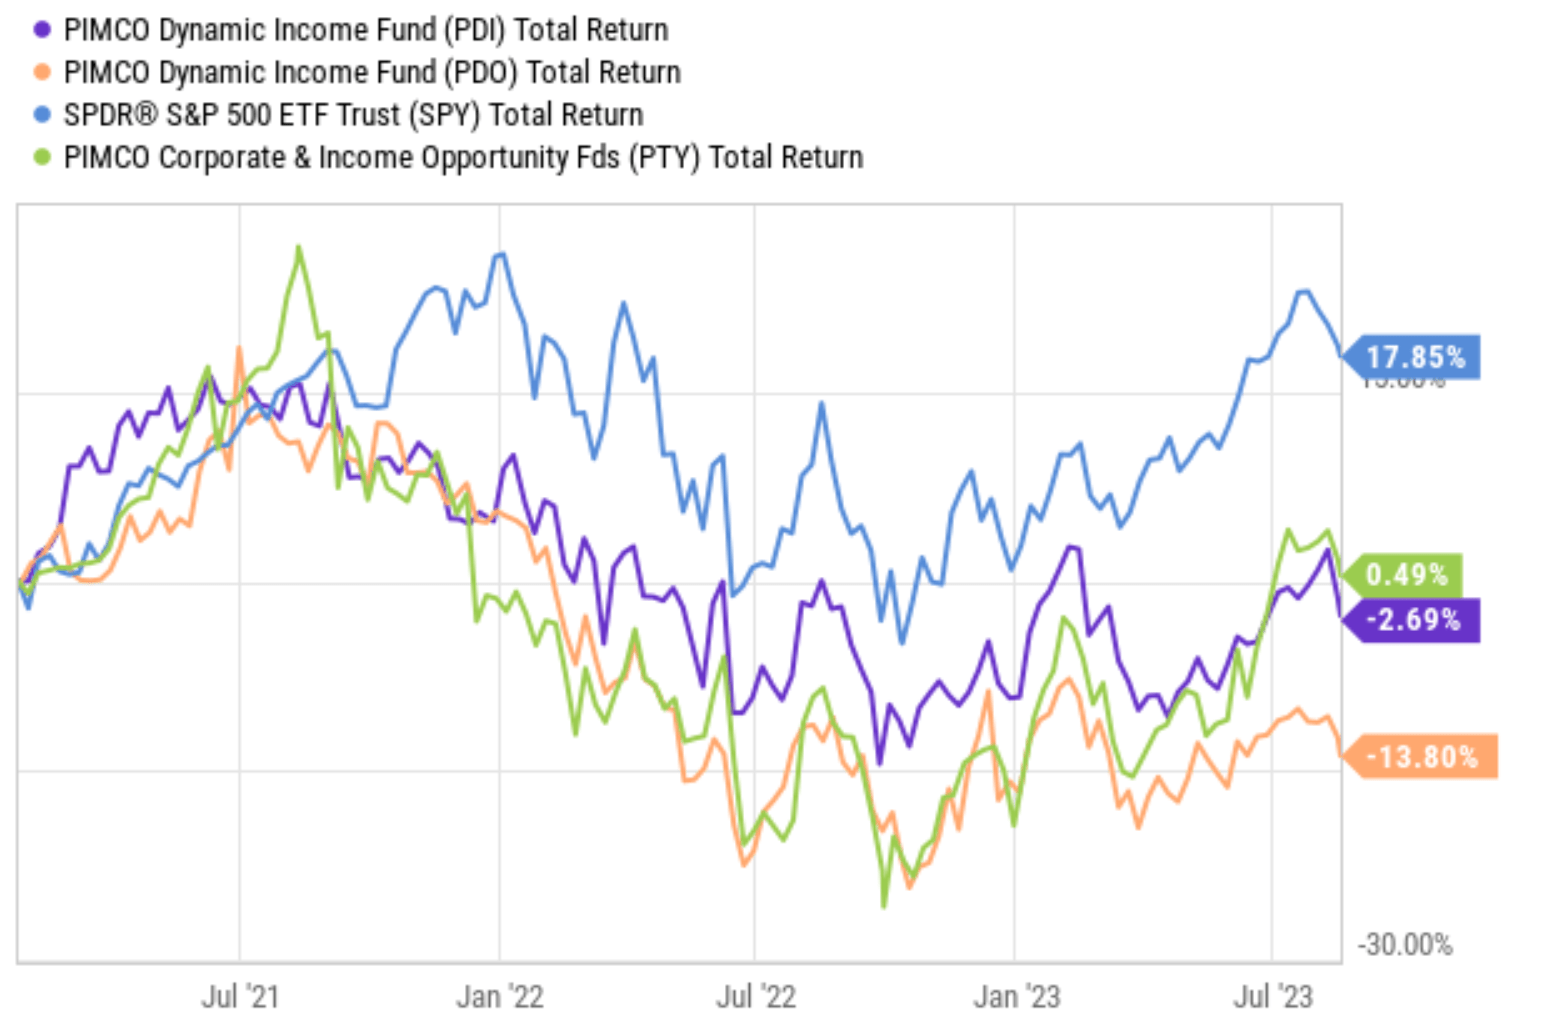
Looking ahead, I see good odds for such lag to persist or even worsen in the years to come. The relevance of such historical data is threefold for me under today’s conditions. First, the yield curve is not only inverted, but inverted to a degree that is the worst in more than 4 decades. As seen in the chart below, the current spread between 10-Year Treasury Constant Maturity and 2-Year Treasury Constant Maturity sits at negative 0.66%, the lowest level since the 1980s. As detailed in our other articles , the non-agency mortgage sector is being and will continue to be pressured by such an inverted yield curve. And as such, I view this first factor as a fundamental force against PDI’s total performance in the years to come. And in the second chart below, you can see that the lag of PDI and its sister funds are especially severe in the past 2~3 years since the rate hikes and the yield curve inversion started.
Source: FRED data Source: Seeking Alpha data
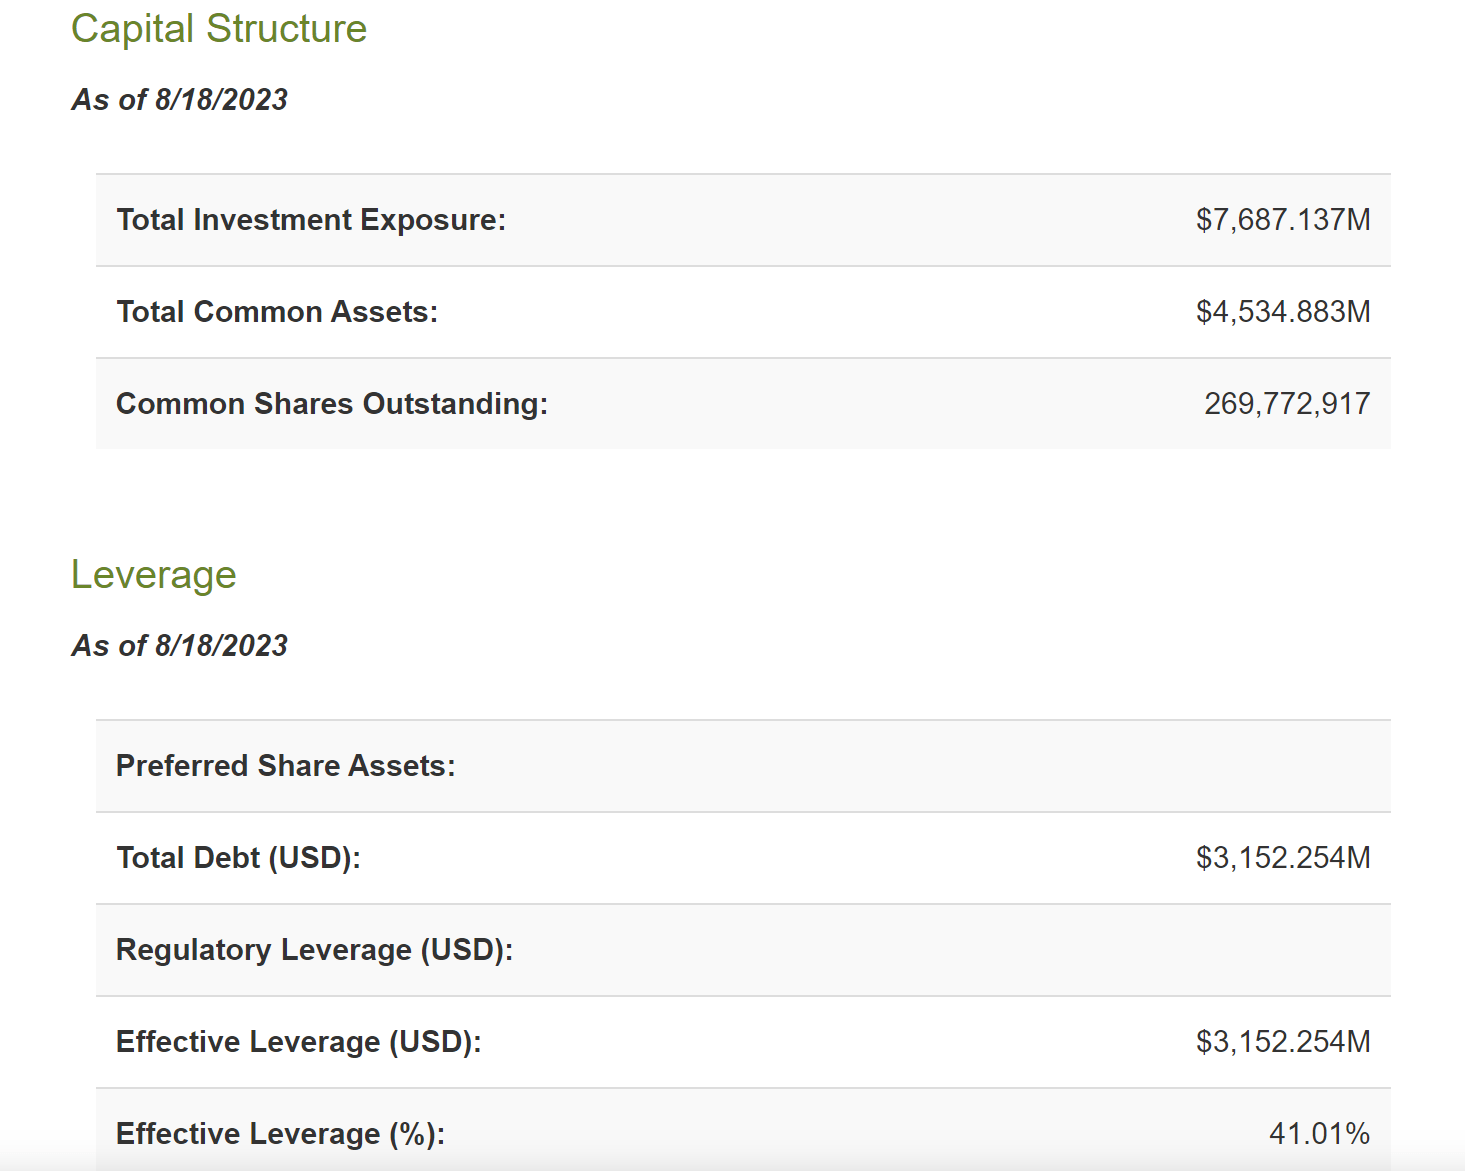
Second, the fund utilizes substantial leverage to achieve its income-generation goals. And under current conditions, its borrowing costs are much higher than in the past, and such high borrowing costs are likely to persist. As shown in the next chart, its total investment exposure is about $7,687M, consisting of $4,534M of common assets and $3,152M of total debt. These numbers translate into an effective leverage ratio of about 41%, a quite substantial amount of leverage.
Other risks and final thoughts
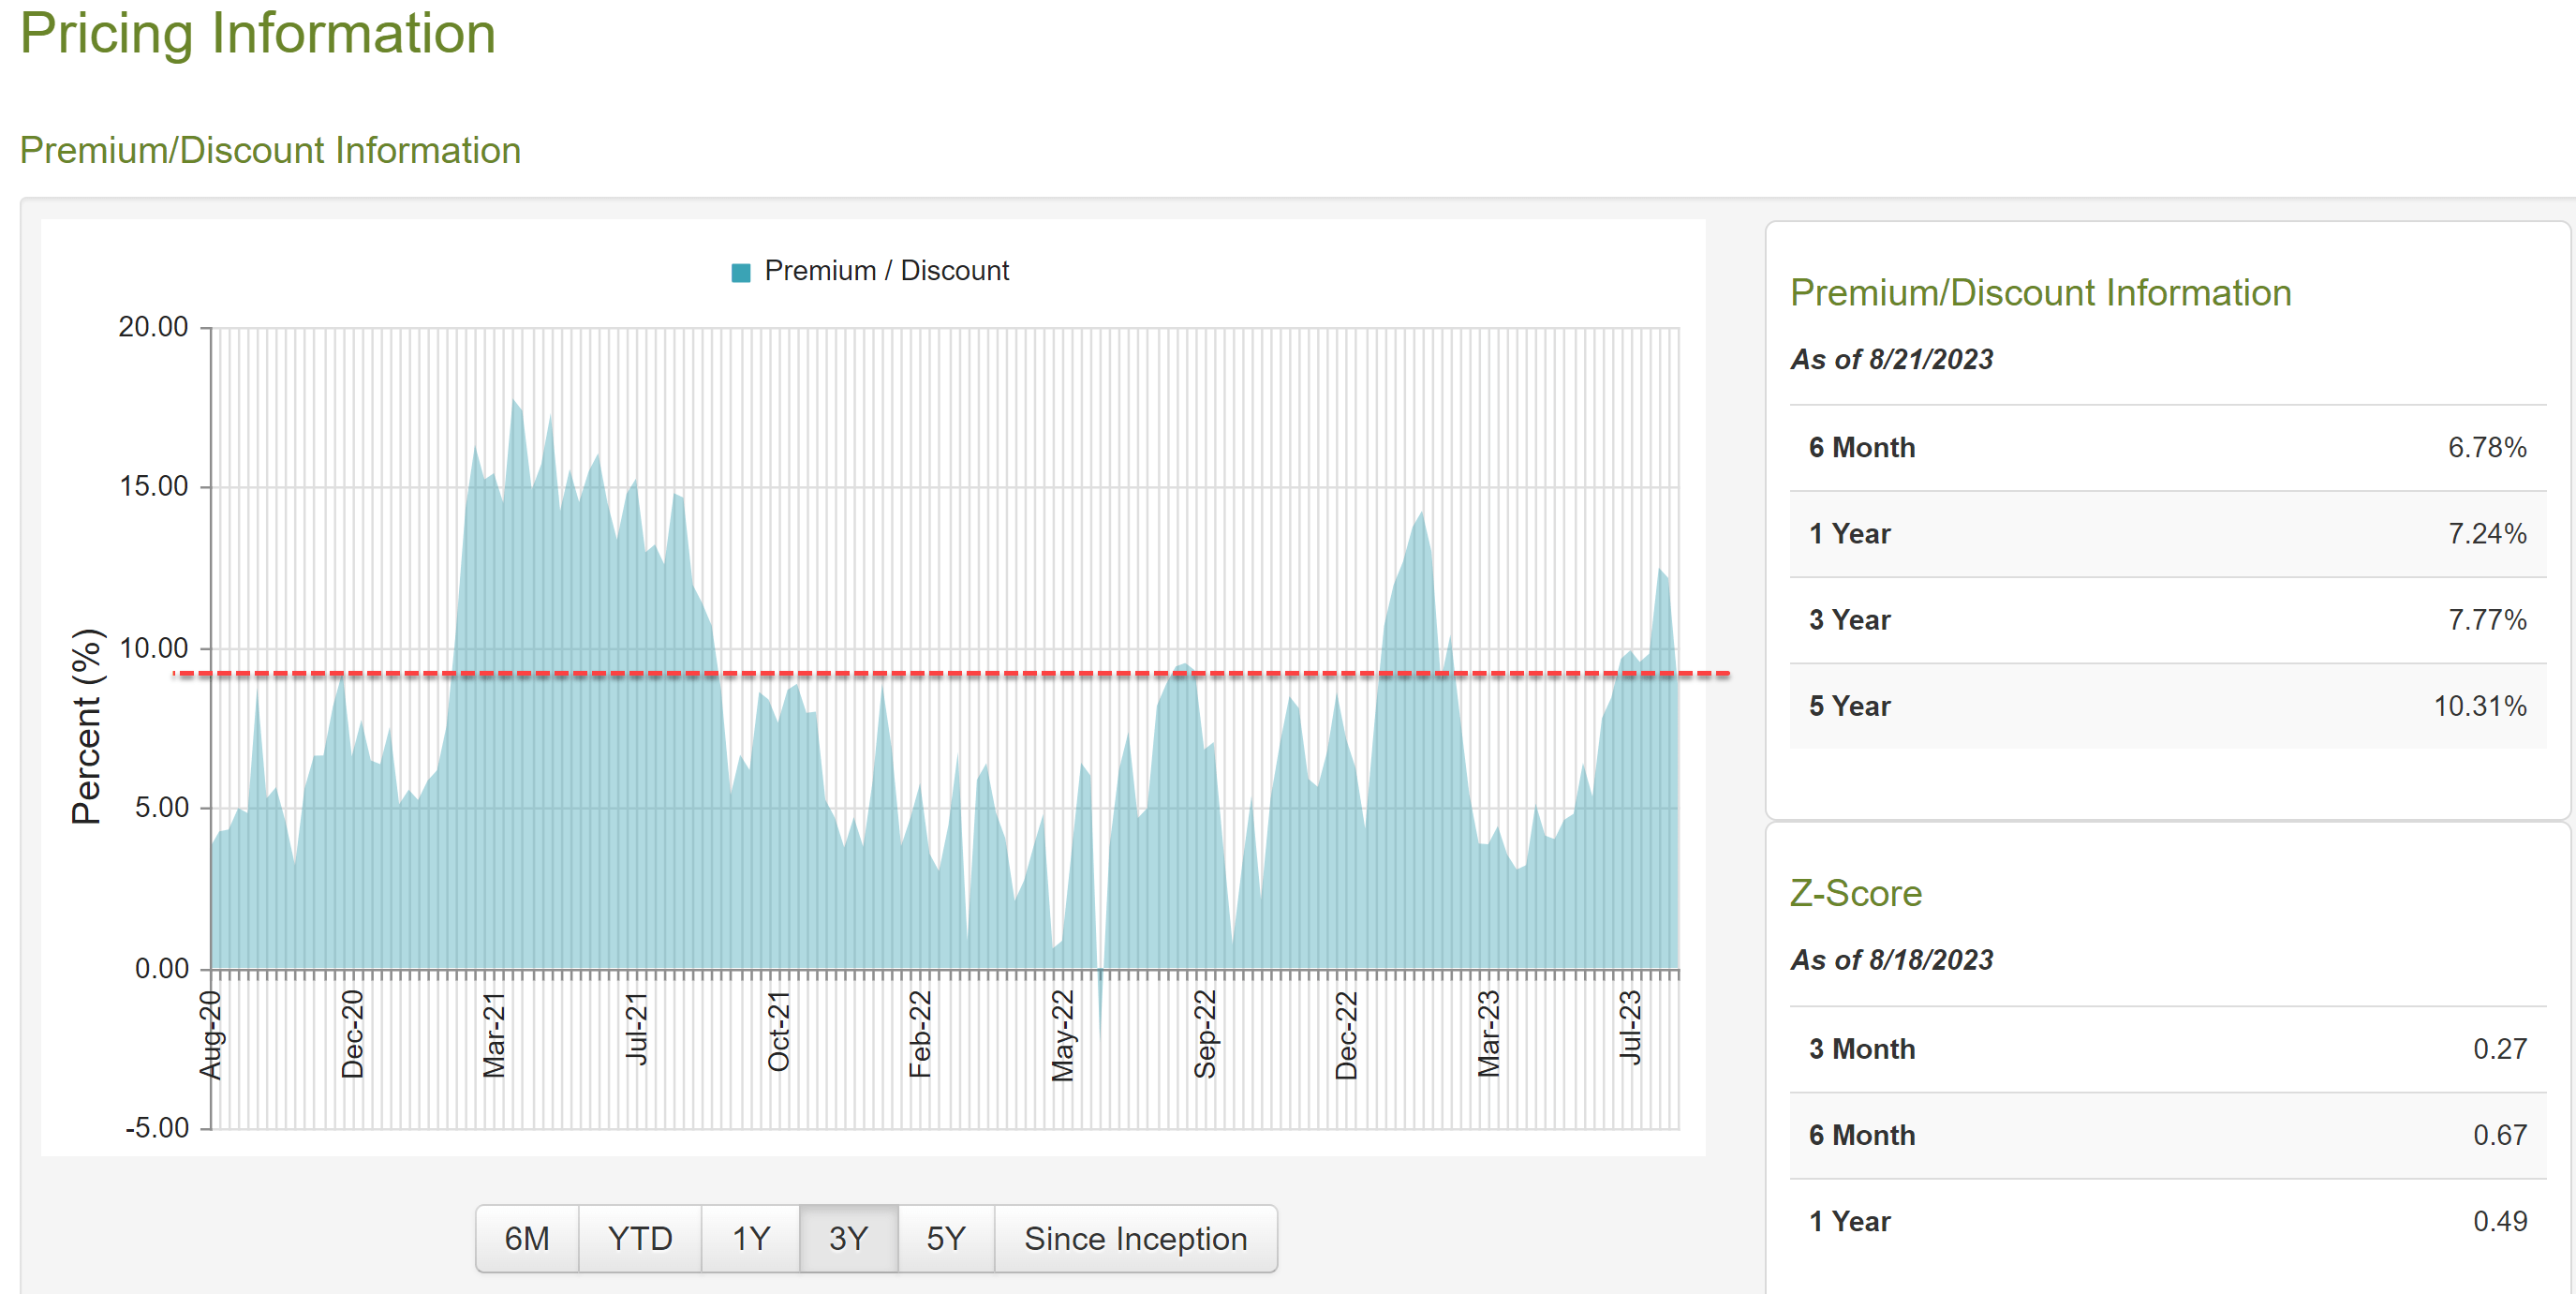
The PDI funds offer both upside and downside risks. To recap, the upside risks are its high dividend and monthly payouts. With a ~14%+ TTM dividend yield, the fund accomplishes its income-generation goal without a doubt. And furthermore, its current yield is also higher than both its historical track record and its sister funds by a good margin, suggesting some valuation discount. However, the fund faces several key fundamental headwinds, as detailed above. Moreover, the valuation discount implied by its dividend yield is not totally clear to me and other metrics send mixed signals. As seen in the chart below, by its premium/discount Z-score, the fund is currently trading at a premium of almost 9% above its historical average by a good amount. Its premium Z-score is a positive 0.67 on a 6-month basis and 0.49 on a one-year basis.
All told, I view the headwinds created by the macroscopic conditions to be the dominating force in the near future. As mentioned upfront, I don’t see the yield as enough to compensate for these risks. Thx for reading and look forward to your comments!
For further details see:
PDI: The History Lesson