PEN - Penumbra: Consolidation Does Nothing To Change Long-Term Thesis Reiterate Buy
2023-09-01 16:00:00 ET
Summary
- Shares of Penumbra, Inc. have sold off sharply, but have started to recover after a 4-week base.
- Q2 FY'23 results show sales growth and a return of operating leverage, with management raising guidance for the full year.
- The stock is pricey no doubt, but there are multiple inflection points to consider in owning PEN.
- Net-net, reiterate buy.
Investment briefing
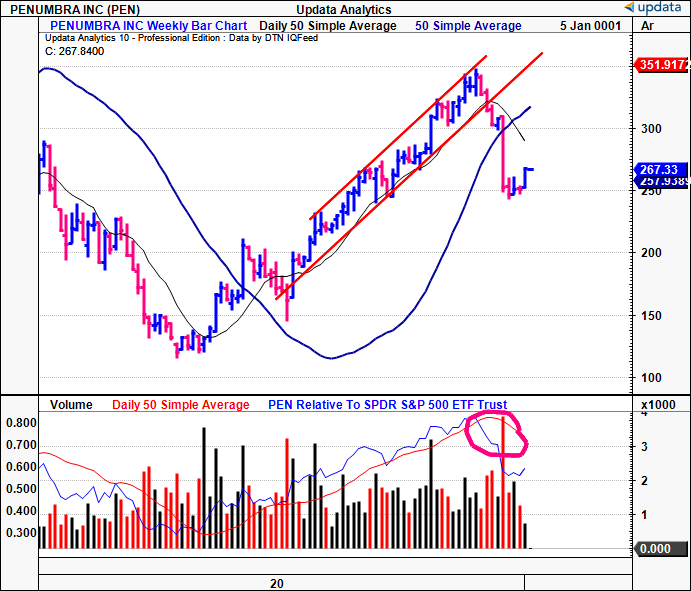
Shares of Penumbra, Inc. ( PEN ) sold off sharply after the June publication and now sell ~20% off their previous highs. Investors swiftly repriced the stock as we rolled into H2 FY'23, but it looks to have caught a bid at current ranges and has started to curl higher after basing up for ~4 weeks.
Figure 1.
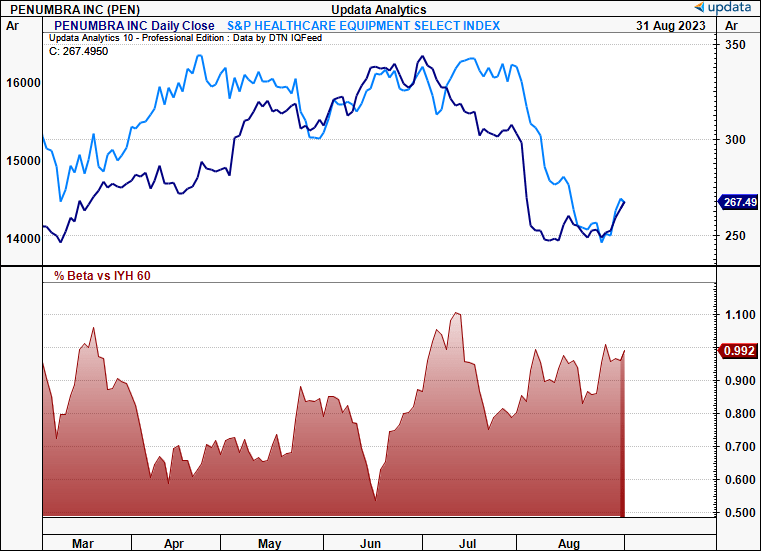
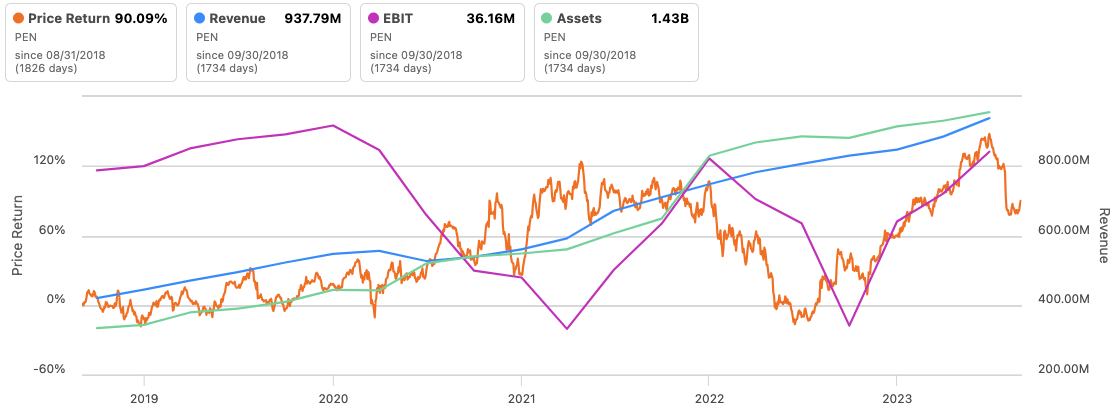
There are many potential explanations for the selloff. The stock persistently sells at exorbitant multiples, and these may have got a little too frothy—even for PEN's equity stock's standards. Secondly, this is a high-beta name with equally high correlation to healthcare indices. The broad healthcare basket also sold off sharply into H2, and high-beta names suffered as a result. Figure 1a illustrates both of these factors for PEN in relation to the S&P 500 healthcare equipment index from March–August. Critically:
- The rolling daily beta is regularly at or >1.0, demonstrating its sensitivity to changes in the index. A 1-point change downwards would cause a >1pt change to the downside in PEN's equity stock, in this instance.
- The correlations are strikingly similar. Especially from June, during the selloff. You're looking at correlations of almost 1.0 as well, almost perfect correlation (statistical analysis confirms the same, which is represented graphically via the price lines below).
Hence it wasn't totally surprising to see PEN reprice to its current levels. What's important is that 1) it's caught a bid after the 4-week base, and 2) its most recent numbers corroborate the robust fundamentals I've rhapsodized at infinitum on this channel since 2020. The critical changes are, updated fundamentals and FY'23 guidance, and additional factors on the company's gross profitability. What hasn't changed is my original valuation of $388/share, which I've reinstated here today. This report will discuss all these factors in greater detail and link this back to the broader thesis. Net-net, reiterate buy.
Figure 1a.
Critical investment updates—earnings, gross profitability
1. Unpacking Q2 FY'23—sales growth, operating leverage
PEN put up $261.5mm in Q2 revenues, up 25.5% YoY on core EBITDA of $20.4mm, up >250% YoY. The majority of sales were generated domestically, accounting for 71.4% of the top line, with the remaining 28.6% obtained from its international markets. U.S. sales produced a growth rate of 32%, while international sales grew by 11.7%. It pulled this to gross of 63.8%, a compression of ~50bps YoY. The contraction was due to startup costs for its Lightning segment incurred in Q1 of this year. More on gross profitability a bit later.
As a result of the H1 FY'23 momentum, management revised guidance higher for the full year, projecting $1.05Bn—$1.07Bn. This calls for top-line growth of 24%—26% over FY'22. The company also expects upsides to both gross and adj. operating margins during H2 as well. It is eyeing a long-term gross of ~70% within the next couple of years.
As the divisional highlights, the following takeouts are relevant:
- Momentum was observed in the U.S. vascular thrombectomy segment, coupled with incremental growth in neurothrombectomy across all regions.
- The vascular business garnered $152.7mm and grew 23.6% YoY. Growth was underscored by a 50% YoY surge in U.S. thrombectomy sales, which drove the bulk of upside during the quarter. This is in contrast with the rest of the vascular portfolio.
- PEN did $108.8mm of business in its neuro segment, a growth of 28.3% YoT. Critically, management alluded to the successful introduction of new products in the U.S., Europe, and APAC as the major growth lever here.
Walking through the operating numbers from Q2 FY'22–'23, there are many positives. Figure 2 outlines the change to the company's operating leverage over this time. Operating income is shown as adj. EBIT, recorded after capitalizing 100% of R&D costs, that are expensed on the income statement as an intangible asset, amortized in a straight line over a 7-year useful life. Critically, the company produced ~4x operating leverage from its rate on cost in Q2 after these adjustments. That being, for every $1 in new revenue, PEN produced $4 in additional adj. EBIT.
BIG Insights
2. Additional inflection points from Q2 FY'23
Stripping apart the GAAP numbers is critical to discerning the value PEN is creating via its business growth.
The company's gross profit margins are a constant talking point from Wall Street analysts. It often faces criticism for promising a 70% gross, but hasn't managed to pass this mark over the last 2.5 years. But thinking of gross profitability as a percentage of revenues only shows one angle. It says nothing of the link to what resources have been employed to generate said profits.
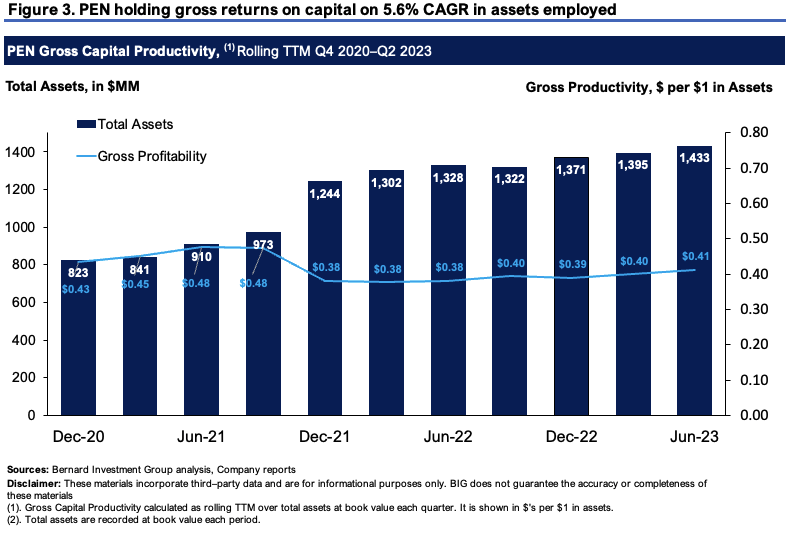
Figure 3 depicts the company's gross profit as a percentage of total assets employed, on a rolling TTM basis. All core and non-core assets are included. The bulk of resources on its books are tied up in working capital (inventories, receivables). In fact, its current asset account is 2.9x the size of its fixed asset base at the time of writing.
What figure 3 shows is that for every $1 employed the company is returning $0.41 in gross. Above $0.30–$0.35 is considered a good number. This, as total assets have grown at a 5.6% CAGR since 2020. This implies the company's model is astute in producing income. If every $1 of assets employed gets you $0.41 in gross, you're looking at a productive base in my view. What's more, this has grown off $0.38 on the dollar in Q2 FY'22. Specifically, assets employed have grown 7.9%, and gross capital productivity has matched this with a 7.9% uptick—literally 1:1 matching. This should not be discounted in the talk on gross margin. As a percent of revenue is one thing. But as a function of the capital required to produce the profit in the first place—far more telling in my view.
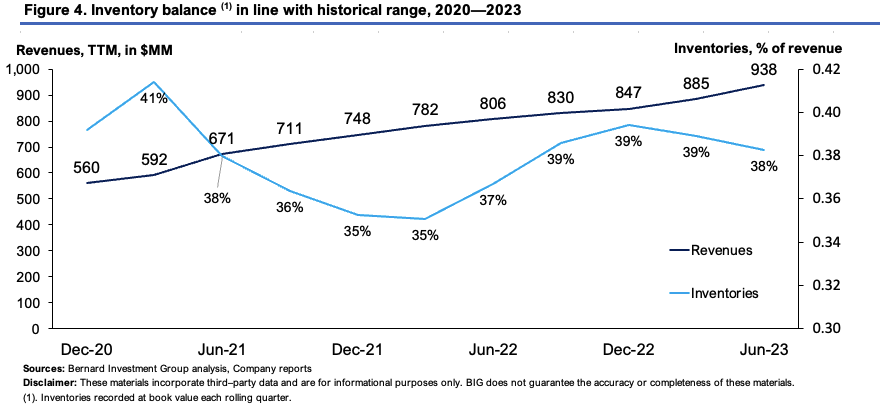
The second point to consider is what percentage of revenues are underneath each revenue clip. Firms whose inventories increase at a faster rate of change to revenues aren't moving their stock out the door whilst booking sales forward (and are therefore a risk in my opinion).
Figure 4 outlines PEN's sequential revenue clip versus inventories booked on a rolling TTM basis as well. Inventories are recorded at book value each reporting period, and calculated as a function of revenue. Critically, as sales have stretched up, inventories booked have remained within a 400bps range of 35–39%, excluding 2020 as the outlier at 41%. The cyclicality of inventory balance vs. revenues shows PEN working through its sales cycle. Hence, these are 'quality' revenues in my view.
Market-generated data
Given the recent price action, the market-generated data is revealing about price visibility going forward.
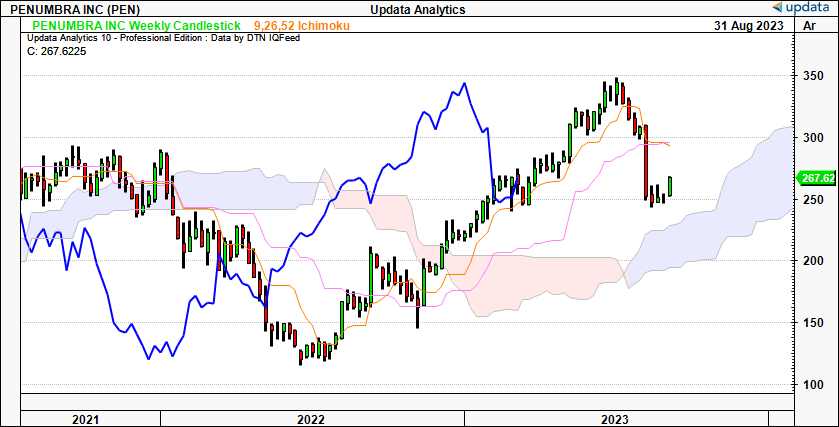
Figure 5 shows the price structure in 2023, with the sharp consolidation in H2, as outlined earlier. The weekly cloud chart looks to the coming months, and signifies a long-term view. Both price and lagging lines (in blue) are positioned above the cloud after a 4-week base forming since the repricing. The price line didn't test the cloud top, instead has caught a bid above that mark.
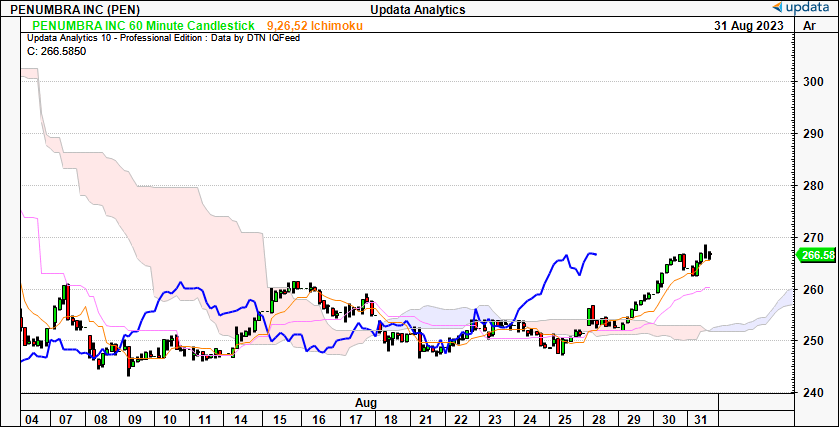
PEN needs to break higher from here to gather support at the cloud top, which could be $260 by November, and ~$300 by January '24. In my eyes, we are still in a continuation of the longer-term uptrend. As comfort for the nearer-term, the 60-minute chart—that looks to the coming days—the stock has crossed the cloud and sells above its average range for August [Figure 6].
Figure 5.
Figure 6.
As such, we have upsides to $284 on the point and figure studies below. Given the sharp downside vol. seen these past 2 months, the P&F analysis is critical in providing a view without the intra-trend vol. flutters. It eyed the moves to $260 and $320 previously, so I'm looking to this target with some degree of confidence. But the risk is, if the stock breaks lower, the $218 target would likely be activated. I'd also look to the $218 mark in this instance.
Figure 7.
Data: Updata
Valuation and conclusion
PEN is pricey, there are no secrets about that. The stock sells at 9.6x forward sales and offers little room for error trading at 1.5x PEG ratio at its current earnings. It's clear investors have been valuing the company on operating profit since 2021, and the rally of FY'22–'23 appears to have been spurred on by its gains in this domain. The company expects 10% pre-tax margin in FY'23 on revenues of $1.07Bn, calling for $100mm for the year. This is severely underserved in its current numbers as it looks to generate another c.$75mm of operating income in H2. I don't believe this is fully reflected in its current market price structure.
In the April publication I outlined the case for PEN to sell at $338/share [see: April publication, "Figure 7" in " Valuation "]. It was then revised to ~$490/share in June after baking in a higher growth rate into the calculus. I've decided to rest back on the original target of $338 until the company's FY'23 numbers, rewinding the long-term growth rates baked into the model. This still calls for $1.03Bn at the top-line, on $132mm of adj. NOPAT and $183mm NWC, plus ~$32mm of CapEx for the year. Alas, this still offers plenty of safety margin and is well supported by the fundamentals discussed here today.
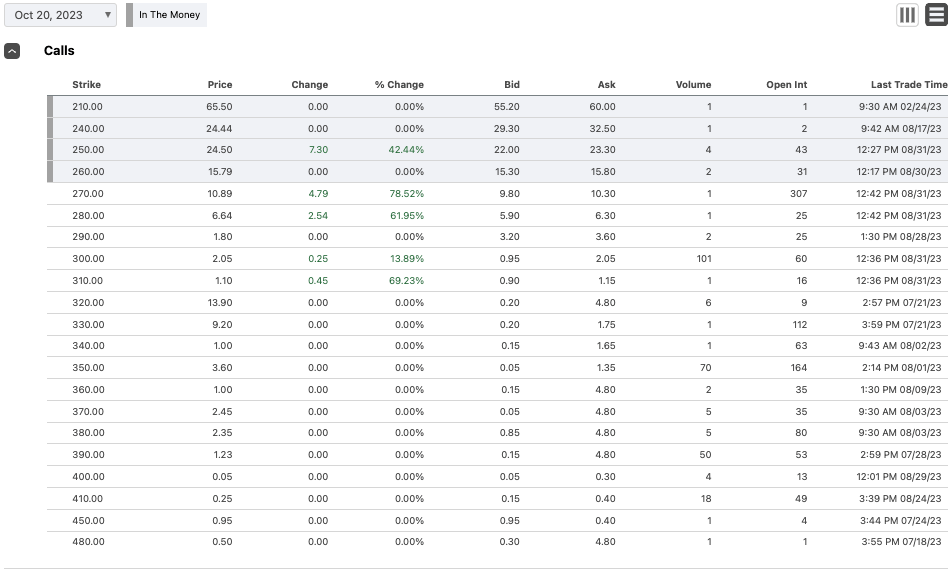
Finally, investors with capital at risk have PEN to push beyond the $350 mark by October, as illustrated by the options-generated data. There is support for a price structure of $350–$410 by this time, given by the presence of demand in the calls chain. Even put for October expiry are concentrated at the $330 mark as well. This exudes the kind of market positioning I am looking for as another potential catalyst. If it rallies higher, each of the price levels shown in Figure 9 would be knocked out, providing a surge of demand at each mark.
Figure 8.
Figure 9.
In short, the short-term price risk PEN investors have endured has indeed tested the intestinal fortitude of our PMs and called us to question the long-term thesis. Critically, the long-term still remains very attractive for PEN. It has numerous product launches on the horizon, and what assets are employed into the business are throwing off attractive gross profit as we roll through time. There's no denying the stock is expensive. But as you look at the price in relation to assets employed in the business, the company has far more appeal. That, and the market has tremendously high expectations for PEN, a feat which has lived up to in aggregate over 2019—date. Net-net, reiterate buy.
For further details see:
Penumbra: Consolidation Does Nothing To Change Long-Term Thesis, Reiterate Buy