PEO - PEO: You Are Better Off With An ETF Here (Rating Downgrade)
2023-10-18 07:34:36 ET
Summary
- The Adams Natural Resources Fund is an equities closed-end fund focused on energy and materials equities.
- PEO aims for long-term capital appreciation rather than income, but fails to outperform a simple 80% energy / 20% materials portfolio.
- PEO doesn't effectively utilize CEF features like leverage or high dividend yields, which are common in CEFs.
- The fund has a managed distribution policy, targeting a 6% minimum annual distribution. It pays small distributions quarterly, but has a large year-end distribution in December.
Thesis
Going into year-end we have expressed our bullish view on oil via several articles:
- USOI: Covered Call Oil Fund, 24% Yield, where we rate USOI a Buy
- FILL: Global Energy Equities, Attractive Valuation, where we rate FILL a Buy
We are therefore also revisiting a fund we covered last year here , namely the Adams Natural Resources Fund (PEO), an energy closed-end fund. We wanted to see if the CEF merits a rating upgrade given the macro developments.
The vehicle focuses on energy and materials equities and has a large cap tilt. The fund has long-term capital appreciation as its main goal, as opposed to income. A majority of CEF structures have income as their main objective. When a CEF has capital appreciation as its main objective the fund needs to outperform simple ETFs in the space in order to justify the higher management fees.
The closed end fund structure is usually conductive to strategies that simple exchange traded funds cannot employ - and that involves leverage and high dividend yield extraction from an asset class. When none of these are present, a CEF needs to impress via outperformance, otherwise, there is no need to obtain exposure to the primary risk factor via this type of structure. PEO does not excel when it comes to performance:
Historic Performance (Fund Fact Sheet)
While its returns are positive for each contemplated time frame, they are very much in line with the S&P 500 Energy Sector Index, and trailing the S&P 500 Materials Sector Index. PEO is an 80% Energy, 20% Materials CEF currently, and one would expect its long-term total returns to straddle the two sectoral numbers. We go further into detail about the structure versus a simple ETF construction in the 'Performance' section below.
The fund also fails to follow other CEF peers in terms of consistent monthly distributions. PEO has a token $0.1/share quarterly distribution, bar-belling capital, and ROC disbursements into year-end, via a December special dividend. The fund has a de-minimis leverage ratio of 0.7%.
All of the elements present in this fund do not justify the employment of the CEF structure here, with PEO failing to outperform simple ETFs long term while also not utilizing the CEF structure to provide high monthly dividends. A retail investor who likes the risk factors is better served in selling PEO and purchasing an 80% XLE, 20% XLB portfolio.
For the avoidance of doubt, we are of the opinion that the PEO collateral will perform into year-end, however employing an expensive CEF structure with high management fees has failed to produce superior results versus a simple ETF portfolio allocation in the past year. When CEFs do not outperform via active management or leverage, there is no need to pay higher fees for them.
Fund Holdings
As per Morningstar, we can observe the current sectoral split:
Macro Allocation (Morningstar)
From the fund's fact sheet we can get a more granular view of the actual sub-sectors present in the fund:
Sectors (Fund Fact Sheet)
Chemicals and Metals & Mining are the largest Materials sub-sectors here.
The top names in the fund are very similar to what an investor can find in the Energy Select Sector SPDR Fund ETF (XLE):
PEO Holdings (Fund Fact Sheet) XLE Holdings (Seeking Alpha)
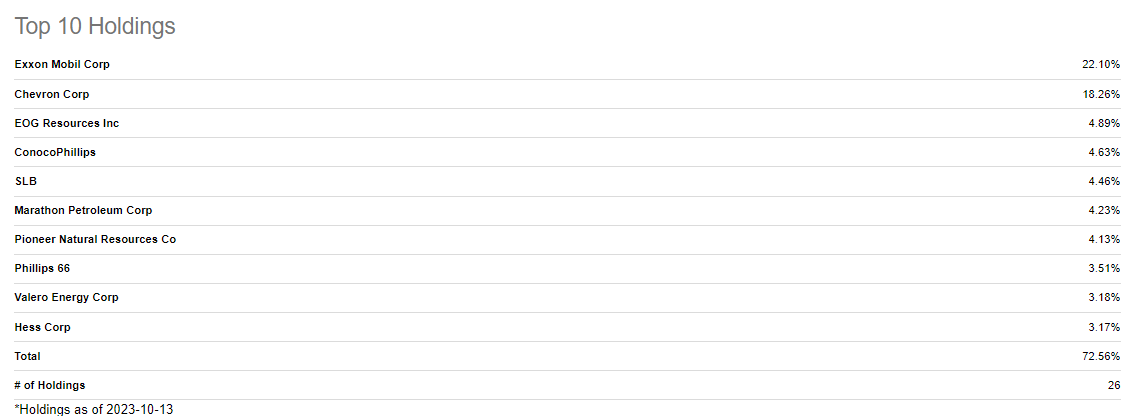
As we can see from the above tables, Exxon (XOM) and Chevron (CVX) are the top holdings in both funds, with a very similar weighting for XOM, while PEO contains a lower CVX percentage.
Linde Plc (LIN) is the only Materials name present in the top-10 fund holdings in PEO.
Performance
Long term the CEF has a total return performance very much in line with the simple XLE ETF:
Since the Materials Select Sector ETF (XLB) significantly outperforms both tickers, one would expect a fund like PEO with an 80/20 allocation between Energy/Materials to have a total return profile somewhere in between the blue and orange lines. Yet it doesn't. The reason boils down to individual security selection, the CEF including in its portfolio throughout time names which did not keep up with an aggregate fund.
As discussed in the Thesis section, for a capital gains oriented CEF to justify its higher management fees we need to see outperformance. We are not seeing it here, and in fact an investor would be better off from a total return perspective to have allocated 80% to XLE and 20% to XLB. On a 10-year lookback such a simple portfolio would have generated 54.9% x .8 + 124.1% x .2 = 68.74%, net superior to PEO's results.
Dividend Policy - the fund targets a 6% distribution
The fund has a managed distribution policy that targets a 6% minimum:
The Fund established an annual 6% minimum distribution rate commitment that has been met or exceeded since its adoption in 2012. The commitment is not a guarantee, and may be changed by the Board should market or other conditions warrant. Distributions are generated from portfolio income and capital gains derived from managing the portfolio. If such earnings do not meet the distribution commitment, or it's deemed in the best interest of shareholders, the Fund may return capital. The Fund presently pays distributions four times a year, as follows: ((A)) three interim distributions on or about March 1, June 1, and September 1, and ((B)) a "year-end" distribution, payable in late December, consisting of the estimated balance of the net investment income for the year, the net realized capital gains earned through October 31 and, if applicable, a return of capital.
Payments are made quarterly here, but unlike other CEFs, this fund has a bar-belled year end distribution policy:
Historic Dividends (Seeking Alpha)
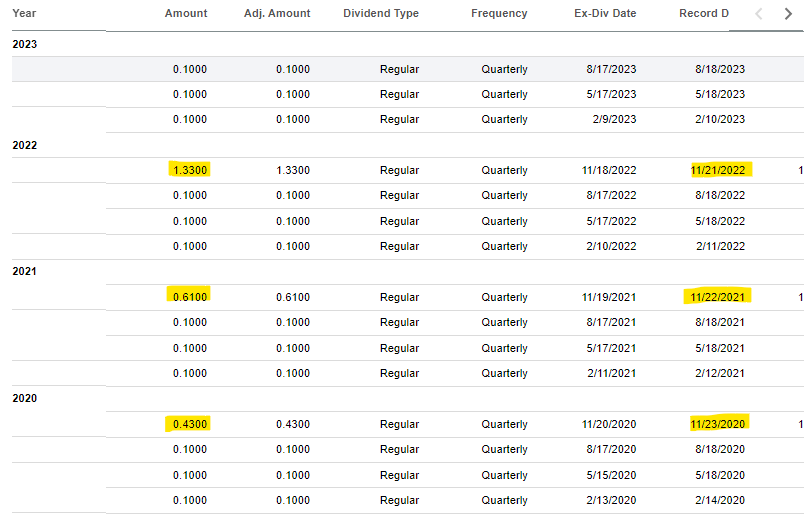
As per its policy, the fund distributes $0.1 per share in March, June and September, with a larger year-end distribution that can also contain return of capital.
This type of distribution policy really brings this fund from the CEF realm to the ETF realm. A marketing tool that sits well with retail investors in the CEF world relates to consistent monthly distributions managed by the fund portfolio managers. At the end of the day, a retail investor who purchases an 80% XLE and 20% XLB stake can sell a portion of those funds to create a cash payment at year-end. It does not make much sense to pay a high management fee for a portfolio manager to do that for you.
Conclusion
PEO is an equities CEF. The fund currently holds an 80% energy equities sleeve and a 20% materials one. The CEF employs virtually no leverage (0.7% leverage ratio) and has a small quarterly distribution. The chunk of the distribution yield comes in December of each year, via a special variable dividend.
PEO fails to use the CEF wrapper correctly but charges a high management fee. We have shown in the article how a simple 80% XLE / 20% XLB portfolio outperforms significantly long term while employing a lower expense ratio.
We like energy going into year-end, and feel PEO's holdings will perform. However, we cannot find a rational justification for paying a high management fee via PEO when a retail investor can just utilize simple generic ETFs to obtain better results. Therefore we are a Sell for PEO here, favoring a simple portfolio replication via 80% XLE and 20% XLB.
For further details see:
PEO: You Are Better Off With An ETF Here (Rating Downgrade)