IAS - Perion Network: Cross-Selling Should Lead To Great Future Growth
Summary
- Perion Network Ltd. is a global technology enterprise in digital advertising.
- The global digital advertising market is growing by double digits.
- Perion is growing in EBIT Margin thanks to large synergies in operating expenses and thanks to the iHUB technology engine.
- Great Free Cash Flow should allow Perion Network Ltd. to grow also through acquisitions over the next few years.
Perion Network Ltd. ( PERI ) is one of the most promising global technology enterprises in digital advertising. In just two years, it has almost doubled its revenue, and above all, it has reached an Ebit Margin figure of 15.1%, which is 5 times that recorded two years ago (3.7%). If the revenue growth can be attributed to a strong growing market and also to the ability to make targeted acquisitions, the strong growth in the profitability margin is attributable to the great ability to find all possible synergies on operating expenses and to develop a technical engine ((iHUB)) able to optimize cross-selling activities through the company's three business pillars. According to Doron Gerstel ((CEO)) iHUB managed to increase EBITDA by 40% in just one year.
The growth of total assets on the balance sheet was higher than that of revenue, and this caused a decrease in Capital Turnover. In the coming quarters, the company will have to maintain high turnover growth rates in order not to invalidate the profitability of the ROCE, and this could represent an element of risk if the next acquisitions are not as profitable as those of the past. Another positive element is represented by the Free Cash Flow ("FCF"), which also grows by double digits and allows the company to make the best use of the funds for future growth. The rapidly growing global market and an attractive share price valuation lead me to believe in a long-term investment in PERI. My rate is "Strong buy."
Company Quick Overview
Perion Network Ltd. was founded in the last millennium (1999) in Israel and become a public company in the U.S. in 2006.
Perion could be defined as a global technology enterprise in digital advertising operating through three different segments: advertising by the search engine, by social media, and by video or Cable TV.
The company’s purpose is to identify the best valuable customers across all the above segments to agencies and publishers. The central technical engine is the proprietary Intelligent Hub ((iHUB)) which is a sort of collector across the business segment to provide all available cross-sell opportunities.
During the years, the company grew also through strategic acquisitions: ClientConnect Ltd. in 2014, Interactive Holding Corp. in 2015, Septa Communications LLC, in 2019, Content IQ LLC and Pub Ocean in 2020, and the last acquisition of Vidazoo in October 2021.
Digital advertising and market trends
According to eMarketer reports , the digital advertising market is 55% of the total media advertising and is more than $571B in 2022. The forecast for 2025 is to reach $785B and 57% of global advertising spend. The compounded annual growth of the total digital market is 11.2%
According to Statista , the ad search will grow from $260B (2022) to $366.5B (2025); the video ad will grow from $180.4B (2022) to $266.5B (2025) and the banner ad will grow from $155B (2022) to $201.4B (2025). The CAGR is expected to be 12.1% for Search, 13.9% for video, and 9.1% for the banner.
Both studies show a double-digit growth projection of between 11% and 12% globally.
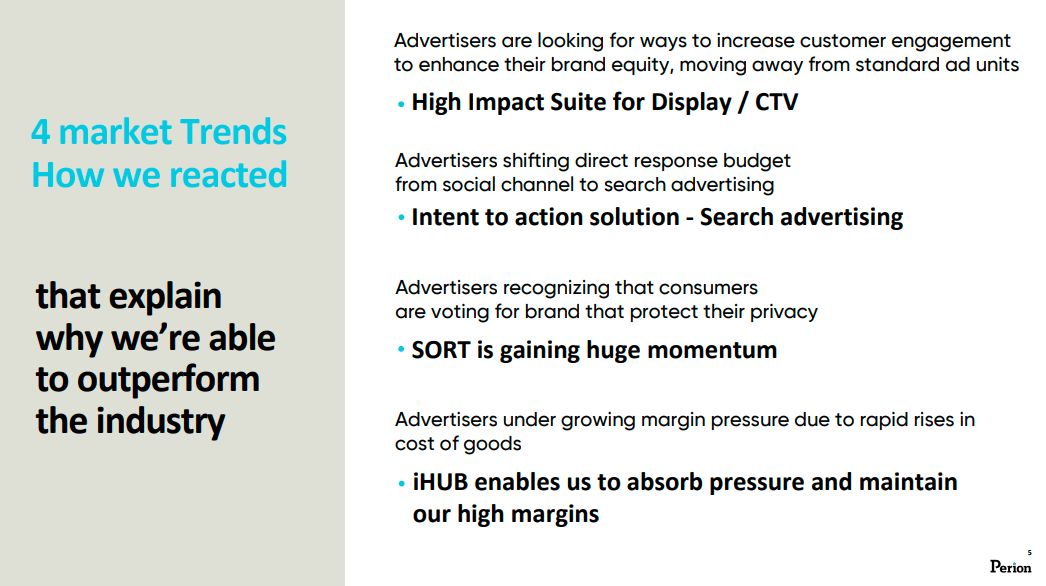
According to Perion , there are also 4 big market trend:
Video/Display/CTV is the growing market and represents the first business growth opportunity for Perion. The second trend is identified in the shift from social to search advertising. The third opportunity is the brand privacy request niche. The last trend is focused on cost savings, and Perion thinks that iHUB is the best solution/engine to absorb the increase in good expenses.
Financial & Highlights
Revenue and Profitability
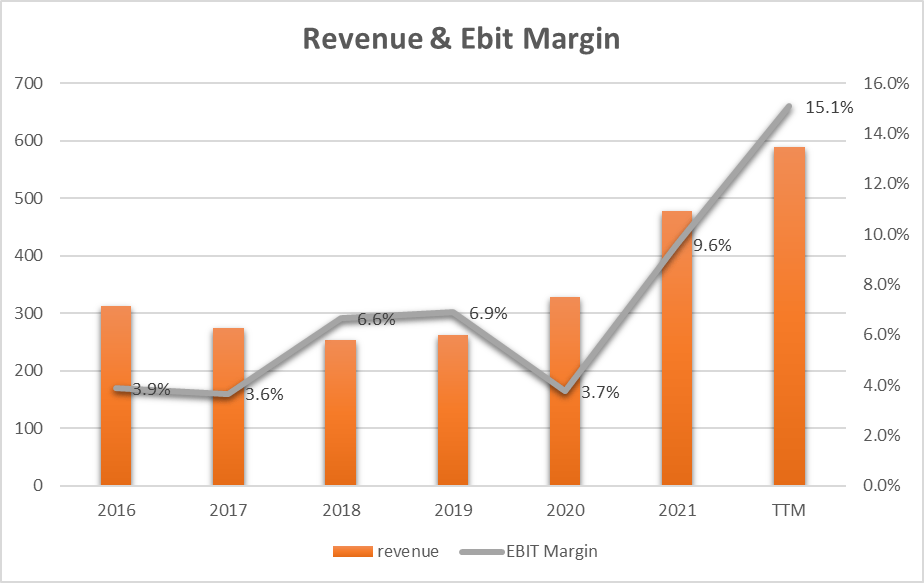
Since 2016, revenue has almost doubled from $312M to $588M ((TTM)) but the greatest growth was recorded in the last two years (2021 and 2022) thanks to two factors: the strong growth market trend and thanks also to strategic acquisitions (Vidazoo in October 2021 is the latest). In the next few years the company, thanks also to the strong availability of cash, will be able to continue its policy of acquisitions and also continue to ride the market trend.
But the most interesting thing in the graph is certainly the growth of the EBIT Margin, which went from 3.7% in 2020 to 15.1% in 2022. This extraordinary result is mainly due to the company's great ability to find effective synergies in the acquisitions and also to the technological heart of the business ((iHUB)). It generated 40% of growth in margins, as we can hear from the last earnings call :
In its first year, iHub contributes 40% of our year-over-year EBITDA growth, and more importantly, our ability to capture signals from all channels to a central hub, as you can see it on your screen and analyze them is the main factor behind SORT superior performance over other conventional targeting methods.
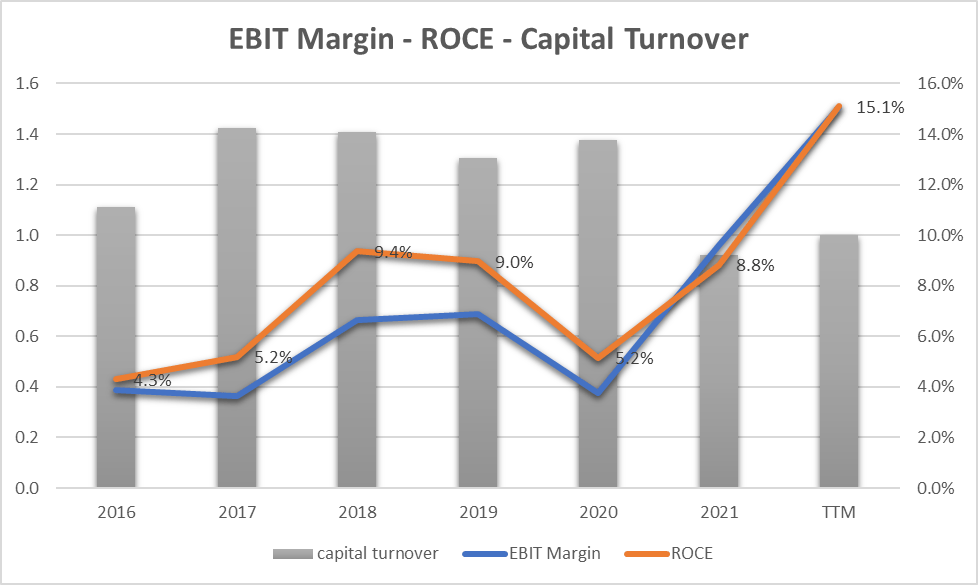
Moving on to analyze the profitability generated by the use of the capital employed in the company we can see how the ROCE (Return on Capital Employed) - orange line - was higher than the EBIT (blue line) until 2020, after which the two profitability ratios of are perfectly aligned. This happened because the Capital Turnover (gray bars) went down and stabilized at the level of the unit.
Capital turnover dropped from 1.4 (2017-2018) to 1 because the assets used to generate revenue grew at a faster rate than revenue grew. The reason is related to the acquisitions made or to the intangible assets included in the balance sheet. Therefore, if we want to find an area for improvement, it could be precisely that of increasing the Capital Turnover Ratio with greater organic growth in revenue.
Free Cash Flow, EPS, and CapEx
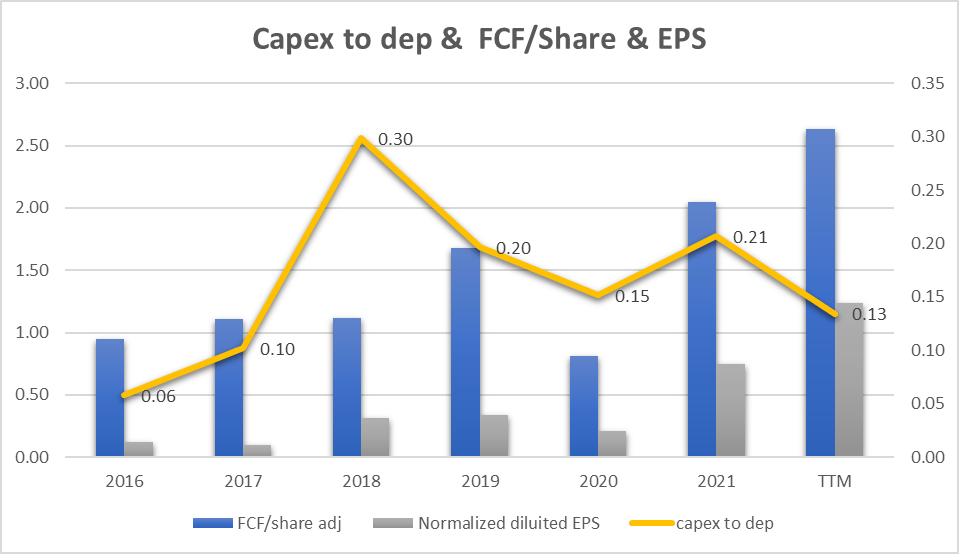
EPS compound annual growth (grey bars) has been 47.6% since 2016 while Free Cash Flow/Share has grown by 18.5%. Both growth rates identify a strong and stable trend and above all the graph shows us how the profits generated by the company are transformed stably and constantly into cash flows which are then used for strategic acquisitions. In terms of CapEx (yellow line), the company spends very little as it only purchases hardware for business management.
Valuation
Earnings Power Value Model
With the conservative assumption that the cash profit remains constant over the long term, I use the EPV (earnings power value) method to calculate the share price
The method starts with EBIT. The second step is to add depreciation and amortization and then subtract stay-in-business CAPEX.
The result is the Cash Trading Profit
I then subtract the taxes by calculating the amount using the actual tax rate that the company pays.
The result is the After-Tax Cash Trading Profit
At least to calculate the total company enterprise value I divide the After-Tax Cash Profit by the interest Rate I define as fine for this kind of Company (PERI could be defined, at the time, as a low-risk company so I decided to use 8%)
The result is the Total Company Earnings Power Value. Dividing the result by the total number of shares we find the value per single share.
The table below shows the calculation for PERI
| EBIT |
| 88.80 |
| Dep & amort |
| 6.70 |
| CAPEX |
| -0.90 |
| Cash Trading Profit |
| 94.60 |
| TAX |
| 13.90% |
| TAX |
| -13.1494 |
| After TAX cash profit |
| 81.45 |
| Interest Rate |
| 8% |
| EPV |
| 1018.133 |
| Share in issue |
| 45.1 |
| EPV per share |
| 22.6 |
$22.6 represents the share price valuation using the EPV method. If we compare the data with the current market price ($25) we see that the current price could be seen as fair especially if we think we have carried out the valuation without considering cash profit growth.
FCF/Share Model
To define a maximum buying price, I use also a formula based on FCF/Share and interest rate.
The formula is:
Maximum buying price = Cash profit per Share/interest rate – 20% (safety discount)
If TTM Cash Profit per share is $2.63
Interest Rate=inflation Rate = 7.1%
Maximum price before Safety discount = 2.63/7.1%= $37
The maximum price at 20% discount = $30.9
Under the FCF/Share analysis, it seems that the actual price of $25 is cheap.
All valuation models converge on a share intrinsic value between $23 and $31 and this represents an interesting element in terms of investment in the long run.
Risks
Growth through acquisitions
The Company has made several acquisitions in the last years and may continue to acquire other businesses in the next ones. The financial results showed that the past acquisitions have generated significant growth in both revenue and margins thanks to the synergies obtained in operating costs. We have also seen how the value of the assets has grown more than the revenue and this has subtracted profitability in terms of capital turnover. The expectation is that future acquisition could lead to similar increases both in terms of revenue and in terms of margins and if this does not happen, the company could suffer a hit on EPS and also on ROCE.
Highly competitive market
As we can deduce by listening to the latest earnings call
How can we keep outperforming our peers. I keep asked this question, and I think it's more relevant today than ever before. Perion is uniquely able to react and size opportunity based on current trends that might change. But what will not change is our DNA to continue identifying trends and turn them into business opportunities.
One of the most important aspects for the company is the flexibility in knowing how to adapt to market changes but what will happen if large tech company as Amazon, Google, and Meta will decide to enter the same competitive arena? It could be possible that it could significantly reduce the company’s ability to grow in the industry.
Peer Comparison
To compare PERI with similar companies in terms of market competition in the Advertising industry, I have defined the following peers:
TechTarget, Inc. ( TTGT )
Integral Ad Science Holding Corp. ( IAS )
Magnite, Inc. ( MGNI )
PubMatic, Inc. ( PUBM )
The Trade Desk, Inc. ( TTD )
Using Seeking Alpha's Quant Ratings we have a "Strong Buy" verdict related to the "Hold" - "Buy" – "Sell" rating of the others company.
Perion looks like it could be the best solution in terms of investment.
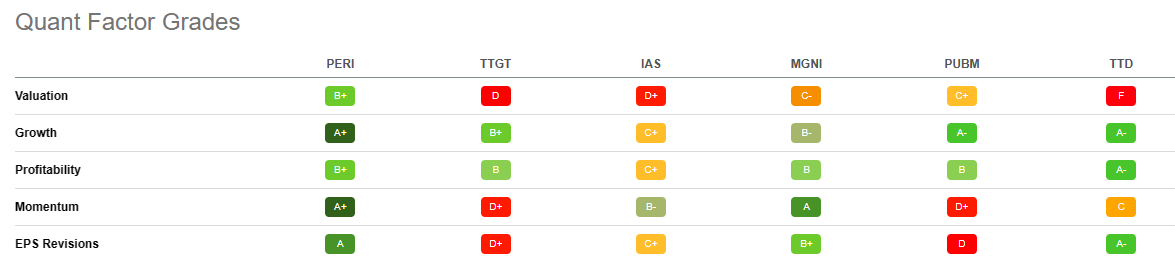
From the Quant Factor Grades point of view, we can see how Perion is outstanding in Growth and Momentum, and also in EPS Revision the grade is "A." Only in Valuation and Profitability, the grade is "B+": related to Valuation the company is the best in class instead in Profitability TTD represents the best solution.
This comparison allows us to understand how at this moment Perion is experiencing positive momentum and that his peers are unable to reach this rating.
Bottom Line
Perion Network Ltd. is a company that has managed to grow in the last 2 years thanks also to strategic acquisitions. The management was very good at seizing all the possible synergies bringing the EBIT Margin to 15.1% ((TTM)) - the highest value since 2016. With a large capacity to generate Free Cash Flow, Perion will be able to continue the growth strategy with new acquisitions also in the next year. The digital advertising market is growing by double digits and this aspect also lays the foundations for a successful investment. With a fair share price valuation, my rating for Perion Network Ltd. is "Strong Buy."
For further details see:
Perion Network: Cross-Selling Should Lead To Great Future Growth