UNVGY - Pershing Square Holdings 1H 2023 Letter To Shareholders
2023-08-23 09:00:00 ET
Summary
- Pershing Square Holdings (PSH) generated a NAV performance of 10.0% in the first half of 2023, with a total shareholder return of 5.4%.
- Day One Investors in Pershing Square, L.P. have grown their equity investment at a compound annual rate of 16.1% over the last 20 years, outperforming the S&P 500.
- PSH's NAV return ranked #1 out of 141 funds in Investec's North American closed-end fund peer group for the five-year period ended May 31.
In the first half of 2023, Pershing Square Holdings ( PSHZF ) generated NAV performance of 10.0%, and a total shareholder return of 5.4% due to the widening of the discount to NAV at which PSH’s shares trade. 6 PSH’s year-to-date NAV return through August 15, 2023 was 13.1% compared to 16.8% for the S&P 500 index ( SP500, SPX ) over the same period. 7
Investors who invested in Pershing Square, L.P. at its inception on January 1, 2004, and transferred their investment to PSH at its inception on December 31, 2012 (“Day One Investors”) have grown their equity investment at a 16.1% compound annual rate over the last nearly 20 years, compared with a 9.4% return had they invested in the S&P 500 over the same period. 8
With the benefit of compounding, our 16.1% compound annual NAV return translates into a cumulative total NAV return since inception of 1,762% versus 488% for the S&P 500 over the same period. In other words, Day One Investors have multiplied their equity investment by 18.6 times versus the 5.9 times multiple they would have achieved had they invested in a zero-fee S&P 500 index fund. 9 Using PSH’s stock price return rather than its per-share NAV performance, Day One Investors have earned a 13.8% compound annual return, a 12.6 times multiple of their original investment, less than our NAV return due to the widening of the discount to NAV. 10
It has been more than five years since we restructured Pershing Square to a smaller, more investment-centric organization with the expectation that future asset growth would be principally driven by investment results rather than asset accumulation. A critical part of our restructuring was refocusing our strategy on our core investment principles. The combined effect of these initiatives has contributed to an extremely strong period of outperformance compared to the market and other investment funds, even when compared to our longer-term record.
Since the announcement of the Pershing Square restructuring in March of 2018, a PSH has generated a compound annual rate of return of 28.1% and a cumulative return of 278% compared to the S&P 500 which has generated 12.1% and 84% returns respectively over the same period. 11 According to Investec Research, for the five-year period ended May 31, 2023, PSH’s NAV return ranked #1 out of 141 funds in Investec’s North American closed-end fund peer group, which includes all constituents of the AIC North America and IA North America sectors. b PSH’s performance exceeded the next best performing fund by 1,115 basis points per annum and by 121% in cumulative returns over the same period.
We believe that to continue our record of strong performance, we just need to do more of the same:
- Invest in the highest quality durable growth companies at sensible prices,
- Ensure our portfolio companies have excellent leadership, good governance, and proper oversight, and
- Hedge “black swan” and other global macro risks when the market affords us the opportunity to purchase low-cost “insurance” against these risks.
Year to date, we have accomplished these objectives, and our portfolio companies are continuing to demonstrate strong and resilient performance in a volatile macroeconomic and geopolitical environment. Our companies’ outperformance in challenging markets is by design as we principally attempt to mitigate macro, geopolitical, and economic risks by investing in highly durable growth companies that we have selected for their ability to withstand these risks. No matter how robust the business, however, certain extrinsic risks can have a negative impact. We therefore attempt to hedge these risks when it makes economic sense to do so.
Hedging and Asymmetric Investments
Our approach to hedging is first to understand global macro and geopolitical risks, and then to identify asymmetric ways to hedge these risks. Profits from successful hedges can often be redeployed opportunistically because when the hedged risks emerge, common stock prices usually decline substantially. Research in connection with our hedging process also leads us to a deeper understanding of the economy and geopolitical factors, which assists us in better understanding our current portfolio companies and identifying potential new investments.
Hedging gains have been a material contributor to our performance since March 2020 when the Pershing Square funds generated $2.6 billion of proceeds from our COVID-related hedge on an immaterial investment in CDS premiums. 12 Beginning in December 2020, we purchased interest rate hedges because we believed there would be a material increase in inflation and that the Federal Reserve would be required to raise short-term rates substantially. We sold these short-term rate hedges last year generating $2.7 billion of proceeds on a total investment of $384 million. We also initiated new interest hedges, this time on long-term rates, beginning in April of last year. At year-end 2022, these hedges were valued at $381 million, an 83% premium to their cost.
Since the end of last year, our interest rate hedges have decreased somewhat in value as long-term rates have declined due to recession fears and the regional banking crisis, and as the passage of time has reduced the value of these option-like hedging instruments. We did not sell these hedges at year end because we remained concerned about the risk of higher long-term rates on our portfolio.
We do not expect our hedging strategy to be profitable unless the risk we are hedging occurs in the time frame that we have estimated. We have to be right on both the nature of the risk and the timeframe in which we expect it to occur for a hedging strategy to be successful. If the hedged risk does not occur, then our equity portfolio should be the beneficiary of the absence of this risk. Relatively low long-term rates for most of 2023 have not been a material headwind to our portfolio companies’ year-to-date returns, profits which substantially exceed the drag on our performance from the decline in the value of our hedges.
We structure our hedges using asymmetric investments which at cost typically represent a low, single-digit percentage of our capital. We do so in order that the long-term drag on performance from these hedges is small. In the short-term, however, there can be periods where a profitable hedge declines in value if the identified risk abates before we have exited the hedge.
We continue to hedge the risk of a rise in 30-year Treasury rates because we remain concerned about the risk of higher long-term interest rates on equity valuations. Inflation is showing encouraging signs of moderation, but it remains persistently high. While we have seen promising progress in shelter inflation as asking rents moderate and as goods inflation and supply chains normalize, inflation in non-shelter services – which represents nearly half of personal consumption expenditures – persists, as wages remain elevated.
Despite the Federal Reserve’s rapid tightening of monetary policy and widespread predictions for a recession, the labor market and economic growth have remained highly resilient. The pace of job growth has recently slowed somewhat, but remains about twice the level that we would expect in a stabilized economic environment.
We believe that emerging structural forces including higher defense spending, energy scarcity and the transition to green energy, deglobalization, and the increased bargaining power of labor will likely contribute to sustained longer-term inflationary pressures.
In recent weeks, long-term yields have increased substantially, as have the value of our long-term rate hedges, as investors have recalibrated expectations for future growth and the possibility of ‘higher for longer’ interest rates. The yield on the 30-year Treasury has increased by 0.7% from a low of 3.6% in early April to 4.3%. We believe that long-term interest rates can continue to rise substantially from current levels.
Investors have become so accustomed to low long-term rates for many years that 4.3% seems like a high long-term rate for many fixed income investors. We do not believe that current levels of long-term Treasury rates are high considered in a longer-term historical context, and when one does the math on what long-term rates must be for investors to earn an adequate long-term, risk-free return in excess of inflation.
If inflation declines and stabilizes at 3%, above the Fed’s target of 2%, 30-year Treasury yields could reach or exceed 5.5%. We generate our 5.5% estimate of long-term rates by adding: (1) the estimated long-term inflation rate of 3%, (2) the equilibrium real short-term interest rate of 0.5%, and (3) the historical 2.0% average term premium for long-term rates relative to short rates, (3.0% plus 0.5% plus 2.0% = 5.5%).
Furthermore, we expect the supply-demand outlook for long-term bonds to deteriorate in the coming months as the supply of longer-term Treasurys grows, with $1.9 trillion of new issuances during the second half of this year contemporaneous with the Federal Reserve reducing its Treasury holdings through quantitative tightening. A number of the largest foreign holders of U.S. Treasurys including Japan, China, Saudi Arabia, and other nations have or will likely be reducing their holdings of U.S. Treasurys as rates rise in Japan, the US-China decoupling continues, and other nations seek to moderate their U.S. dollar exposures.
In addition, if companies and their management teams continue to reassess their recession scenarios and become more optimistic about the economy, the demand for credit may increase substantially as businesses increase their borrowings to fund new investments. Greater demand for credit will also likely contribute to higher longer-term interest rates.
While predicting the future of interest rates is a challenging endeavor, we believe it is prudent to continue to hedge the risk of higher long-term rates in light of the continued risk to equity valuations.
Stock Repurchases
PSH has an ongoing buyback program which takes advantage of the large discount at which our shares trade. Subject to regulatory constraints, we intend to continue to repurchase shares if: (1) the large discount persists, (2) our portfolio companies are trading at substantial discounts to our estimate of their value, and (3) we have cash on hand to fund purchases that is not needed for potential new investments.
We are living in a highly uncertain geopolitical, economic, and stock market environment. Despite this challenging environment, we are able to implement a long-term investment strategy largely due to the long-term nature of our shareholders and the unique attributes of PSH’s structure. We are extremely grateful for your long-term investment in PSH which greatly contributes to our continued progress.
Sincerely,
William A. Ackman
PORTFOLIO SUMMARY (13)
Performance Attribution
Below are the contributors and detractors to gross performance of the portfolio of the Company for the six-month period ended June 30, 2023 and year-to-date 2023. 14
January 1, 2023 – June 30, 2023
| ||||||||||||||||||||||||||
January 1, 2023 – August 15, 2023
|
| Contributors or detractors to performance of 50 basis points or more are listed above separately, while contributors or detractors to performance of less than 50 basis points are aggregated, except for bond interest expense and share buyback accretion. Past performance is not a guarantee of future results. All investments involve risk, including the loss of principal. Please see accompanying endnotes and important disclaimers on pages 46-49. |
Portfolio Company Holding Chart (15)
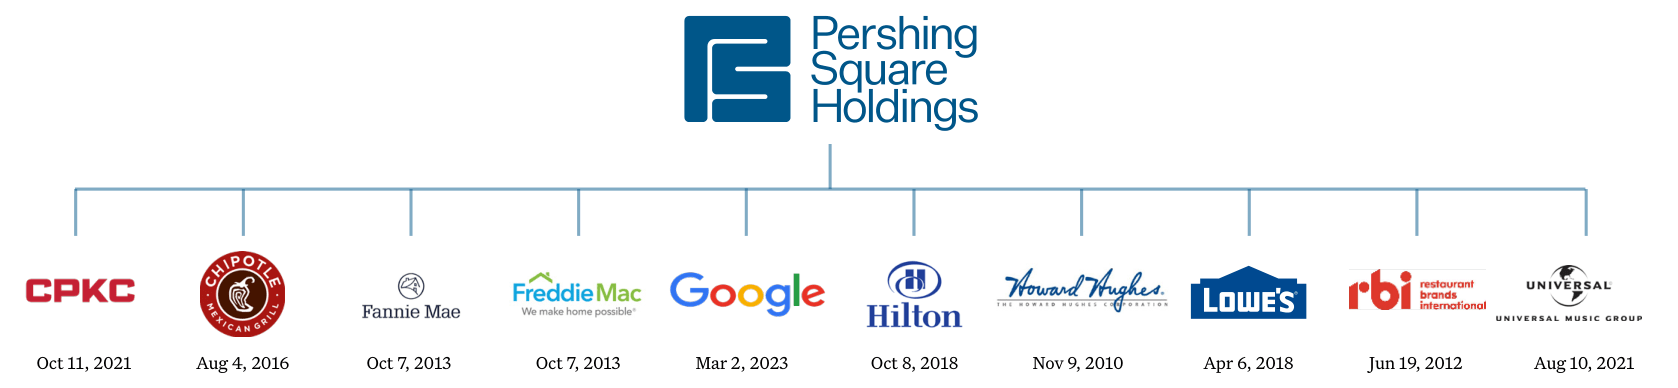
Stock Performance
Below are the stock returns for each of the portfolio investments of the Company for year-to-date 2023. 16
| Portfolio Investment |
| January 1, 2023 – August 15, 2023 |
| Universal Music Group N.V. ( UMGNF ) |
| 5.2 % |
| 43.9 % |
| Chipotle Mexican Grill, Inc. ( CMG ) |
| 33.2 % |
| Restaurant Brands International Inc. ( QSR ) |
| 11.5 % |
| Hilton Worldwide Holdings Inc. ( HLT ) |
| 21.9 % |
| Lowe's Companies Inc. ( LOW ) |
| 14.0 % |
| Howard Hughes Holdings Inc. ( HHH ) |
| (0.7)% |
| Canadian Pacific Kansas City Limited ( CP ) |
| 6.2 % |
| Federal National Mortgage Association ( FNMA ) |
| 41.5 % |
| Federal Home Loan Mortgage Corporation ( FMCC ) |
| 42.7 % |
| * Stock return of Class C shares since the position’s March 2, 2023 inception. Class A shares returned 43.6% over the same period. |
New Position
Alphabet Inc ( GOOG , GOOGL )
Earlier this year, we initiated a position in Alphabet, the parent company of Google. We believe that Google is one of the world’s greatest businesses with deep barriers to entry and massive network effects underpinning its core search business. After having closely followed the company for many years, we had the opportunity to acquire a stake in Google at a highly attractive valuation as misplaced concerns over its competitive positioning in AI overshadowed the high-quality nature of its business and its strong growth prospects.
Google is the dominant leader in the fast-growing digital advertising market. Google has 85%+ market share in search and, along with YouTube, approximately 50% share of the digital advertising market. With higher and improving returns on investment, we expect digital ads to continue to take market share from traditional ad formats like TV and print, and increasingly drive the total advertising market growth above its historical trend. For example, in retail, rising e-commerce penetration is catalyzing the migration of offline promotion and trade spend dollars into digital ads. With Search and YouTube as two of the highest return and most resilient ad formats, Google is well positioned to benefit from the structural growth in digital ad share across many categories.
Similarly, in its Cloud business, Google is a top three player in an oligopolistic market that is in the early stages of a multiyear shift of IT workloads from on-premise to cloud and hybrid cloud solutions. These powerful secular tailwinds have enabled Google to grow overall revenues at a high-teens compound annual growth rate over the last five years which should continue to support near- double-digit top-line growth in the coming years.
We also believe that Google has a significant margin expansion opportunity. Despite core Google Services revenue (excluding Cloud and Other Bets) nearly doubling from 2018 to 2022, profit margins have risen only approximately 100 basis points. The company is committed to improving its cost discipline and recently reduced its workforce by 6%. Given the fundamentally fixed cost nature and high incremental margins of the core search business, we believe that Google can deliver operating leverage while continuing to invest in AI capabilities. Google’s Cloud segment reached break-even profitability for the second straight quarter in the second quarter of this year, and Cloud margins should continue to improve given peers like AWS enjoy nearly 30% operating margins.
In addition to its superb operating and growth characteristics, Google has an extremely strong balance sheet and an attractive capital return program. Cash net of debt comprises 6% of Google’s market cap and the company is currently buying back approximately 4% of its shares each year.
Despite Google’s compelling attributes, we had the opportunity to initiate our position in the company at a valuation of only 16 times forward earnings, a meaningful discount to the company’s mid-20s historical average multiple as concerns around AI’s perceived negative impact on Google’s search business weighed on the share price. We believe these concerns underestimate Google’s structural leadership position in AI for several key reasons.
First, the company’s vast scale and the ingrained consumer habit of “Googling” give the company the largest distribution channel to roll out AI into search and their suite of other apps. Google has 15 different products that serve more than a half billion users, and six products that serve over two billion users. Throughout its recently held IO Day developer conference, Google demonstrated how AI is already deeply embedded into each one of its products in its ecosystem – including features like SmartCompose in Gmail to image generation and editing in Google Photos – generative AI features that will only continue to dramatically enhance the user experience in future iterations.
Second, the company’s substantial distribution moat is enhanced by having access to the highest quality training data given its immense historical index of consumer behavior and queries.
Lastly, Google has made significant investments in AI for nearly a decade. From its acquisition of DeepMind in 2014 to developing proprietary TPU chips designed specifically for AI applications, the company has consistently prioritized AI and machine learning much earlier than peers and the current wave of emerging start-ups.
On the most recent earnings call, Google’s management highlighted encouraging early progress on the integration of generative AI into search. The vast majority of Google search queries today already incorporate some elements of machine learning and, over time, Google plans on serving results powered by generative AI for queries where chat-like responses can improve the user experience. The company has also previewed how context-rich ads can be weaved into generative AI search results. We expect greater AI integration to improve conversion on ads and increase advertiser ROI and monetization. Similarly in its Cloud segment, Google’s AI-optimized infrastructure is a key competitive differentiator as more than 70% of generative AI start-up unicorns are Google Cloud customers today.
Google’s current valuation represents, in our view, an opportunity to own one of the most advantaged scaled players in AI with an unmatched business model and a long runway for growth. The share price has appreciated nearly 40% from our initial cost and we believe there still remains significant upside given the company’s high level of future earnings growth and potential for continued multiple expansion over time.
Portfolio Update
Universal Music Group (“UMG”)
UMG’s share price has been volatile year-to-date as some investors questioned the impact of generative AI on the music industry and UMG’s ability to reliably expand margins. UMG’s business progress, as evidenced by its first half results, and the articulation of the company’s AI strategy, on both an offensive and defensive basis, has largely put these concerns to rest. The share price has responded accordingly. We believe that investor concerns about AI displacing major labels and artists are misplaced. Rather, we believe that AI represents a significant opportunity for the company.
AI is not a new phenomenon to the music industry. Over the last several years, more than 100,000 tracks have been uploaded daily to digital streaming providers (DSPs), a substantial proportion of which were already AI-assisted. Despite this proliferation of content, UMG’s global market share has remained consistent at ~30%. While excitement around AI will increase the proliferation of content even further, we believe that this long tail of AI-generated content will likely never be heard and will not displace legitimate artists’ work. In the handful of instances where unsanctioned AI-generated songs imitating well-known existing artists have achieved virality, they have been promptly removed by DSPs to protect artists’ rights. If DSPs or other industry players fail to protect artists in these instances, we believe that federal copyright law and protections for artists’ name and likeness will mitigate these risks and create opportunities for artists and their labels compensation.
More importantly, we believe investors are missing the potential for AI to serve as a tailwind to UMG and the music industry broadly. AI is already accelerating the music production process. UMG’s partnership with Endel and HYBE’s recent release of a track in multiple languages provide a framework for how the company can monetize AI-assisted music. AI also has the potential to make UMG’s current roster and vast catalog even more valuable by allowing the company and its artists to involve fans with user-generated content and monetize old music in new and revolutionary ways. We expect UMG to announce additional AI-related partnerships over time.
The debate around AI has distracted from recent positive developments that are improving the monetization of streaming.
We have long believed that music is one of the lowest-cost, highest-value forms of entertainment. With Spotify and YouTube’s recent price increases, all major DSPs have now increased prices by 10% for their individual subscriptions and more for family and student plans. Starting this quarter, these price increases began to benefit UMG’s subscription revenue growth rate. While some investors were concerned that certain DSPs were delaying price increases in order to negotiate preferential terms, both UMG and other smaller music labels have confirmed that these price increases are governed by existing agreements and that the labels’ revenues will increase pro-rata along with the DSPs. Over time, we expect regular price increases will become the norm in the audio streaming industry as they are already in the video streaming industry.
Furthermore, led by UMG’s industry-leading management team’s initiatives, we believe that streaming is moving towards an “artist-centric” economic model that will generate more value for the artists that drive subscriber growth, engagement, and retention. While these changes may take time to be fully implemented, we believe that UMG will be an important beneficiary of this shift, as the power of its immense high quality artist roster will result in a greater share of streaming royalties.
Ultimately, UMG is the dominant player in an oligopolistic industry with decades-long secular growth. UMG’s market presence should allow it to successfully navigate technological change and take its fair share of improving industry economics, as it has done numerous times over its multi-decade history. Given UMG’s continued strong market positioning and long runway for sustained earnings growth, we believe that the company’s current valuation represents a discount to its intrinsic value.
Chipotle (“CMG”)
Chipotle’s business strength continued in 2023, driven by the company’s focus on exceptional food and operational excellence. During the second quarter, Chipotle grew same-store sales by 7.4%, or 40% from 2019 levels. Transactions grew 4.4%, a sequential improvement compared to the first quarter, and price increases from 2022 contributed 5.5% offset somewhat by a shift from group to individual orders which was a 2.5% headwind. The negative group to individual impact should shrink in the balance of the year and cease to be a headwind as we enter 2024.
Chipotle’s ongoing traffic momentum is fueled by improving in-restaurant execution and its continued cadence of successful menu innovation. The current limited time offering, chicken al pastor, is ordered in one out of every five transactions. Management plans to launch a new limited time offering later in the third quarter. Unlike most competitors, Chipotle has not yet taken pricing in 2023, thereby further improving its industry-leading value proposition. Management did, however, signal its openness to increasing menu prices later this year if cost inflation persists.
Chipotle’s compelling unit economics remain firmly intact, with restaurant-level margin of 27.5% in the second quarter, up 2.3 percentage points year-over-year. Management is optimistic on the opportunity to leverage automation technology to increase restaurant throughput and profitability. Technologies currently in testing include a dual-sided grill that may be rolled out in the medium term, which can reduce cooking times for chicken and steak by up to 75% while improving consistency and taste. Longer-term technology initiatives include a fully automated assembly line for digital orders.
The company remains on track to grow its store base in North America by approximately 8% this year with a longer-term annual store growth target of 10% once permitting and inspection headwinds abate. Chipotle is also laying the foundations for international development beyond its first successful growth market in Canada. Management has been recently investing resources in its company-owned European operations, including sending one of its top U.S. operators to Europe. In July, Chipotle announced its first ever international franchise agreement, which will cover the Middle East in partnership with Alshaya Group, with the first restaurants expected to open in Kuwait and the UAE in 2024.
Restaurant Brands (“QSR”)
QSR’s franchised business model is a high-quality, capital-light, growing annuity that generates high-margin brand royalty fees from its four leading brands: Burger King, Tim Hortons, Popeyes, and Firehouse Subs. QSR’s various initiatives are leading to more consistent growth across each of its brands, as demonstrated by its first half results which were well above investors’ expectations with accelerating same-store sales trends each quarter. We believe that the addition of Patrick
Doyle as Executive Chair of the company has already made a material contribution to the company’s operating trajectory.
Burger King’s international business, which represents more than half of the brand’s profits reported same-store sales, were more than 30% above pre-COVID levels, in-line with best-in-class peers. Management is focused on replicating Burger King’s international success in the U.S. through its “Reclaim the Flame” program. While the company is in the early stages of implementing the program, it is already seeing positive results, with domestic same-store sales reaching 11% above pre-COVID levels during the second quarter. With the majority of the funds earmarked for advertising and store refreshes yet to be deployed and a larger store remodeling effort now underway, the brand’s results should continue to improve.
Tim Hortons in Canada achieved same-store sales of 15% above pre-COVID levels due to improving traffic trends and new products in the afternoon food and cold beverage categories. Despite having nearly 70% market share in hot beverages and breakfast, Tim Hortons continues to gain share in each category.
QSR’s smaller brands, Popeyes and Firehouse, are continuing to grow well, with management accelerating unit growth at both brands. We believe QSR can grow its restaurant count at a mid-single-digit rate for the foreseeable future, with management committing to unit growth accelerating to 5% next year.
Despite improving brand performance and continued strong unit growth, QSR trades at a discount to both our view of its intrinsic value and its peers, which have lower long-term growth potential. Given higher interest rates, the company is currently reducing leverage rather than repurchasing shares. We expect the company to return to repurchasing shares once it has reached its leverage target.
Hilton (“HLT”)
Hilton is a high-quality, asset-light, high-margin business with significant long-term growth potential. In the first half of 2023, Hilton generated robust revenue growth. In the second quarter, HLT’s revenue per room (“RevPAR”), the industry metric for same-store sales, increased 12% as compared to 2022. Recent quarters continue to benefit from stable demand and rising rates driving leisure growth to new highs, while business transient continues to sequentially accelerate, with group sales just now approaching pre-COVID levels.
While net managed and franchised units grew 4% year-over-year during the most recent quarter, slightly below the full year target which Hilton adjusted to approximately 5% per annum, net unit growth (“NUG”) is poised to accelerate in the back half of the year. While management anticipates NUG of approximately 5% this year, they anticipate it will accelerate to 5-6% in 2024 and return to its historical 6-7% range over the next several years. Net unit growth is poised to accelerate in 2024 as Hilton begins to roll out its new premium economy and long-term-stay concepts (Spark and H3, respectively) and as international development activity accelerates. Hilton signed more than 36,000 rooms in the quarter, the largest quarterly signing in the company’s history. The company’s pipeline includes 441,000 rooms with approximately 50% under construction.
Hilton’s RevPAR is now ~9% above the comparative 2019 period even though systemwide occupancy remains 3-4 percentage points below “normal.” RevPAR growth has been supported by an increase in average daily rate (“ADR”), resulting from strong consumer demand, a positive mix-shift from large corporations to small and medium-sized businesses within the business transient market, and broad inflationary pressures in recent years. ADRs have largely stabilized 10% to 15% above 2019 levels (representing 3-4% compound annual growth) while occupancy continues to improve, driven by the longer-tail recovery of large corporate transient business travel occasions and group business. These factors, combined with strong and accelerating international RevPAR growth, position HLT for a strong 2023.
Over the medium-term, Hilton stands to benefit from continued RevPAR growth (which historically grows at a premium to inflation), the acceleration of net unit growth back to Hilton’s historical industry-leading cadence of 6% to 7%, and continued strong growth from non-RevPAR fee earnings. Strong revenue growth combined with Hilton’s excellent cost control, high incremental margins, and substantial capital return program should drive robust earnings growth for the foreseeable future.
Despite Hilton’s unique business model and attractive long-term earnings algorithm, the stock remains attractively priced at approximately 24 times forward earnings. We find Hilton’s valuation to be compelling given its industry-leading competitive position, superb management team, attractive long-term net unit growth algorithm, and best-in-class capital return policy.
Lowe’s (“LOW”)
Lowe’s is a high-quality business with significant long-term earnings growth potential operated by a superb management team that has been successfully executing a multi-faceted business transformation. In recent quarters, industrywide sales have retrenched slightly, driven by record lumber deflation, moderation in DIY discretionary demand (particularly with big-ticket items), a mix-shift from large to smaller Pro-specific projects, and a general trend of consumers reallocating budgets from goods to services. Sales remain elevated relative to 2019 baseline levels driven by a combination of price and mix, while units have largely normalized. Against this backdrop, Lowe’s headline same-store-sales growth has been modestly negative, offset by material margin expansion and the benefits of Lowe’s best-in-class share buyback program positioning the company to generate roughly flat earnings growth in 2023.
Lowe’s remains well positioned to manage through uncertainty. Nearly two-thirds of Lowe’s revenue comes from nondeferrable repair and maintenance activity, which is comparatively insulated from the macroeconomic environment. Lowe’s continues to make progress on various business initiatives that should aid the company’s ability to improve share and grow revenue even in challenging macro environments. Select initiatives for 2023 include the continued rollout of Lowe’s marketbased delivery model (now >60% complete, a critical component of Lowe’s business transformation objectives), a new 300-store rural localization merchandising program, and enhancements to Lowe’s MVP Pro Rewards program.
While the near-term macroeconomic picture remains uncertain, the medium-to-long-term backdrop for home improvement remains highly favorable. The home improvement market is driven by a confluence of variables, including the continued aging of the country’s housing stock, a national housing shortage, the lack of new builder inventory, continued post-COVID-19 hybrid work environments, high levels of home equity (vs. pre-COVID-19 levels), and Millennial cohorts entering homeownership for the first time. In addition, a substantial majority of homeowners are unable or unwilling to move as they would lose the benefits of their low-cost, long-term mortgages. As a result, in order to accommodate their needs, homeowners must renovate or add additions to their current home, which drives significant incremental demand in the home improvement business.
In addition to a constructive medium-term view on home improvement, we remain confident in Lowe’s business transformation prospects over the coming years. Notwithstanding our views on Lowe’s attractive long-term earnings outlook, Lowe’s currently trades at less than 16 times forward earnings, a low valuation for a business of this quality, and a substantial discount to its direct competitor, Home Depot which trades at a price-earnings multiple of nearly 22 times. We are highly confident in management’s ability to execute and expect that Lowe’s will continue to generate high rates of return for shareholders.
Howard Hughes (“HHH”)
HHH’s high-quality collection of well-located master planned communities (“MPC”) delivered resilient performance in the first half of 2023 led by a strong recovery in the housing market and robust leasing momentum in the company’s income producing operating assets.
Mortgage interest rates have stabilized this year after rapidly rising in 2022. The supply of home resale inventory remains constrained as homeowners are reluctant to sell their existing homes and incur more expensive mortgages. As a result, there has been a resurgence in demand for newly built homes. Amidst that backdrop, the relative affordability of HHH’s MPCs, which are located in low cost-of-living and low-tax states like Texas and Nevada, remains highly appealing to prospective homebuyers. New home sales in HHH’s MPCs increased 11% year-over-year in the first half of 2023, reflecting strong demand for future land sales and causing the company to raise its guidance for full-year 2023 MPC land sale profits by 20%.
In HHH’s income-producing operating assets, net operating income (“NOI”) grew 6% on a same-store basis during the first half of the year driven by improving leasing velocity and strong rental rate growth. The company’s office portfolio is benefiting from a “flight to quality” as companies and their employees are drawn to the desirability of HHH’s walkable and amenity-rich MPCs. Likewise, in the company’s condominium development at Ward Village, Hawaii, HHH continues to experience durable sales momentum with its latest condo tower already 83% pre-sold within nine months of its launch. In the most recent quarter, the company contracted to sell 43 units, representing an impressive 27% of available unit inventory. At its Seaport development in New York City, the company is focused on driving operational improvements at the recently opened Tin Building food hall, which continues to generate operating losses in its first full year of operations.
HHH is well positioned to navigate what remains a challenging financing environment across the real estate industry. Relative to other real estate companies, HHH’s unique ability to self-fund development with cash flow from land sales and operating assets substantially mitigates its dependency on the capital markets. The company has $390 million of cash on its balance sheet and 100% of the company’s debt is fixed, capped or hedged, with approximately 87% of the balance due in 2026 or later.
The company recently announced its 2023 Investor Day will be held in New York City on September 6th which we believe will be another opportunity for management to highlight HHH’s resilient business model and decades-long growth trajectory.
Canadian Pacific Kansas City Limited (“CPKC”)
CPKC is a high-quality business with significant earnings growth potential that operates in an oligopolistic industry with considerable barriers to entry and significant pricing power due to its high quality competitive transportation offering. After receiving regulatory approval from the Surface Transportation Board on March 15, Canadian Pacific closed the acquisition of Kansas City Southern on April 14 th and renamed the combined company Canadian Pacific Kansas City.
The combination with KCS is an incredible accomplishment for CPKC’s industry-leading management team. CPKC is the first and only single-line railroad linking Canada, the United States, and Mexico. Not only does the combination create tremendous growth opportunities for CPKC, but it also increases competition in the rail industry overall, improving transportation options for shippers, and reducing greenhouse gas emissions by shifting more freight from truck to rail.
While it has only been several months, the management team has hit the ground running and already announced numerous contract wins in the midst of integrating the two networks. In June, CPKC held its inaugural Investor Day as a combined company that highlighted the many growth opportunities unlocked by leveraging CPKC’s unique three-country network, and provided 2024-2028 financial targets. If CPKC were to achieve these targets, the company’s earnings-per-share would increase to over $8 by 2028, or more than double the current level. In summary, the substantial revenue and cost synergies realized from the merger should lead to accelerated earnings growth for the foreseeable future.
Despite CPKC’s attractive long-term earnings outlook, the stock continues to trade at a discount to our view of intrinsic value and its closest peer, Canadian National. We believe the magnitude of synergies is larger and the path for realization is longer than investors originally anticipated, providing CPKC with profitable long-term growth and catalyzing share price appreciation in the years to come.
Fannie Mae (“FNMA” or “Fannie”) and Freddie Mac (“FMCC or “Freddie”)
In our view, Fannie Mae and Freddie Mac remain valuable perpetual options on the companies’ exit from conservatorship.
Both entities continue to build capital through retained earnings which has increased their combined capital to $111 billion. There have not been any material updates since PSH’s 2022 Annual Report. We believe that it is simply a matter of when, not if, Fannie and Freddie will be released from conservatorship.
Pershing Square SPARC Holdings, Ltd (“SPARC”)
Significant progress has been made towards the launch of SPARC. While there is no guarantee that all of the required approvals will be obtained, we have cleared significant hurdles and continue to be cautiously optimistic that the registration statement for SPARC’s distribution of SPARs will soon become effective, which would allow SPARC to begin to seek a potential merger transaction.
We have discussed SPARC’s structure in detail in prior communications, including most recently in PSH’s 2022 Annual Report . In summary, SPARC offers a private company the opportunity to go public at a fixed price and raise a guaranteed minimum amount of capital from the Pershing Square funds without any of the highly dilutive SPAC founder stock or shareholder warrants of a typical SPAC and without any underwriting fees. We expect that a merger with SPARC will be an efficient way for a private company to go public, even in a highly challenging capital markets environment.
SPARC will expand our investment universe to include private companies who wish to go public, a potentially target rich environment in today’s difficult IPO market.
PUBLIC COMPANY ENGAGEMENT SINCE INCEPTION (17)
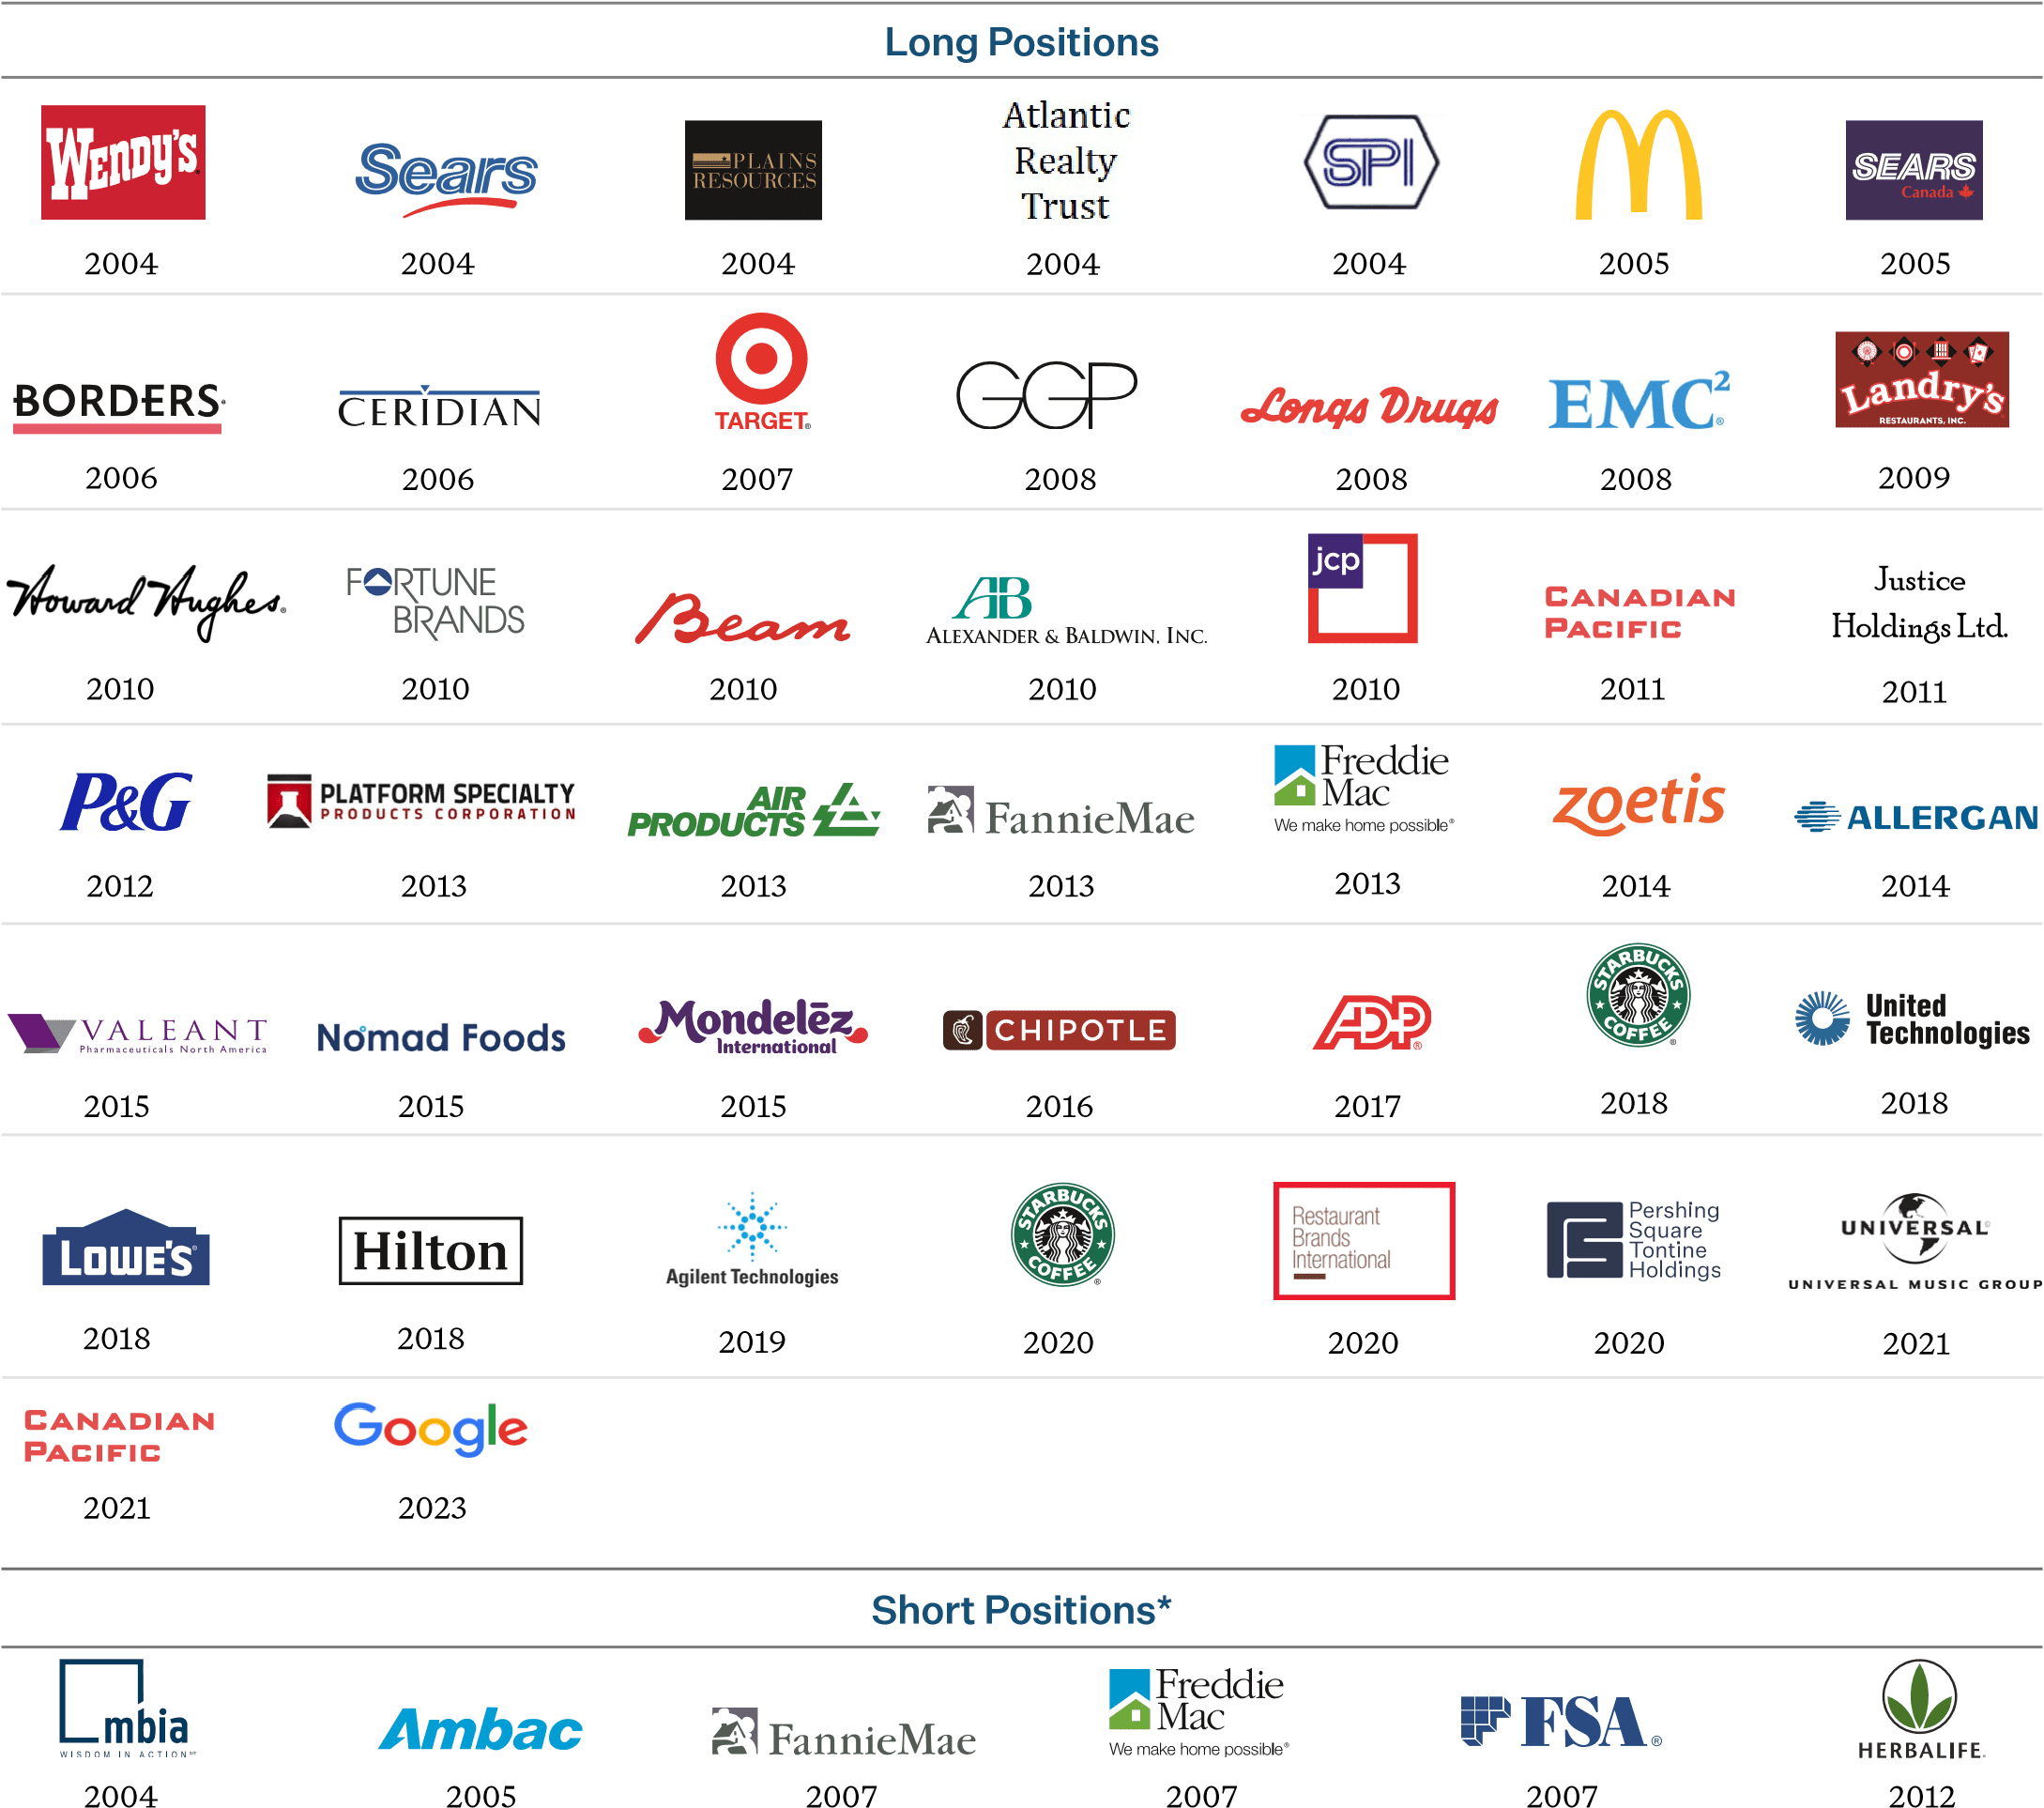
| * Short Positions includes options, credit default swaps and other instruments that provide short economic exposure. Pershing Square has no current intention to initiate a public equity short position. |
The companies on this page reflect all of the portfolio companies, long and short, between Pershing Square’s inception and August 15, 2023, in respect of which ((a)) Pershing Square or any Pershing Square fund, as applicable, has designated a representative to the board, filed Schedule 13D, Form 4 or a similar non-US filing or has made a Hart-Scott Rodino filing; or ((b)) Pershing Square has publicly recommended changes to the company’s strategy in an investment-specific white paper, letter or presentation.
Past performance is not a guarantee of future results. All investments involve risk, including the loss of principal. Please see accompanying endnotes and disclaimers on pages 46-49.
Footnotesa https://pershingsquareholdings.com/wp-content/uploads/2018/03/2017-Annual-Report.pdf b Source: Investec Research Report on PSH (“Reaping the rewards of a strategic pivot, and fundamentally mispriced”), published June 30, 2023. Peer group incorporates all constituents of the AIC North America and IA North America sectors. |
Editor's Note: The summary bullets for this article were chosen by Seeking Alpha editors.
For further details see:
Pershing Square Holdings 1H 2023 Letter To Shareholders