PFFD - PFFD: Best Among Its Peers Fundamentally Some Technical Improvements
2023-07-21 13:02:53 ET
Summary
- The Global X U.S. Preferred ETF (PFFD) is recommended for its attractive metrics, including a low expense ratio and high yield potential.
- The ETF is heavily weighted in the Financials sector and has a significant overweighting in Utilities, posing a risk of underperformance in a tech-led market.
- Despite some risks, the PFFD is considered a good choice for yield-focused investors, offering yields about a full percentage point above investment-grade corporate bonds.
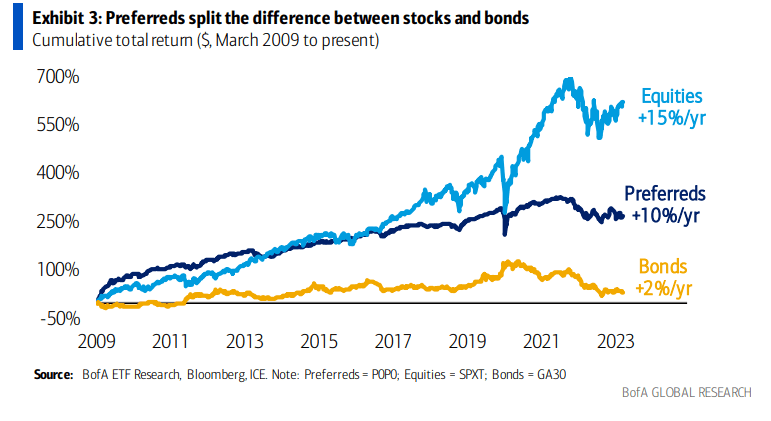
Preferred stocks are like hybrids between bonds and common equities. Since 2009, the group has compounded at a 10% clip, according to BofA Global Research , solidly above US fixed income while not featuring as steep of declines during bear markets as stocks. The downside is that preferred stocks tend to be highly weighted in the Financials sector, which means ETFs in the arena will likely underperform in a tech-led and value-neglected regime.
Still, I am initiating coverage on the Global X U.S. Preferred ETF (PFFD) with a buy for its relatively attractive metrics.
Preferreds: Your Stock/Bond Middle Child
According to the issuer , PFFD invests in a broad basket of preferred stock in the U.S., an asset class that has historically offered high yield potential. Its expense ratio is less than half the competitors' average, per Global X, while the fund has made monthly distributions 5 years running. The ETF seeks to provide investment results that correspond generally to the price and yield performance, before fees and expenses, of the ICE BofA Diversified Core U.S. Preferred Securities Index.
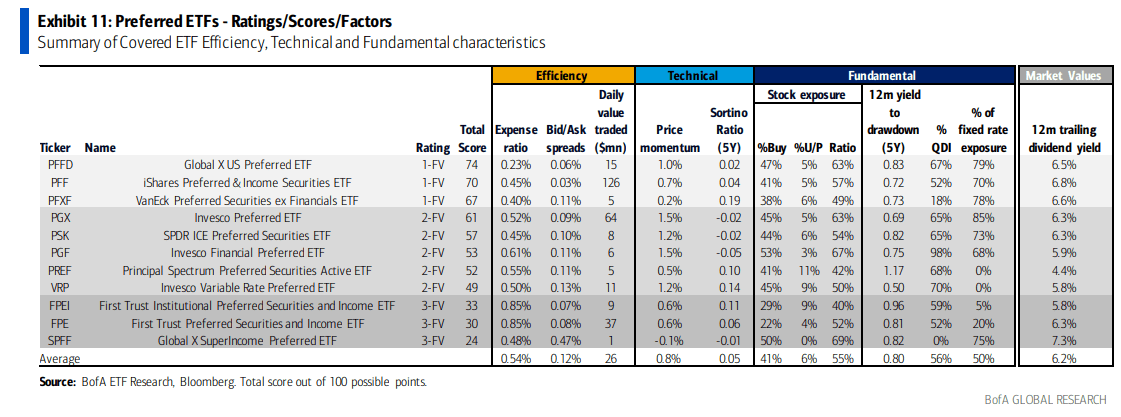
With its inception in 2017, the ETF holds 231 securities with total assets under management of $2.26 billion as of June 30, 2023. Its expense ratio is indeed attractive at just 0.23% as of the most recent quarter-end, while its trailing 12-month distribution yield is high at 6.5% as of July 20, 2023. What I also like is that tradeability with PFFD is strong as evidenced by its low 0.05% 30-day median bid/ask spread, though volume is less than 600,000 shares daily over the last three months.
Compared to its peers, PFFD stands out. Its low cost, high liquidity, decent momentum, and relatively elevated dividend payout rate make it a winner in my view. With rates currently near 13-year highs in the preferred stock space, it is certainly a niche to consider for yield-focused investors in today's environment of arguably richly priced domestic large-cap equities. Investors in the fund can capture yields about a full percentage point above the rates on investment-grade corporate bonds, too.
PFFD: Top Of The Preferred Stock ETF Pack
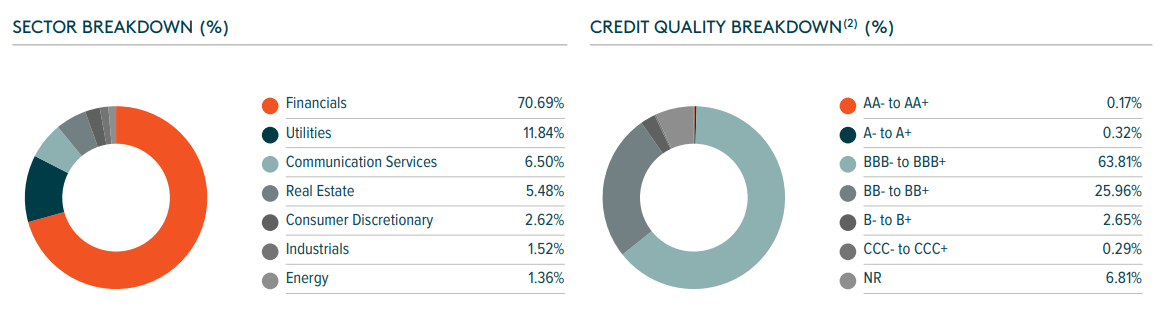
Digging into the portfolio, notice in the pie charts below that there are key risks to consider with PFFD. The allocation is heavily weighted into the Financials sector, with a significant overweighting in Utilities, as well. There is hardly any growth, so if we see more outperformance among TMT sector stocks, then this preferred stock portfolio will likely underperform.
Also, over on the right, PFFD's credit quality exposure is decent, but not of the highest quality. So, if a credit crunch ensues in the second half, then there is the risk of weak absolute performance. A sweet spot, though, is if rates ease back without a hard economic landing as well as the value style mean-reverting relative to the hot growth style in 2023.
PFFD: Portfolio Breakdown
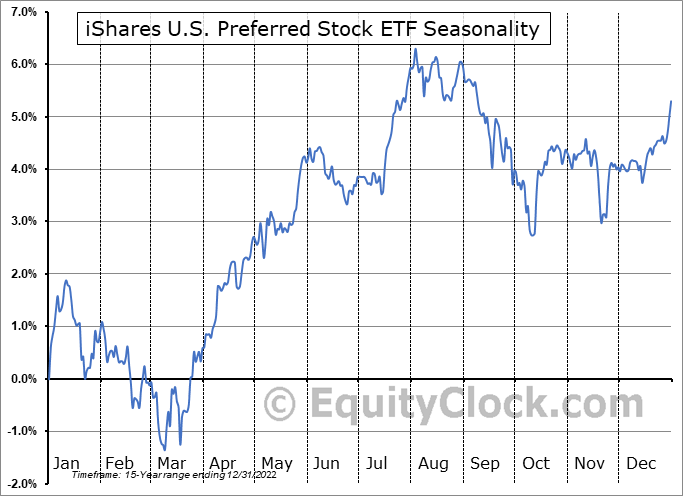
Seasonally, preferred stocks, as measured by the iShares U.S. Preferred Stock ETF (PFF) as a proxy, in the chart below from Equity Clock shows that the group generally performs poorly from early August through mid-October. This is a bearish signal to consider as Q3 presses on.
Preferred Equities: Bearish Seasonal Trends Next Few Months
The Technical Take
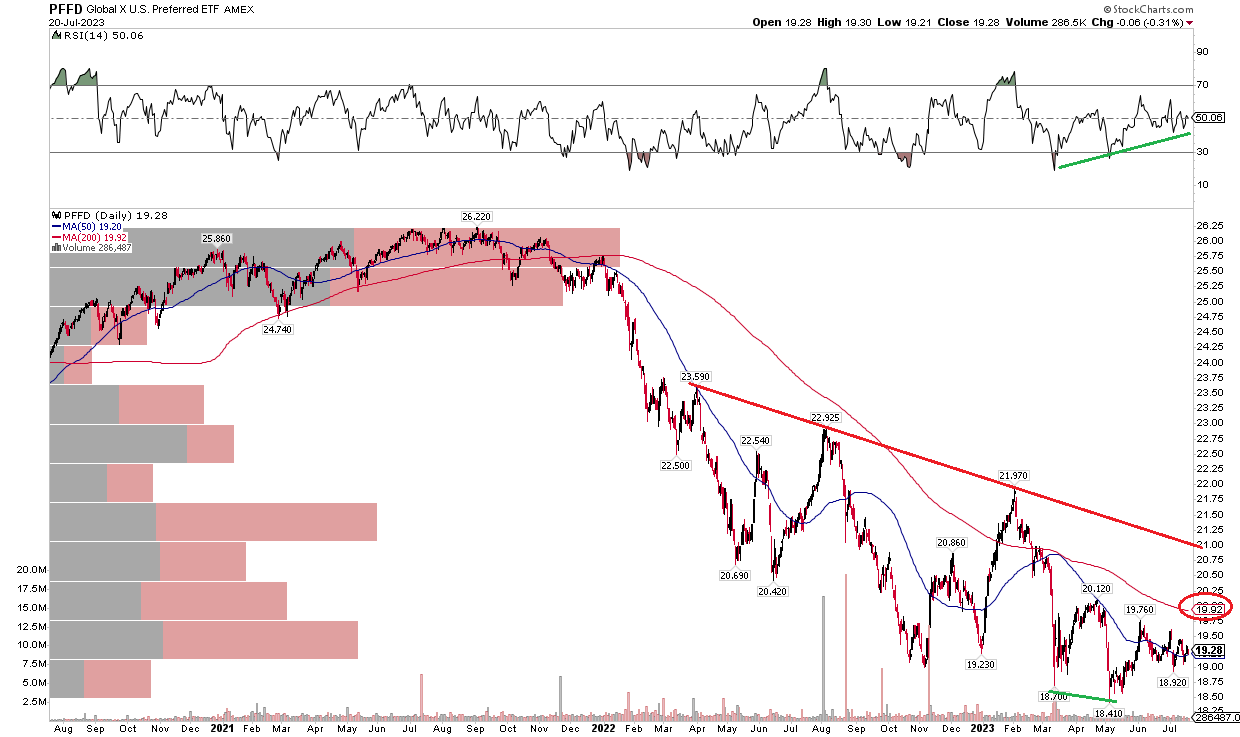
I am always a bit less confident with my charting analysis when we are dealing with a high-yield fund, particularly one that has fixed-income-like exposure. Still, there are some signs that PFFD is bottoming out. Notice in the chart below that the ETF notched a bullish RSI momentum divergence when shares made a new low in price back in May.
While the RSI gauge at the top of the graph is trending up, I would like to see PFFD climb above its falling 200-day moving average to help support the case that a new uptrend is underway. There is also a downtrend resistance line that comes into play currently around $21 which could be problematic. Overall, the technical situation is not great, and it has underperformed sharply compared to the broad equity market while being more volatile than bonds.
PFFD: Bullish RSI Divergence, But A Downtrend Remains In Place
The Bottom Line
I have a buy rating on PFFD. While I do not suggest dabbling too much in the preferred stock space, this is an ideal fund to own if you are going to do so. What's more, there are some signs that the fund could be bottoming, and a further rotation into Financials and a top in yields would help PFFD.
For further details see:
PFFD: Best Among Its Peers Fundamentally, Some Technical Improvements