PGTI - PGT Innovations: Best Nearby Building Industry Capital Gain Prospect
Summary
- Forecasts of its price change come from hedging actions taken to protect at-risk capital ventured by best-informed, experienced market-making community.
- Prior market outcomes of same-as-today’s forecast R/R balance measured by odds for and size of profitability, length of holding required, interim worst loss exposure.
- Comparison with over 3,000 equity alternatives, on same tests of their prior outcomes of their as seen-today forecasts for how big, how sure, how soon net benefits may be likely.
- Our standard of Market-Maker Near-term best Price Range Forecasts is used to select the subject, but we compare it to differently chosen alternative investment candidates.
- Alternatives include those identified by Yahoo Finance as being “similar to” the subject, or stocks which “people also watch” as well as the subject.
Investment Thesis
We look to the hedging actions of Market-Makers to protect their at-risk capital endangerment required by the automation achieved by markets in serving a continuing flow of individual investor small trades instead of irregular huge-value “institutional” transactions.
The pricing and structure of such hedges reveal the coming-price expectations of both the MM protection-buyers and that of the MM industry protection-sellers.
Our selection of PGT Innovations, Inc. ( PGTI ) is prompted by its currently-attractive stock pricing coupled by a large following of Seeking Alpha readers.
Description of the Subject Company Activities
“ PGT Innovations, Inc., together with its subsidiaries manufactures and supplies impact-resistant aluminum frame windows and doors in the United States and internationally. The company provides heavy-duty aluminum or vinyl frames with laminated glass to provide protection from hurricane-force winds and wind-borne debris; and non-impact resistant vinyl windows with insulating glass and multi-chambered frames for various climate zones. The company serves window distributors, building supply distributors, window replacement dealers, and enclosure contractors. The company was formerly known as PGT, Inc. and changed its name to PGT Innovations, Inc. in December 2016. PGT Innovations, Inc. was founded in 1980 and is headquartered in North Venice, Florida.”
Source: Yahoo Finance
Yahoo Finance
These growth estimates have been made by and are collected from Wall Street analysts to suggest what conventional methodology currently produces. Here there was limited analyst coverage. The typical variations across forecast horizons of different time periods illustrate the difficulty of making value comparisons when the forecast horizon is not clearly defined.
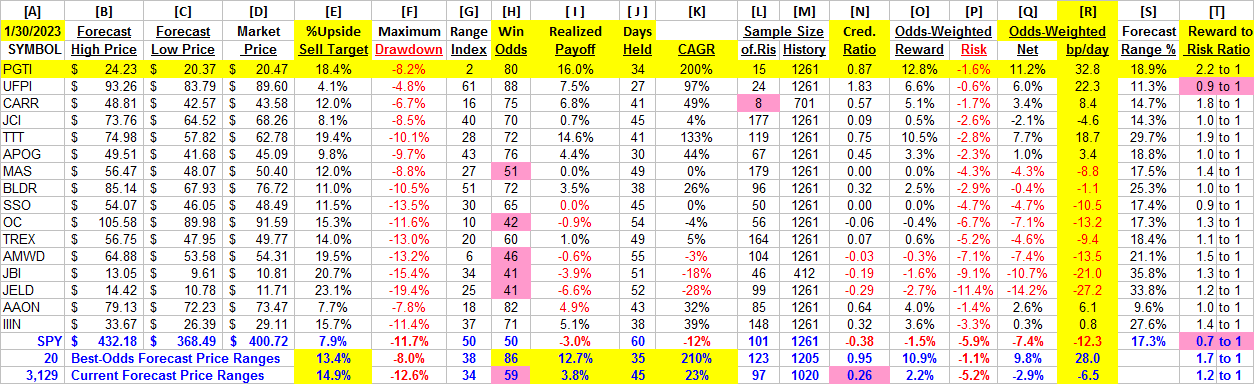
Risk~Reward Comparisons of Portfolio Investment Candidates
Figure 1
blockdesk.com (used with permission)
The tradeoffs here are between near-term upside price gains (green horizontal scale) seen worth protecting against by Market-makers with short positions in each of the stocks, and the prior actual price drawdowns experienced during holdings of those stocks (red vertical scale). Both scales are of percent change from zero to 25%.
The intersection of those coordinates by the numbered positions is identified by the stock symbols in the blue field to the right.
The dotted diagonal line marks the points of equal upside price change forecasts derived from Market-Maker [MM] hedging actions and the actual worst-case price drawdowns from positions that could have been taken following prior MM forecasts like today's.
Our principal interest is in PGTI at location [14]. A "market index" norm of reward~risk tradeoffs is offered by SPDR S&P500 index ETF at [8] in an unusually poor competitive condition.
Those forecasts are implied by the self-protective behaviors of MMs who must usually put firm capital at temporary risk to balance buyer and seller interests in helping big-money portfolio managers make volume adjustments to multi-billion-dollar portfolios. The protective actions taken with real-money bets define daily the extent of likely expected price changes for thousands of stocks and ETFs.
This map is a good starting point, but it can only cover some of the investment characteristics that often should influence an investor's choice of where to put his/her capital to work. The table in Figure 2 covers the above considerations and several others.
Comparing Alternative Investments
Figure 2
Column headers for Figure 2 define elements for each row stock whose symbol appears at the left in column [A]. The elements are derived or calculated separately for each stock, based on the specifics of its situation and current-day MM price-range forecasts. Data in red numerics are negative, usually undesirable to “long” holding positions. Table cells with pink background “fills” signify conditions typically unacceptable to “buy” recommendations. Yellow fills are of data for the stock of principal interest and of all issues at the ranking column, [R].
Readers familiar with our analysis methods may wish to skip to the next section viewing price range forecast trends for PGTI.
Figure 2’s purpose is to attempt universally comparable answers, stock by stock, of a) How BIG the price gain payoff may be, b) how LIKELY the payoff will be a profitable experience, c) how soon it may happen, and d) what price drawdown RISK may be encountered during its holding period.
The price-range forecast limits of columns [B] and [C] get defined by MM hedging actions to protect firm capital required to be put at risk of price changes from volume trade orders placed by big-$ "institutional" clients.
[E] measures potential upside risks for MM short positions created to fill such orders, and reward potentials for the buy-side positions so created. Prior forecasts like the present provide a history of relevant price draw-down risks for buyers. The most severe ones actually encountered are in [F], during holding periods in effort to reach [E] gains. Those are where buyers are most likely to accept losses.
[H] tells what proportion of the [L] sample of prior like forecasts have earned gains by either having price reach its [B] target or be above its [D] entry cost at the end of a 3-month max-patience holding period limit. [ I ] gives the net gains-losses of those [L] experiences and [N] suggests how credible [E] may be compared to [ I ].
Further Reward~Risk tradeoffs involve using the [H] odds for gains with the 100 - H loss odds as weights for N-conditioned [E] and for [F], for a combined-return score [Q]. The typical position holding period [J] on [Q] provides a figure of merit [ fom ] ranking measure [R] useful in portfolio position preferencing. Figure 2 is row-ranked on [R] among candidate securities, with PGTI yellow-row identified.
Along with the candidate-specific stocks these selection considerations are provided for the averages of over 3000 stocks for which MM price-range forecasts are available today, and 20 of the best-ranked (by fom ) of those forecasts, as well as the forecast for S&P 500 Index ETF (NYSEARCA: SPY ) as an equity market proxy.
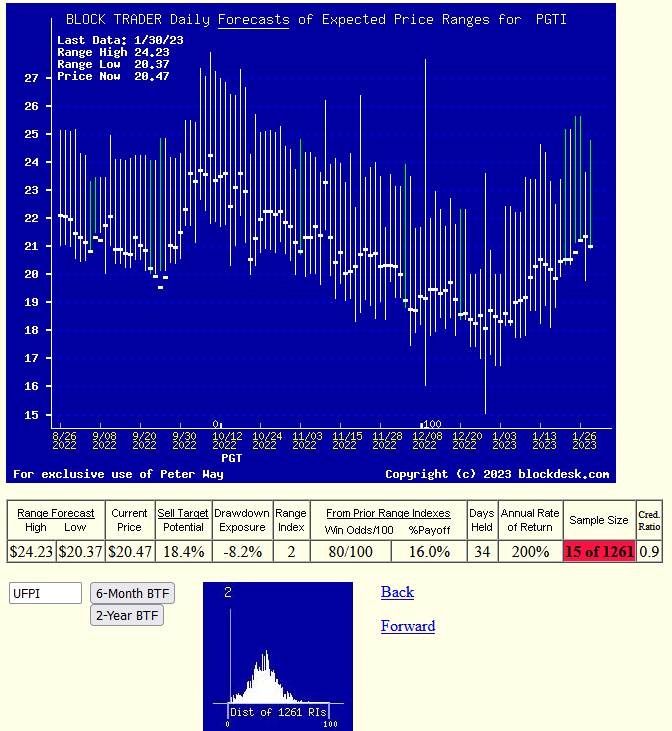
Recent Trends in MM Price-Range Forecasts for PGTI
Figure 3
This picture is not a “technical chart” of past prices for PGTI. Instead, it is the past 6 months of daily price range forecasts of market actions yet to come in the next few months. The only past information there is the closing stock price on the day of each forecast.
That data splits the price range’s opposite forecasts into upside and downside prospects. Their trends over time provide additional insights into coming potentials, and helps keep perspective on what may be coming.
The small picture at the bottom of Figure 3 is a frequency distribution of the Range Index’s appearance daily during the past 5 years of daily forecasts. The Range Index [RI] tells how much the downside of the forecast range occupies of that percentage of the entire range each day, and its frequency suggests what may seem “normal” for that stock, in the expectations of its evaluators’ eyes.
Here the present level is near its least frequent, lowest-cost presence, encouraging the acceptance that we are looking at a realistic evaluation for PGTI. With nearly all past RIs above than below the present RI there is more room for an even more positive outlook.
Conclusion
Among these alternative investments explicitly compared, PGT Innovations, Inc. appears to be a logical buy preference now for investors seeking near-term capital gain.
For further details see:
PGT Innovations: Best Nearby Building Industry Capital Gain Prospect