VLO - Phillips 66: The Stock Is Turning Attractive
2023-06-01 10:38:18 ET
Summary
- Phillips 66 reported first-quarter 2023 adjusted earnings per share of $4.21 from $1.32 a year ago, beating analysts' expectations.
- Total revenues were $35.09 Billion in 1Q23, down slightly from $36.72 billion a year ago.
- The quarterly dividend is now $1.05 per share or a yield of 4.58%.
- I recommend accumulating PSX between $91.5 and $90.5 with potential lower support at $89.5.
Introduction
Houston, Texas-based Phillips 66 (PSX) released its first quarter of 2023 on May 3, 2023.
Note: This article updates my December 5, 2022 article. I have followed PSX on Seeking Alpha since December 2018.
1 - 1Q23 snapshot
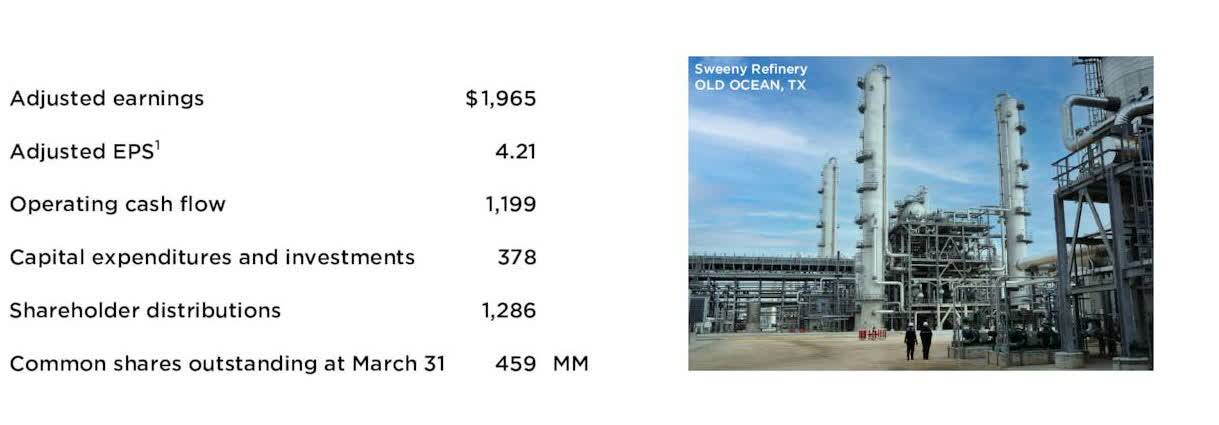
The company reported first-quarter 2023 adjusted earnings per share of $4.21, up from $1.32 a year ago, beating analysts' expectations. Quarterly solid earnings were due to robust refining margins worldwide.
Quarterly revenues totaled $35,089 million, down slightly from the year-ago quarter's $36,722 million.
PSX 1Q23 Review (PSX Presentation)
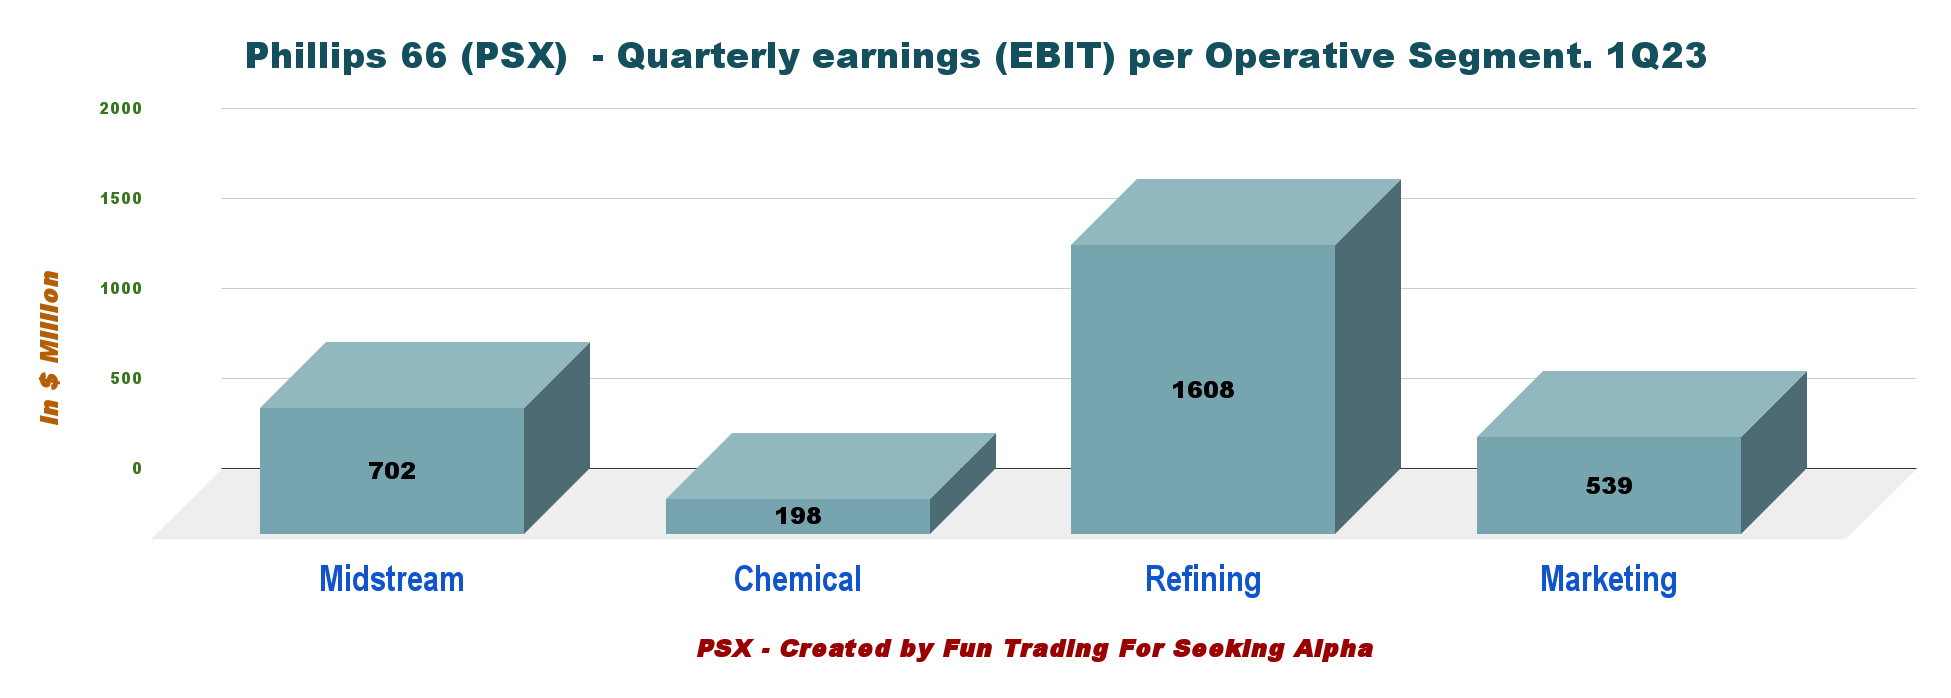
Phillips 66 operates in four segments (Midstream, Chemical, Refining, and Marketing).
The refining segment is the biggest part. Below are the quarterly earnings per segment:
PSX Quarterly Earnings 1Q23 (Fun Trading)
I regularly cover three refiners on Seeking Alpha. Phillips 66, Marathon Petroleum (MPC), and Valero Energy (VLO).
2 - Stock performance
Let's see how these three refiner stocks are doing compared to the VanEck Vectors Oil Refiners ETF (CRAK). Below is the year-to-date chart comparison using my three selected refiners and the VanEck Oil Refiner ETF.
As we can see, PSX is down 10% on a one-year basis, below MPC, with VLO underperforming the group. The refiner's group has dropped significantly in value since the peak in April 2023.
3 - Investment thesis
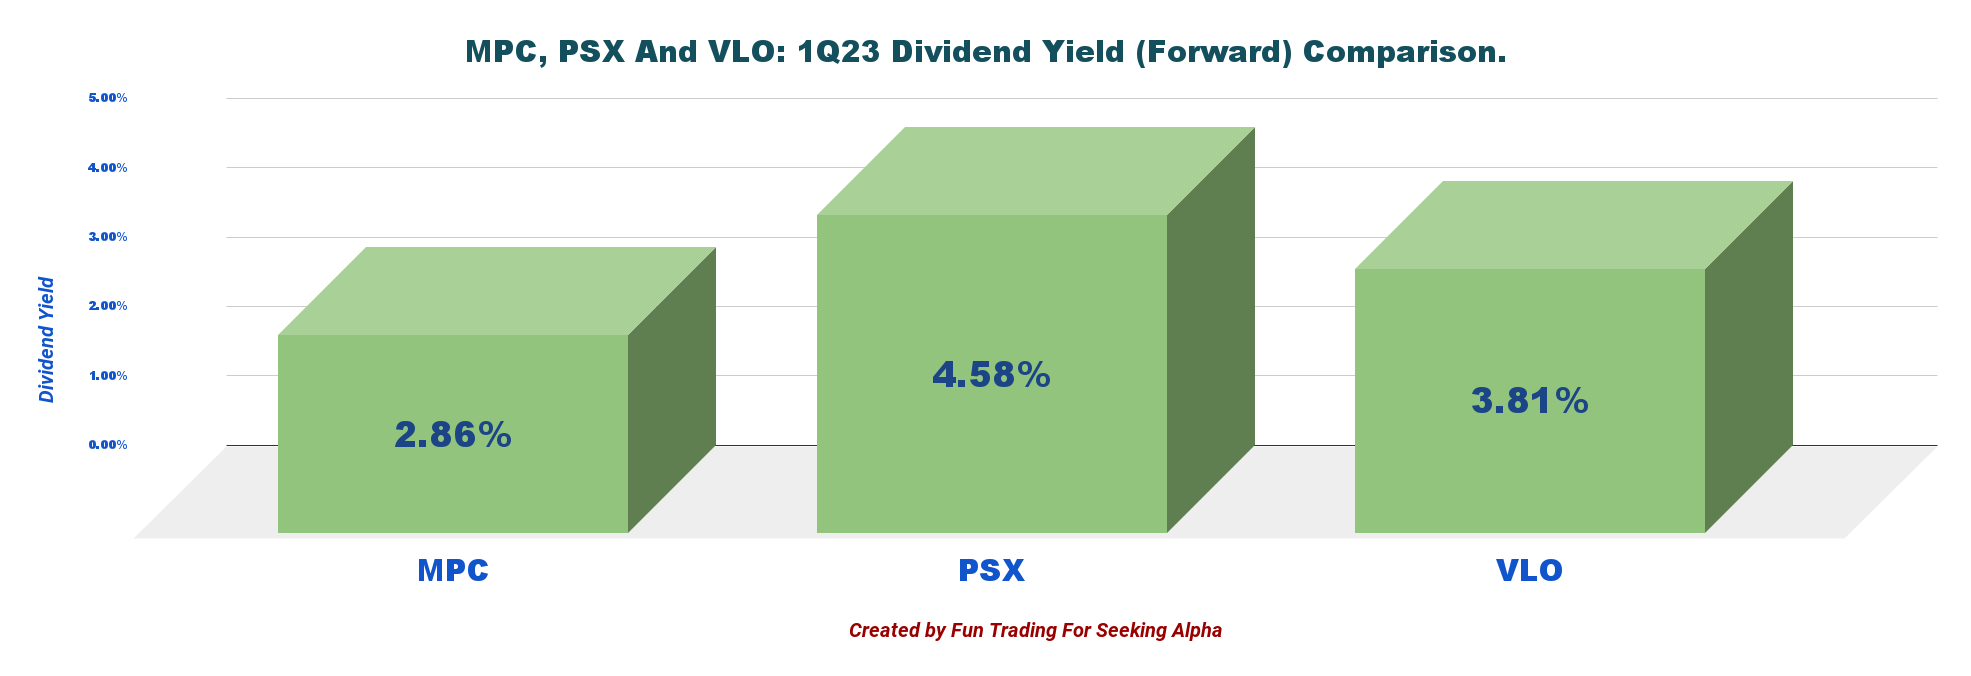
The investment thesis remains the same. Investors should view PSX as a long-term investment, and I recommend accumulating slowly, which offers a dividend yield of 4.58% now.
The crucial issue here is the extreme volatility of the industry and its tight correlation with oil and gas prices. However, demand is a vital element.
The biggest uncertainty for refiners is the outlook for demand, which will depend on the magnitude of any global economic slowdown and the pace of its recovery over the next few years.
This situation requires a particular trading/investing strategy I promote in my marketplace, "The gold and oil corner."
Thus, trading short-term LIFO and profiting from the wild fluctuations attached to this cyclical industry is essential. I recommend using about 40% of your short-term position, keeping a core long-term for a much higher target, or enjoying a steady stream of dividends. PSX pays a dividend yield of 4.58%, which is excellent.
PSX Quarterly Dividend yield comparison: MPC, PSX, VLO (Fun Trading)
Financials History: The Raw Numbers - First- Quarter 2023
| Phillips 66 |
| 1Q22 |
| 2Q22 |
| 3Q22 |
| 4Q22 |
| 1Q23 |
| Total revenues and other |
| 36.18 |
| 48.58 |
| 44.96 |
| 40.28 |
| 34.40 |
| Revenues in $ Billion |
| 36.72 |
| 49.31 |
| 48.76 |
| 40.91 |
| 35.09 |
| Net income in $ Million |
| 582 |
| 3,167 |
| 5,391 |
| 1,884 |
| 1,961 |
| EBITDA $ Million |
| 1,307 |
| 4,604 |
| 7,751 |
| 3,248 |
| 3,325 |
| EPS diluted in $/share |
| 1.29 |
| 6.53 |
| 11.16 |
| 3.97 |
| 4.20 |
| Operating cash flow in $ Million |
| 1,136 |
| 1,783 |
| 3,144 |
| 4,750 |
| 1,199 |
| CapEx in $ Million |
| 370 |
| 376 |
| 735 |
| 713 |
| 378 |
| Free Cash Flow in $ Million |
| 766 |
| 1,407 |
| 2,409 |
| 4,037 |
| 821 |
| Total cash $ million |
| 3,335 |
| 2,809 |
| 3,744 |
| 6,133 |
| 6,965 |
| Total LT Debt in $ million |
| 14,434 |
| 12,969 |
| 17,657 |
| 17,190 |
| 18,485 |
| Dividend per share in $ |
| 0.97 |
| 0.97 |
| 0.97 |
| 1.05 |
| 1.05 |
| Shares Outstanding (Diluted) in Million |
| 450.01 |
| 485.04 |
| 483.04 |
| 474.57 |
| 467.03 |
Source: Company filing
Analysis: Revenues, Earnings Details, Free Cash Flow, Net Debt, And Outlook
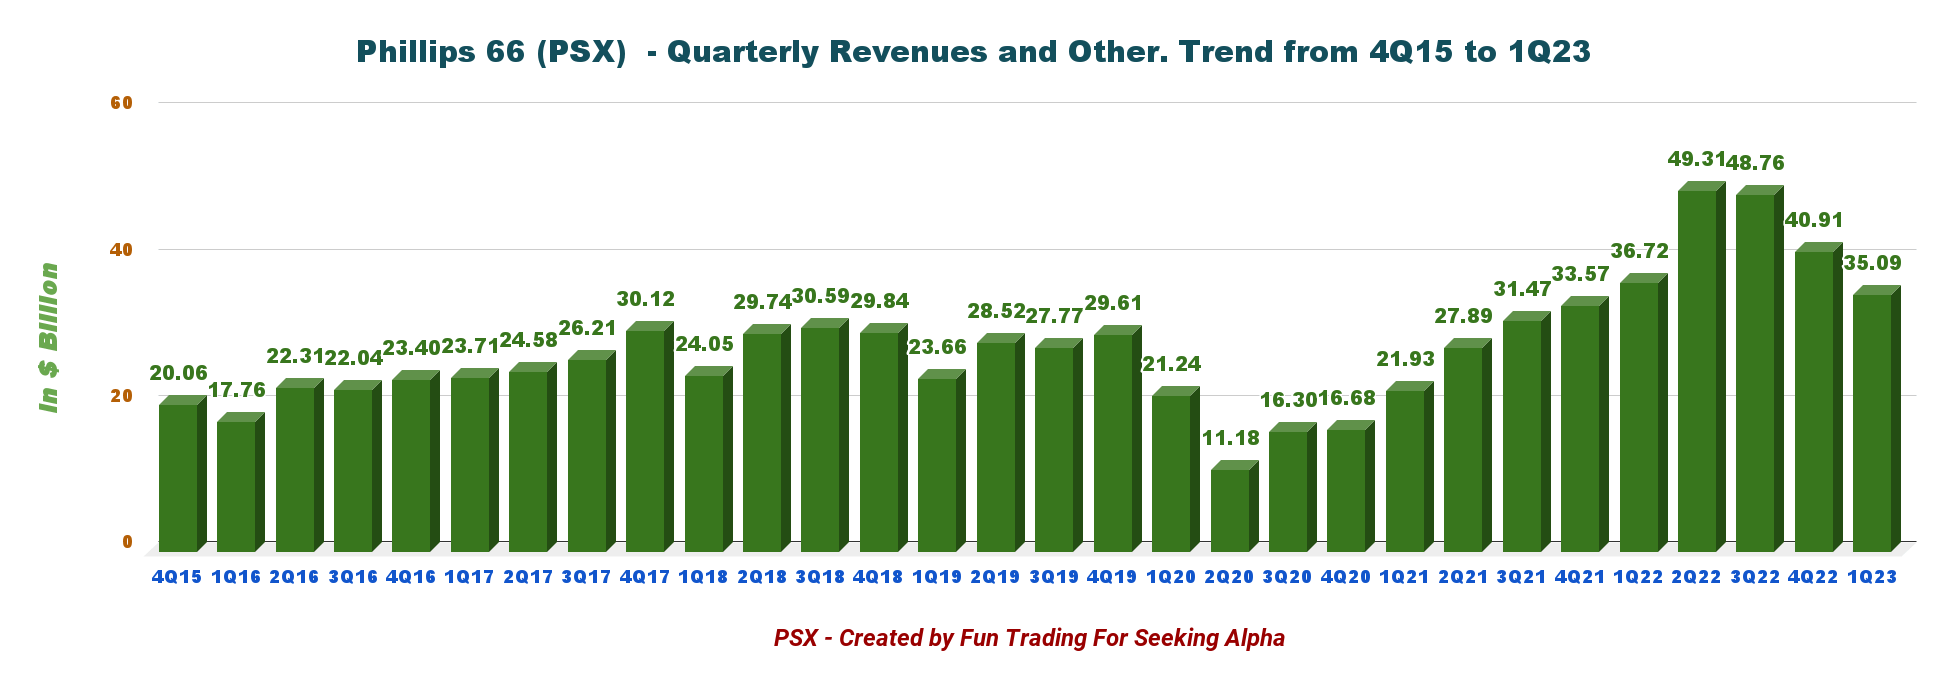
1 - Revenues were $35.09 billion in 1Q23
PSX Quarterly Revenues History (Fun Trading)
Phillips 66 posted a first-quarter 2023 income of $1,961 million or $4.20 per share. The first quarter's total costs and expenses declined to $32,438 million from $35,894 million in the year-ago period.
Total revenues were $35.09 Billion in 1Q23, down slightly from $36.72 billion a year ago.
1.1 - Midstream : The midstream segment generated adjusted pre-tax quarterly earnings of $678 million, up from $212 million in the year-ago quarter. The increase was due to higher revenue from NGL and others.
1.2 - Chemicals: The Chemicals segment registered adjusted pre-tax earnings of $198 million, down from $396 million in the prior-year quarter. The decrease was due to lower margins and volumes.
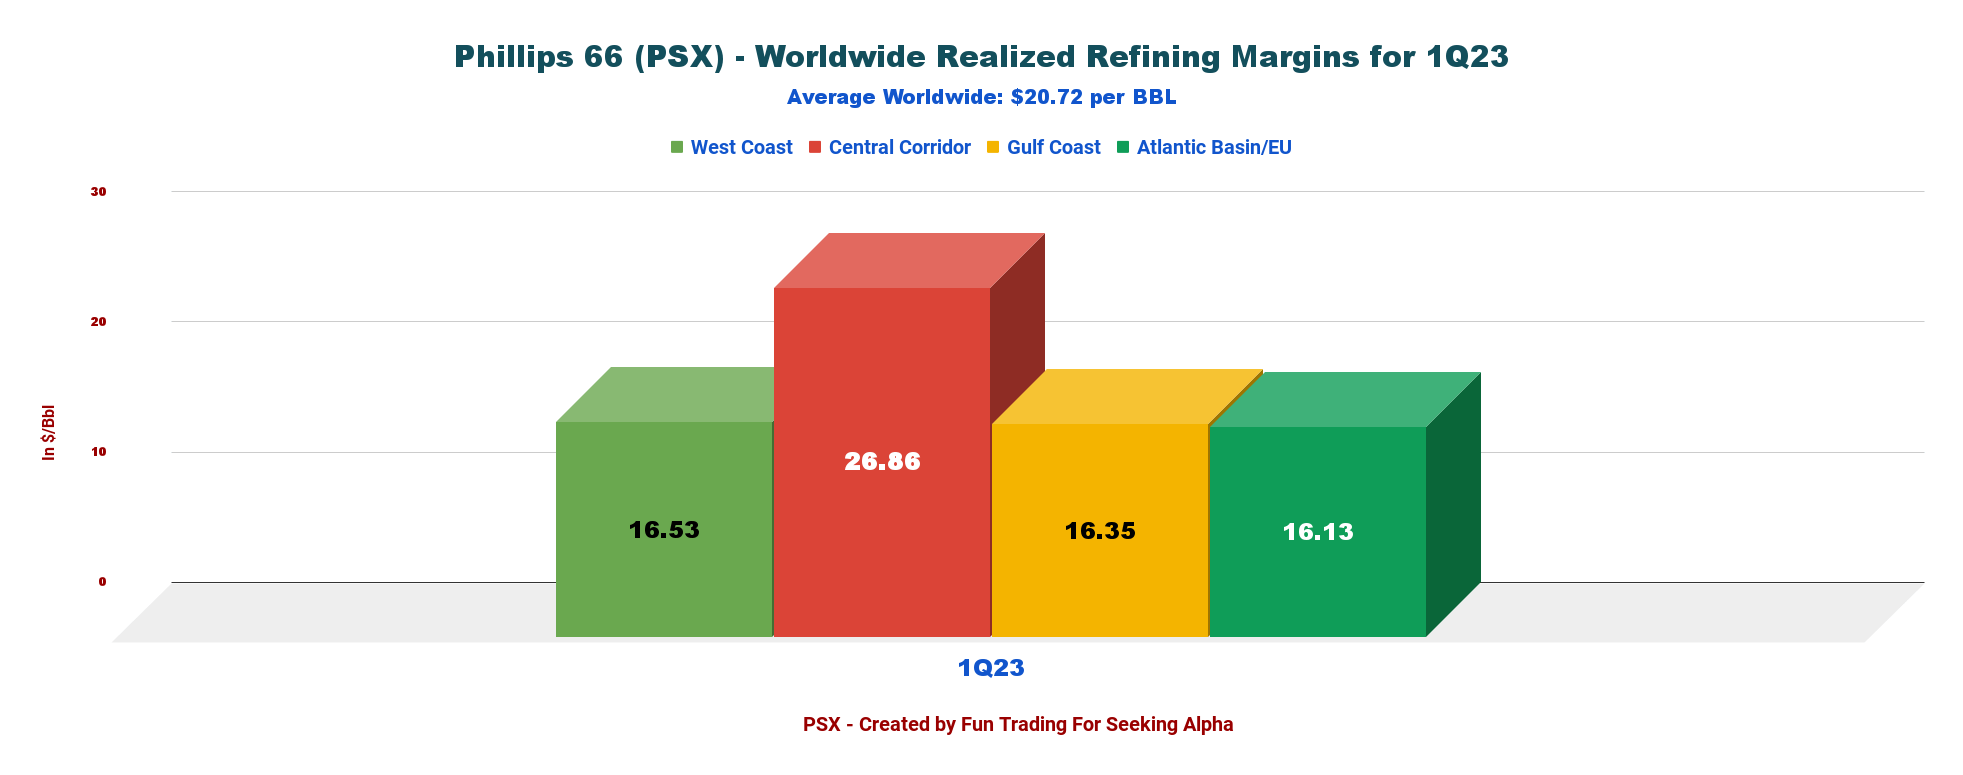
1.3 - Refining: The refining segment registered adjusted pre-tax earnings of $1,608 million, up from $190 million in the year-ago quarter. A large increase due to higher volumes and realized margins.
The segment's realized refining margins worldwide improved to $20.72 per barrel from the year-ago quarter's $10.83.
The Central Corridor and Atlantic Basin/Europe increased to $26.86 and $16.13 per barrel from the year-ago levels of $7.89 and $11.71.
The Gulf Coast increased to $21.28 per barrel from $8.59 in the prior-year quarter. However, the West Coast margins decreased from $17.74 per barrel in the year-ago quarter to $16.53 in 1Q23.
PSX 1Q23 Margins details (Fun Trading)
| $/bbl |
| 1Q22 |
| 2Q22 |
| 3Q22 |
| 4Q22 |
| 1Q23 |
| West Coast |
| 17.74 |
| 33.13 |
| 28.64 |
| 16.77 |
| 16.53 |
| Central Corridor |
| 7.89 |
| 26.72 |
| 38.76 |
| 25.03 |
| 26.86 |
| Gulf Coast |
| 7.71 |
| 24.80 |
| 21.29 |
| 21.28 |
| 16.35 |
| Atlantic Basin/EU |
| 11.71 |
| 30.39 |
| 19.22 |
| 19.58 |
| 16.13 |
| Worldwide |
| 10.83 |
| 28.31 |
| 26.58 |
| 19.73 |
| 20.72 |
Source: Fun Trading file.
1.4 - Marketing and specialties:
The Pre-tax earnings increased to $426 million from $296 million in the year-ago quarter.
Realized marketing fuel margins in the United States increased to $2.30 per barrel from the year-ago quarter's $1.59 per barrel.
The international markets increased to $6.45 from the year-ago level of $2.30.
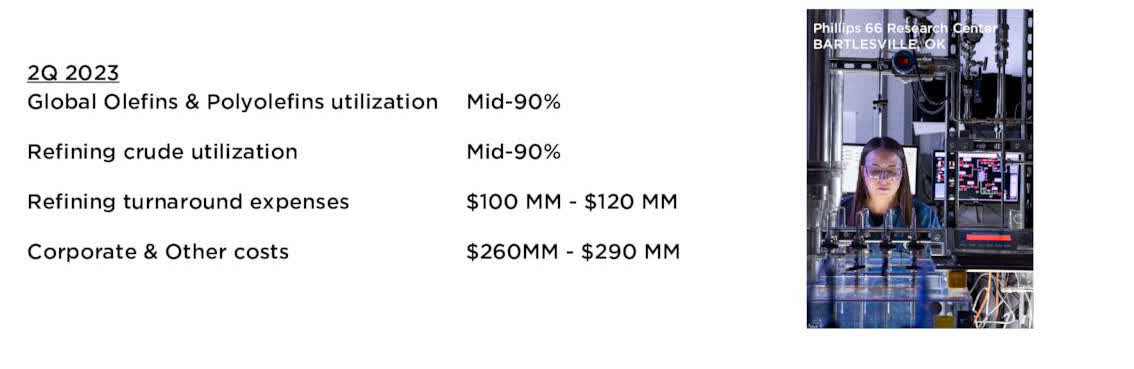
1.5 - Outlook 2Q23
PSX 2Q23 Outlook (PSX Presentation)
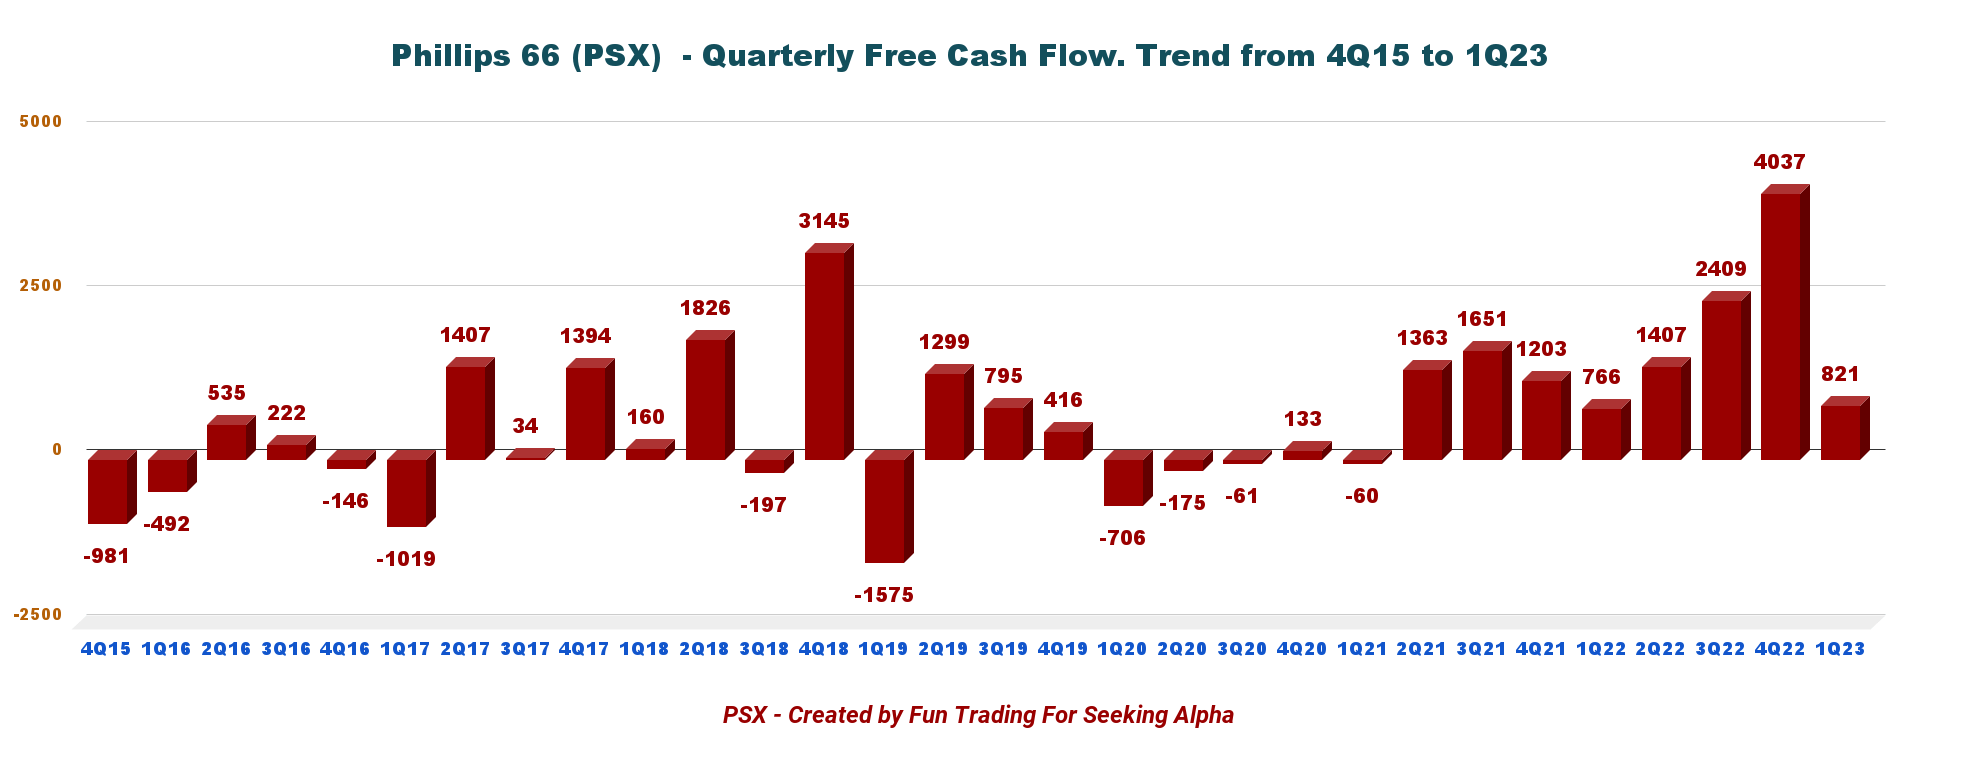
2 - Free cash flow was $821 million in 1Q23
PSX Quarterly Free Cash Flow History (Fun Trading)
Note: Generic free cash flow is cash from operating activities minus CapEx.
FCF trailing 12-month ("ttm") was $8,674 million . The first quarter was $821 million.
Capital expenditures and investments for the quarter were $378 million.
The quarterly dividend is now $1.05 per share or a yield of 4.58%.
Also, PSX was repurchasing shares and bought $800 million of shares in 1Q23, bringing the total shareholder distributions to $1.3 billion for the quarter.
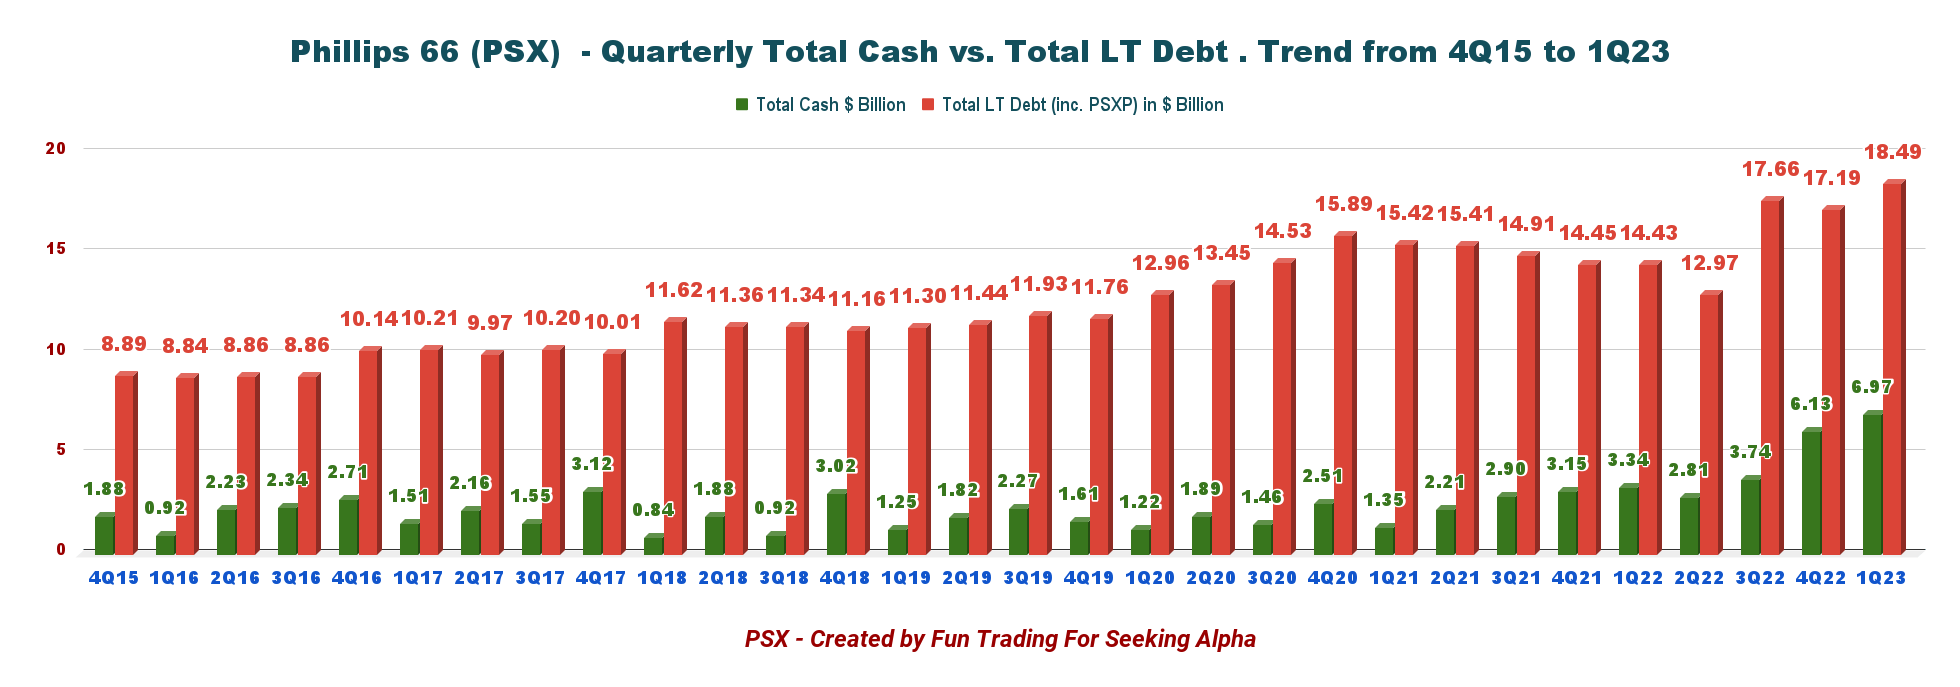
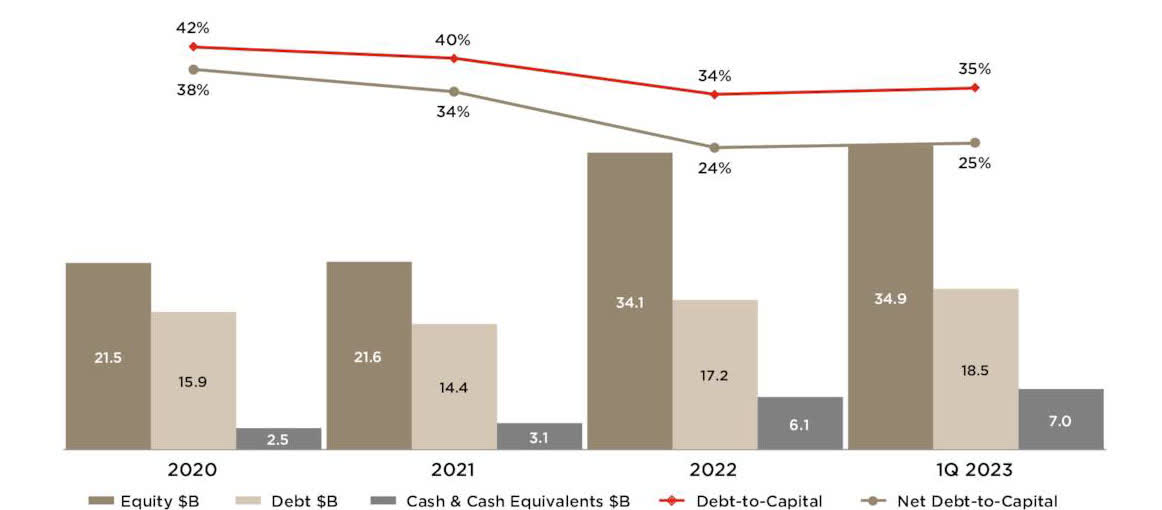
3 - Net debt (consolidated)
PSX Quarterly Cash versus Debt History (Fun Trading)
Consolidated debt was $18.485 billion, with a debt-to-capitalization of 35%. As of March 31, 2023, cash and cash equivalents were $6,965 million.
PSX Capital Structure (PSX Presentation)
Note: During the quarter, the company issued $1.25 billion of senior unsecured notes and entered into a $1.5 billion delayed draw term loan agreement, supporting the pending buy-in of DCP Midstream, LP's publicly held common units.
On April 1, 2023, DCP Midstream employees transitioned into Phillips 66. The company previously agreed to acquire all publicly held common units of DCP Midstream, LP, in exchange for cash. The transaction is expected to close by the end of the second quarter of 2023 and will increase the company's economic interest in DCP Midstream to 86.8%.
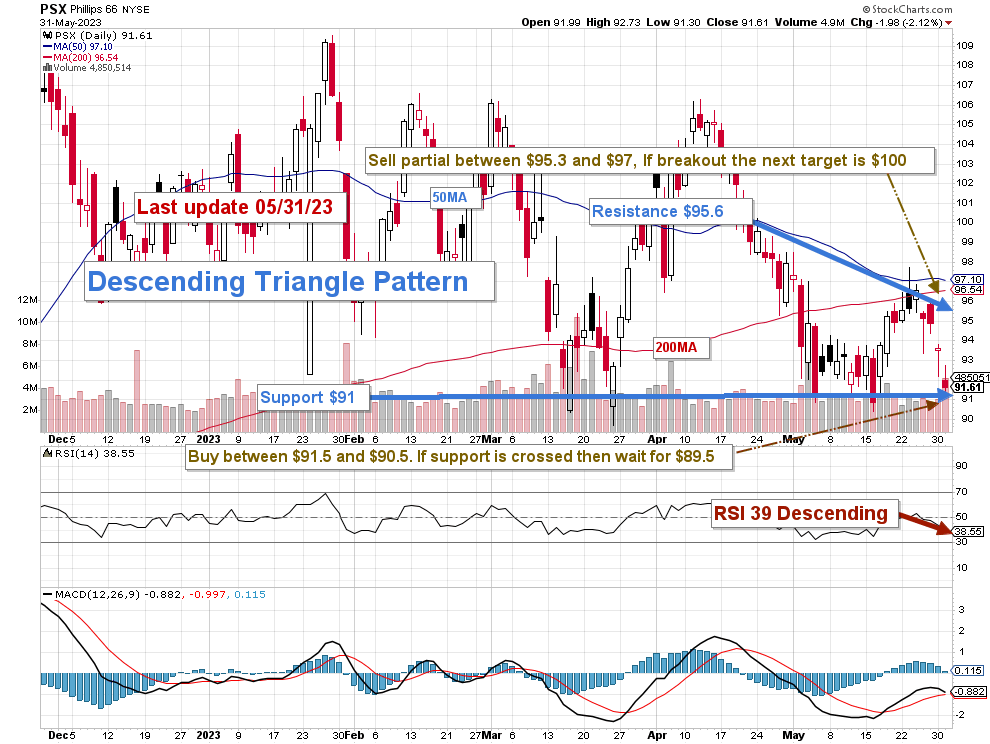
Technical Analysis (Short-Term) And Commentary
PSX TA Chart Short-term (Fun Trading StockCharts)
Note: The chart is adjusted from the dividend.
PSX forms a descending triangle pattern with resistance at $95.6 and support at $91. RSI is now 39 descending, which means a potential breakdown to lower support soon.
The descending triangle is a bearish formation that usually forms during a downtrend as a continuation pattern. There are instances when descending triangles form as reversal patterns at the end of an uptrend, but they are typically continuation patterns. Regardless of where they form, descending triangles are bearish patterns that indicate distribution.
I recommend trading short-term LIFO for about 50% (raised from 40%) of your total position and keeping your core position for a much higher target while enjoying a substantial dividend of 4.49%.
I recommend selling between $95.3 and $97 with potential higher resistance of $100 and accumulating between $91.5 and $90.5 with possible lower support at $89.5.
Warning: The TA chart must be updated frequently to be relevant. It is what I am doing in my stock tracker. The chart above has a possible validity of about a week. Remember, the TA chart is a tool only to help you adopt the right strategy. It is not a way to foresee the future. No one and nothing can.
For further details see:
Phillips 66: The Stock Is Turning Attractive