PTY - PIMCO CEF Update: How Low Can Coverage Go?
2023-06-01 06:12:54 ET
Summary
- We provide an April update for the PIMCO CEF taxable suite.
- PIMCO taxable CEFs deleveraged slightly as total borrowings fell below their February level to a new low.
- Six-month rolling coverage deflated further while three-month coverage was relatively stable. We expect six-month coverage to stabilize going forward.
- We highlight some of the mechanics that are keeping coverage low.
This article was first released to Systematic Income subscribers and free trials on May 23.
In this article, we provide an update on the PIMCO CEF suite. Specifically, we discuss the changes in leverage and distribution coverage for the month of April. We also touch on some of the mechanics pushing coverage lower and why we expect coverage to stabilize going forward.
Leverage Update
PIMCO taxable CEF borrowings fell after an uptick in March. Total taxable CEF borrowings of $6.489bn in April is below the previous February trough by about $60m.
Systematic Income
Borrowings were shed mostly across the board with [[PGP]] and [[PTY]] cutting by double-digit levels.
Systematic Income
The average taxable leverage level moved to a new low over the past year. This suggests that PIMCO CEFs continue to shed borrowings even more than required by any NAV weakness.
Systematic Income
This could be because of a dour view of the market, lack of attractive opportunities, unappealing after-leverage yield due to high leverage costs or due to a desire to build up dry powder.
PIMCO CEFs have historically tended to carry significantly higher leverage than the average credit CEF. The fact that the average leverage level in the taxable suite is just 33% - very mild by credit CEF standards - is astonishing.
Coverage Update
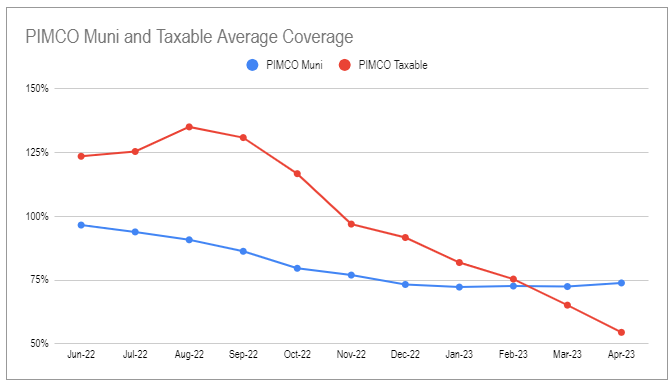
Six-month rolling distribution coverage continues to fall in a straight line for the taxable suite with the average coverage level now approaching 50%. We prefer to use the six-month coverage figure as fixed-rate bonds pay semi-annual coupons and this creates less noise in six-month income figures. Municipal CEF coverage has leveled off after sizable cuts earlier in the year.
As we discussed earlier, we don't expect this linear downtrend in coverage to continue. The main reason for this is that the net income of the taxable suite is not moving lower in a straight line but has simply downshifted to a lower range which we can see in the red bars below. We are already seeing a stabilization in three-month coverage and we will likely see a similar stabilization in six-month coverage next month as well.
Systematic Income CEF Tool
That said, there are still two challenges for the taxable suite. One is that the April net income figure was the second lowest in the last 7 months which is not doing coverage any favors.
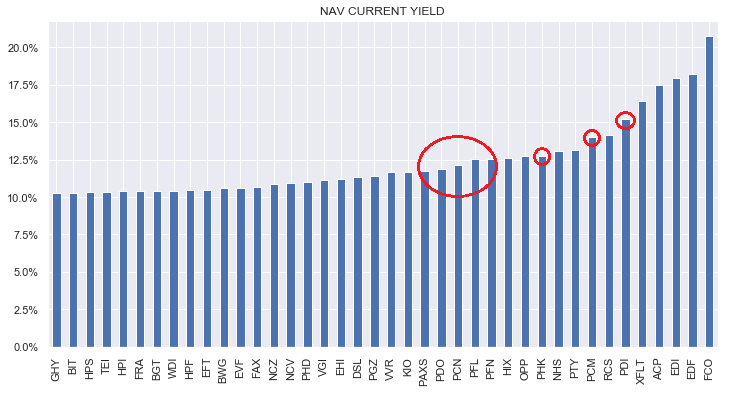
And two, PIMCO taxable CEFs have some of the highest NAV distribution rates among credit CEFs. The chart below shows the top 40 credit CEFs by NAV distribution rates with PIMCO funds highlighted. As many investors know, the higher the NAV distribution rate, the harder it is to cover it, all else equal. The combination of very elevated distribution rates and weak coverage means something may need to give - either net income moving higher or the distribution moving lower.
Finally, we close this section by peeking at the breathtaking cost of leverage incurred by auction-rate preferreds which is nearing 10% ([[PFL]] and [[PFN]] numbers are similar). Given a lot of "up-in-quality" commentary we are seeing from PIMCO, the funds are likely generating negative net income on assets financed with ARPS.
Systematic Income
Market Themes
In this section we take a closer look at [[PDI]] net income and coverage. PDI is arguably the most interesting fund from a coverage perspective, being both the biggest fund in the suite but also one with the lowest six-month coverage.
There are two "standard" drivers of lower net income for PDI as well as the rest of the suite which are deleveraging and rising leverage costs. In our view, deleveraging has played a larger role as PIMCO taxable funds hold enough floating-rate assets to keep up with rising leverage costs from a net income perspective.
The third driver of lower net income which is arguably unique to PIMCO funds is the interest rate swap portfolio. We have seen a couple of shifts in that portfolio which have created a headwind for net income.
For example, between the June and December shareholder reports, PDI portfolio dropped a $142m receive Libor / pay 0.93% swap. It also added a $798m pay SOFR / receive 2% swap. There were quite a few other SOFR swaps but they roughly balance out. The impact of these two swaps is a drag of about $30m of cashflow per year.
Although that sounds like a lot, it's actually just a bit more than 5% of its annual net investment income. So while these swap changes are a real headwind for net income, it isn't a very sizable one in the context of the overall decline in net income.
Finally, FX is often highlighted as the key driver in net income. Specifically, dollar weakness is often viewed as the driver of falling income and vice-versa. However, the relationship is not very clear cut. For example, the dollar (as measured by the DXY) had a strong rally in February but PDI net income was not exactly stellar for that month as highlighted below.
Systematic Income CEF Tool
Overall, while there are clear drivers for the fund's net income slowdown, it's hard to explain the full scope of the drop. At the same time, we are skeptical that the fund's latest six-month coverage of 28% is "real" in any meaningful sense.
Takeaways
We remain mostly on the sidelines across both the PIMCO tax-exempt and taxable suites. We continue to maintain a stub position in [[PAXS]] which remains relatively cheap in the broader taxable suite.
Systematic Income
The chart below shows the discount differential between it and the average PIMCO taxable fund.
Systematic Income
If we see significant widening in credit spreads and/or widening in discounts, we will be happy to add to taxable PIMCO CEFs.
For further details see:
PIMCO CEF Update: How Low Can Coverage Go?