PAXS - PIMCO CEF Update: Is A 20% Premium Too Rich For PTY?
2023-06-29 11:26:44 ET
Summary
- We provide a May update for the PIMCO CEF taxable suite.
- PIMCO taxable CEFs deleveraged slightly as total borrowings fell to a new low.
- Six-month rolling coverage stabilized and recovered as we expected in the last monthly update.
- We discuss the valuation of PTY and what it could mean for future returns.
This article was first released to Systematic Income subscribers and free trials on June 21.
In this article, we provide an update on the PIMCO CEF suite. Specifically, we discuss the changes in leverage and distribution coverage for the month of May. We also take a look at the relatively high premium of the Corporate & Income Opportunity Fund ( PTY ) and what it might mean for future returns.
Coverage Update
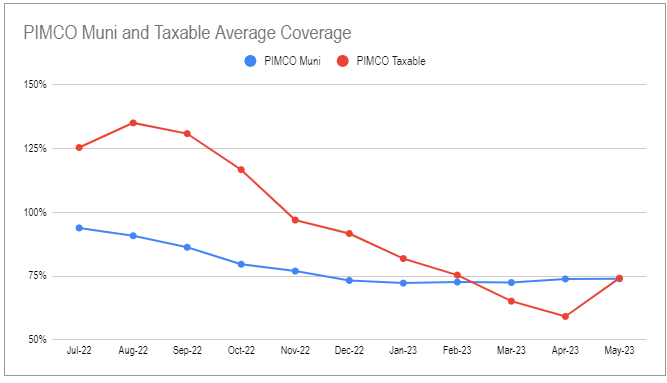
Six-month rolling taxable coverage recovered to around the February level and an average level of 75%. Tax-exempt coverage has remained fairly stable also around a 75% level for the last six months or so.
The May sum total net income of taxable funds jumped sharply to the highest level since last September. Not all funds registered a spike in net income. [[PCM]] and PTY were largely left out of the party while [[PDI]], [[PDO]] and [[PAXS]] registered big increases.
Systematic Income CEF Tool
As we discussed in the previous update, we didn't expect the linear downtrend in coverage we have seen over the previous half-year to continue into May. However, the strength of the reversal exceeded our expectations. We will have to wait and see whether this becomes the new normal or whether net income reverses back lower.
All funds continue to feature coverage well below 100% with PDI boasting the lowest level of coverage at 48% and PAXS having the highest level of 90%.
Systematic Income CEF Tool
To close out this section we like to check in on the PTY ARPS dividend rate which has now, ring the bell, hit 10% - an amazing level. It would be quite a treat to be the holder of these preferreds.
Systematic Income
Leverage Update
Taxable borrowings continued to fall. The bulk of this was almost entirely due to PDI which shed close to $200m in borrowings.
Systematic Income
Interestingly, some of the lower-leveraged funds like PTY and [[PFL]] actually added borrowings during the month.
Systematic Income
The average leverage level in the taxable suite fell as well to a middling 32.5%.
Systematic Income
The average hides a bifurcated picture with PCM, PDO and PAXS boasting leverage in the mid-40s while other funds carry an unusually low level of leverage for credit funds. Interestingly, PDI seems to have given up on being a high-octane fund with its leverage falling to 40%.
Systematic Income
The trend over the past few months has been for PIMCO funds to deleverage even more than is required by the change in the NAV. It seems as though the funds are taking some chips off the table. In our view, this makes a lot of sense as high-yield corporate bond credit spreads are near their tightest level over the past year.
Market Themes
Recently there has been some of the usual tussle in the commentariat about whether PTY is a good deal or a bad deal at the current 20% odd premium.
There are several ways to approach this question. Broadly speaking they can be broken up into a fair-value vs. historical approach.
A fair-value approach looks at a fund's management fee and historic alpha to gauge what the discount "should be" in absolute terms and/or relative to other CEFs.
A historic approach looks at what happened to the fund's returns after its discount/premium moved above a given level. Typically, the higher the premium the worse the forward returns and vice-versa.
These two approaches have pros and cons and we use both in our own analysis. In this section we take a look at the historic approach for the simple reason that it lends itself quite well to a quantitative solution which can clearly show whether, from a historical perspective, a given level of premium was too high or too l ow. The caveat is that history may not repeat and that what worked historically may stop working in the future.
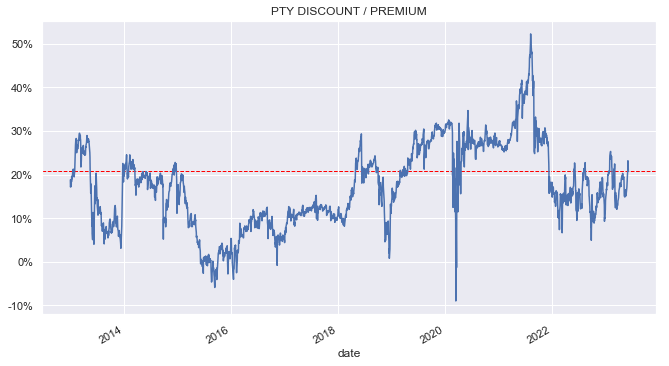
This is what the PTY valuation looks like over the past decade with the current premium highlighted. What's interesting here is that the current valuation looks elevated over the past decade but fairly cheap over the last five years.
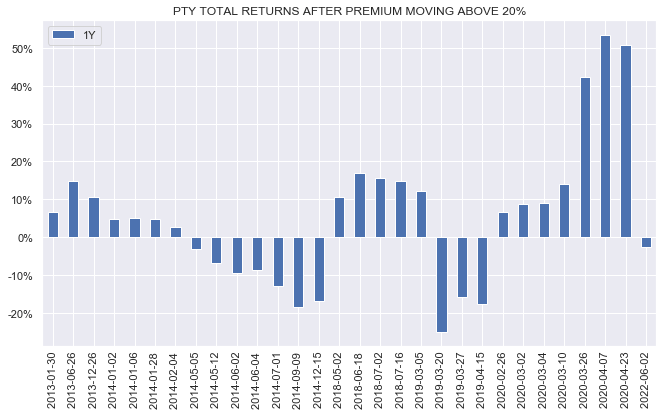
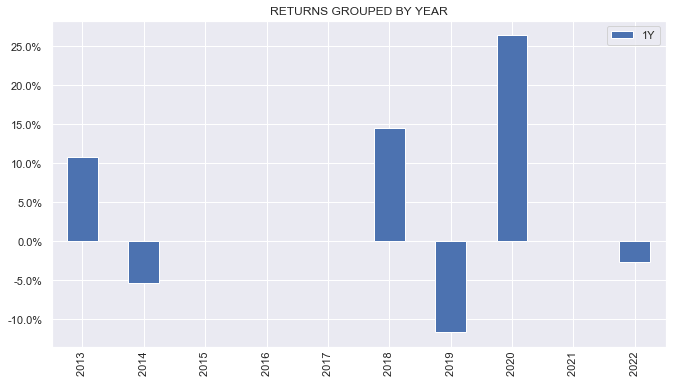
The chart below shows historic 1Y total returns after the premium moved above 20%. Specifically, each bar is a 1-year forward return from the point the premium moved above 20%.
It looks like the returns move in cycles. There are periods of fairly healthy returns, followed by subpar returns. What stands out is the very strong series of returns we saw in 2020.
We can get a clearer picture by grouping the returns by year. We see that apart from 2020 the returns roughly offset each other to a bit above zero. Is there something special about 2020? Clearly yes - the NAV of PTY, as well as other CEFs, was very depressed in March and April of 2020 (the three huge return bars in the chart above) so it's no surprise that the total return a year after 2020 was very strong even though the premium was also above 20%. The return was driven much more by the recovery in the NAV than any valuation rerating.
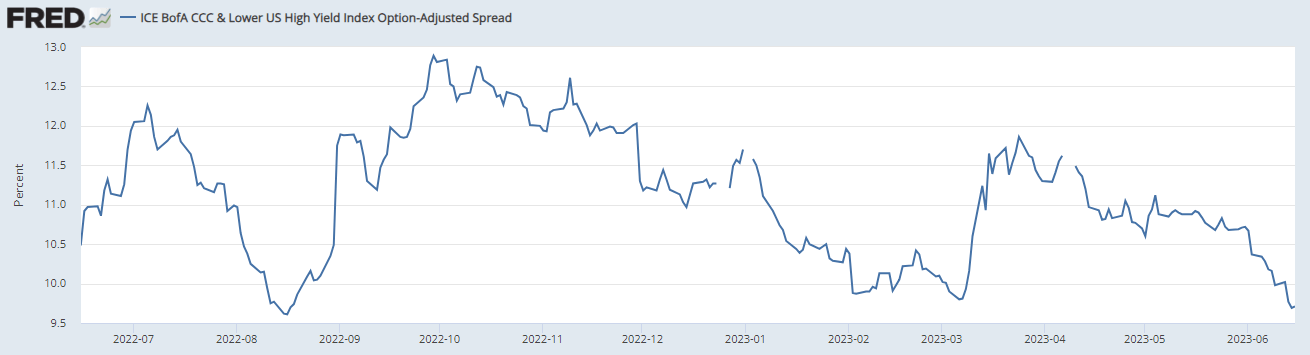
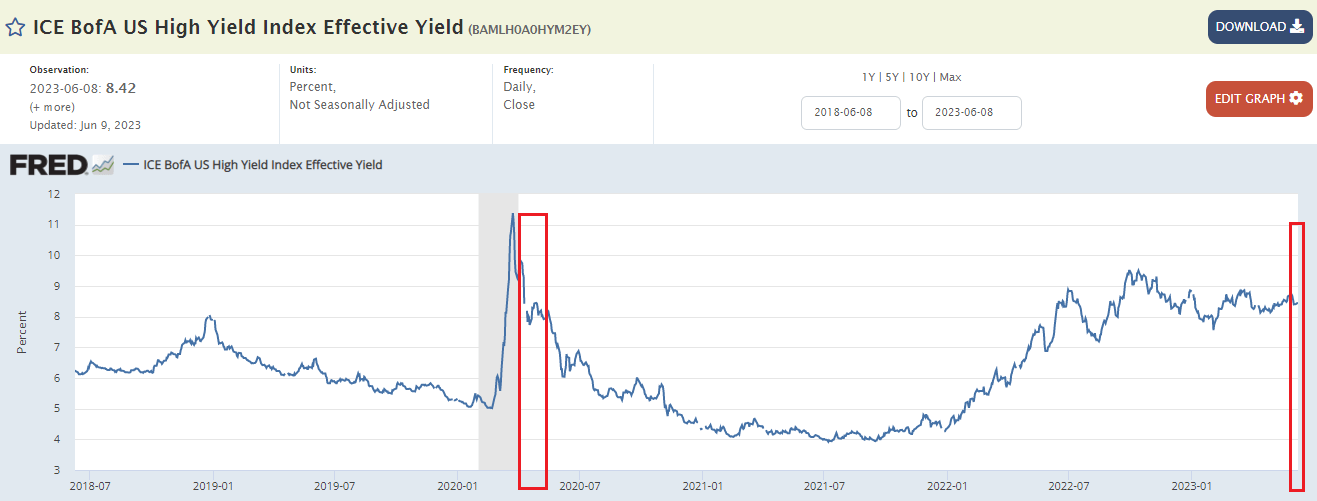
What's interesting about 2020 was that yields in high-yield corporate bonds (which we like to use as a yield proxy in the income space and a sector that PTY happens to be overweight) is currently pretty similar to what it was in April of 2020 when previous PTY returns were stellar despite the fund trading above a 20% premium.
The question is can we expect similarly stellar returns going forward? The same chart tells us that the answer is likely no since we shouldn't expect high yield corporate bond yields to fall back to 4%.
Another key factor here is that PTY cut its distribution in 2021 and when this happens CEF valuations typically move to a lower level. Its distribution rate is already 1% below the average taxable PIMCO CEF and this will likely weigh on its valuation going forward.
Overall, history suggests that it's very unlikely that PTY will deliver blowout returns from today's premium level and that a low to mid-single digit level annualized return is a reasonable expectation.
For further details see:
PIMCO CEF Update: Is A 20% Premium Too Rich For PTY?