PAXS - PIMCO CEF Update: What's Ailing PDI?
2023-04-27 09:18:37 ET
Summary
- We provide a March update for the PIMCO CEF taxable suite.
- Taxable coverage continued to tick lower while Muni coverage remained fairly stable.
- Taxable borrowings increased for only the second time over the past year, as PIMCO likely took advantage of the bank tremor weakness to add assets.
- We highlight PDI and take a look at the reasons for its recent valuation weakness.
This article was first released to Systematic Income subscribers and free trials on Apr. 19.
In this article, we provide an update on the PIMCO CEF suite. Specifically, we discuss the changes in leverage and distribution coverage for the month of March. We also touch on odd-looking Muni CEF coverage figures as well as why the PDI premium has sagged recently.
Leverage Update
Taxable fund borrowings increased slightly last month.
Systematic Income
This was the first increase since the tiny one we saw in August and the largest over the past year. However, it still pales in comparison to the large decreases in borrowings over the previous months.
Systematic Income
In absolute terms, PDI and PDO led the way, being larger funds, however in relative terms it was the lower-leveraged, smaller funds which saw the biggest increases in borrowing. That said, about half the suite continued to shed borrowings.
Systematic Income
The average leverage level ticked up in the suite.
Systematic Income
The combination of an increase in borrowings alongside an increase in leverage as well as the hiccup in credit markets in March due to the difficulties across some banks makes it tempting to conclude that PIMCO used this opportunity to add assets to their funds at attractive levels.
Coverage Update
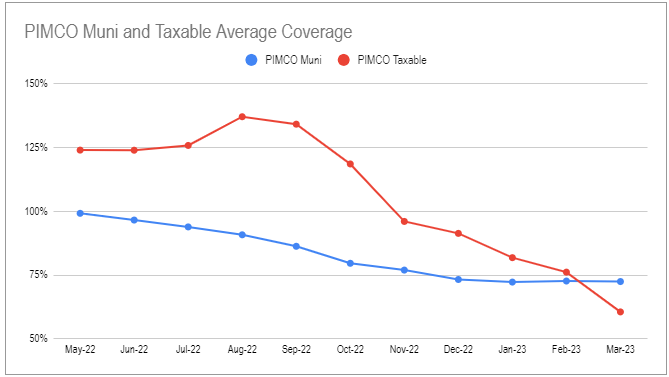
Six-month rolling Municipal CEF coverage remained stable in March while taxable CEF coverage continued to move lower.
Total taxable monthly earnings (red bars) came in at the lowest level in the past 12 months outside of the weird negative reading last November.
Systematic Income CEF Tool
For the second month in a row only PGP saw an increase in coverage.
Systematic Income CEF Tool
Some of the Muni coverage numbers are not totally intuitive. For example, PMX earned $0.04 in March, $0.05 in February and $0.04 in January against a distribution of $0.033. However, it shows 3-month coverage ratio of 78%. There are several different ways to define a 3-month rolling coverage ratio however the number in the monthly report is not particularly intuitive.
PCM issued a Section 19 showing 21% of ROC in the March distribution. This is unusual for it, particularly, as its coverage has been on the high side in the PIMCO taxable suite. One month clearly does not a trend make. We should also not take PIMCO’s numbers at face value. This is not just because coverage has been below 100% for a while and this is the first Section 19 or that the PIMCO taxable coverage numbers are implausibly volatile (an order of magnitude above a "normal" credit CEF) but also because PIMCO basically say as much in their disclosures.
One key disclosure repeatedly made by PIMCO is that they generate income that is economically equivalent to ROC. One way they do this is by holding swap with different coupons and opposite directions. When this is done, PIMCO can generate income without taking any risk (technically there is a minute difference in duration between swaps with different coupons). This is what they mean by "paired swap transactions" if you read the fine print. These pairs generate cashflows that look like income but are financed entirely by the NAV without being ROC in a GAAP sense.
Market Themes
An interesting theme that came up on the service was what exactly is happening with PDI? Specifically, what explains its sagging valuation? The chart below plots the PDI premium against the average of the PIMCO suite (excluding PDI) over the last 5 years. It may surprise some investors but PDI (orange line) used to trade at substantial discount to the average taxable PIMCO CEF, particularly at the early stage of its 13-year life. It closed the gap around 2020 once its strong long-term performance and distribution stability became apparent.
Systematic Income
For a clearer look we take the difference between the PDI premium and the rest of the suite in the chart below. We can clearly see that PDI traded as much as 5% above the average taxable PIMCO CEF valuation but has now moved to trade near 10% below the average taxable PIMCO CEF premium.
Systematic Income
In our view, PDI has two main risks relative to the rest of the suite. One is distribution risk. As the chart below from our Systematic Income CEF Tool shows, the fund's monthly income has declined substantially and is running well below the distribution.
Systematic Income CEF Tool
PDI is clearly not the only fund with subpar coverage. However, its difficulty comes into view in the chart below which plots 6-month distribution coverage (y-axis) and the NAV distribution rate (x-axis). Although the two are not unrelated, they are both worth following.
Systematic Income
Having a sense of distribution coverage is fairly self-explanatory. NAV distribution rate is very useful in our view as well because, as we discussed earlier , it is the best predictor of which funds are likely to cut distributions. The bottom right quadrant below (highlighted in red) captures those funds with low coverage and a high NAV distribution rate. PDI is an outlier (with RCS not far behind). In short, investors are worried about a distribution cut.
The second risk to PDI is that of performance. Specifically, PDI is one of the best performing PIMCO funds since its inception (despite its significantly higher fee) than the average PIMCO fund. A big part of the reason for that strong performance was the fact that PDI, until recently, tended to carry a significantly higher level of leverage than the average PIMCO CEF as well as the fact that it was able to take advantage of the one-off opportunity in legacy residential non-agency RMBS after the GFC (PCM and PCI were also overweight these assets in the taxable suite). With both of these performance supports falling away PDI could easily become a sub-par CEF in the PIMCO stable as the headwind of the relatively high free remains in place.
Systematic Income
We can already see this taking shape as its return over the last 3-5 years is not particularly exceptional (5Y performance is second-worst in the suite).
Systematic Income
What this highlights is that PDI could become, at best, a fund that is likely to somewhat underperform the rest of the suite. For this reason it should also carry a somewhat lower valuation.
For further details see:
PIMCO CEF Update: What's Ailing PDI?