PAA - Plains All American Pipeline: The Best Is Yet To Come
2023-04-20 17:21:44 ET
Summary
- As expected, Plains All American Pipeline increased their distributions significantly, thereby seeing my previous thesis completed without any setbacks.
- This was accompanied by strong cash flow performance, which also helped repay debt.
- Their new medium-term capital allocation strategy calls for further distribution increases that should see a very high circa 11% yield on current cost.
- Past this point, even more distribution increases could be forthcoming thanks to their very high near-18% free cash flow yield and leverage that is sitting beneath its targeted range.
- Since I suspect the best is yet to come, I believe that maintaining my strong buying is appropriate.
Introduction
When last reviewing Plains All American Pipeline ( PAA ) back in September 2022, my previous article suggested that unitholders such as myself get ready for a very high 10%+ yield on current cost. Whilst not every investment pans out as expected, thankfully this one did not disappoint because fast forward to the present day and they subsequently increased their distributions . In fact, if their present annual rate of $1.07 per unit is compared against their unit price of $10.53 when conducting the previous analysis, it actually sees a very high yield slightly above 10%. Since this now sees my previous thesis completed without any setbacks, I wish to provide a refreshed analysis that considers what comes next, and thankfully, it seems the best is yet to come given their new medium-term capital allocation strategy.
Coverage Summary & Ratings
Since many readers are likely short on time, the table below provides a brief summary and ratings for the primary criteria assessed. If interested, this Google Document provides information regarding my rating system and importantly, links to my library of equivalent analyses that share a comparable approach to enhance cross-investment comparability.
Author
Detailed Analysis
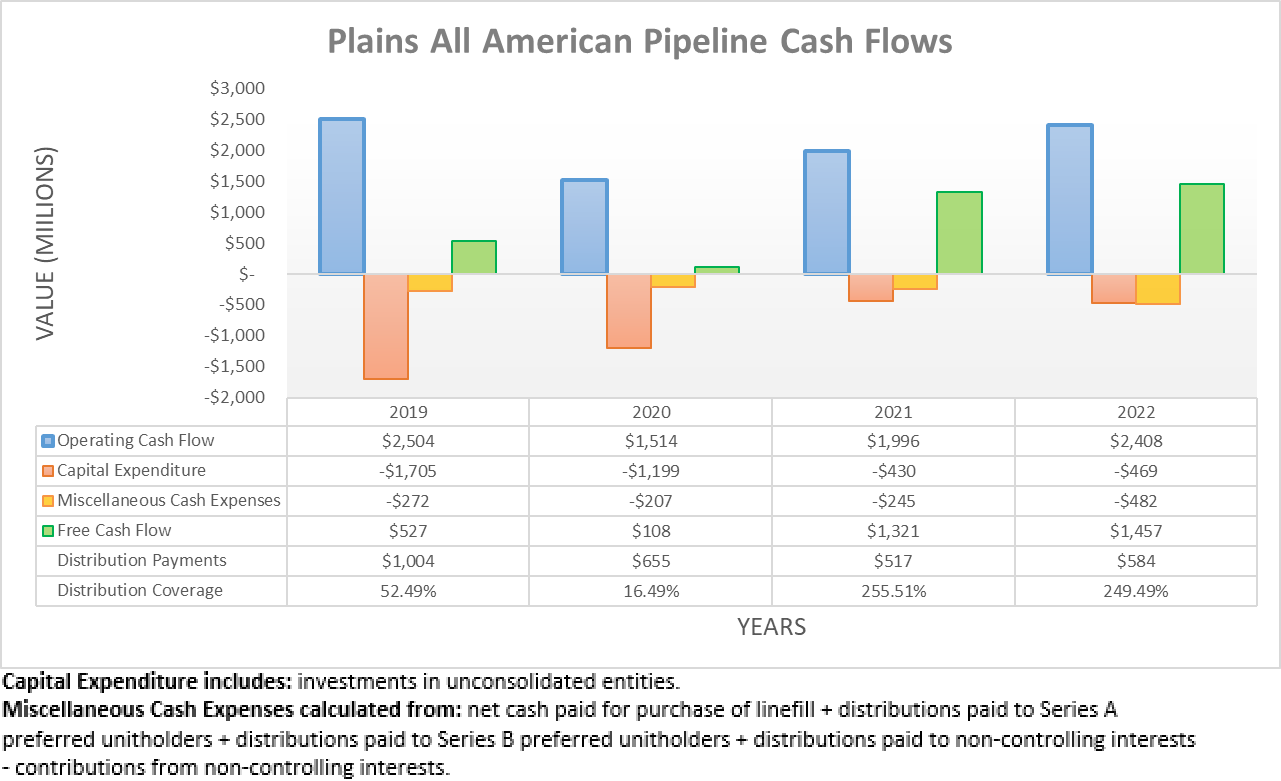
Following their solid cash flow performance during the first half of 2022 as noted when conducting the previous analysis, it was positive to see this strengthen during the second half. As a result, their operating cash flow closed out the year with a result of $2.408b that is a strong circa 20% higher year-on-year versus their previous result of $1.996b during 2021. In fact, this was actually their highest result since 2019, before the Covid-19 pandemic took its toll, and when combined with their modest capital expenditure, it left ample free cash flow of $1.457b during 2022. Apart from helping repay debt, this also provided very strong distribution coverage of 249.49% that obviously sees prospects to fund their distribution increases, not to mention even more that is still coming.
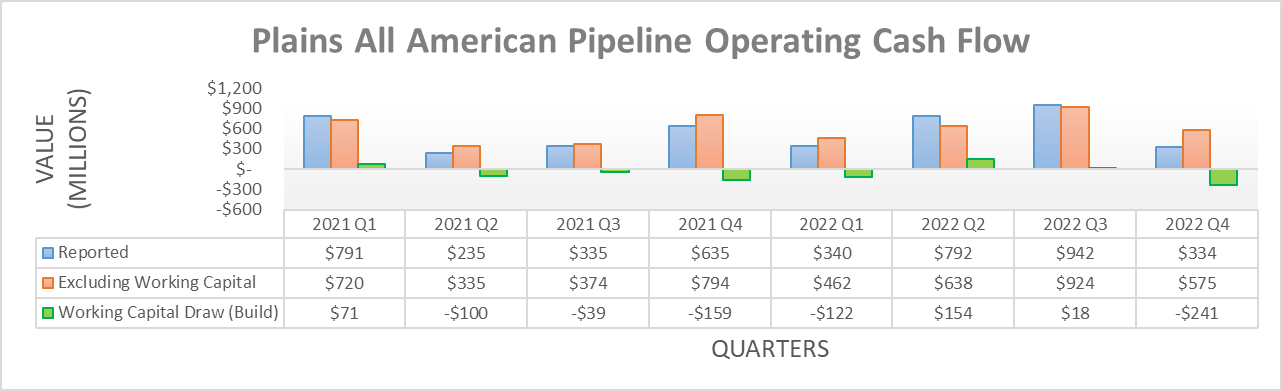
When viewing their operating cash flow on a quarterly basis, their results vary modestly quarter-to-quarter but this is normal for their partnership. Collectively, the third and fourth quarters of 2022 saw reported results totaling $1.276b with underlying results totaling $1.499b, which excludes working capital movements. In comparison year-on-year, the third and fourth quarters of 2021 saw results totaling considerably lower at $970m and $1.168b, respectively. Whilst this created a strong base going forwards into 2023, their new medium-term capital allocation strategy is far more important.
Plains All American Pipeline March 2023 Investor Presentation
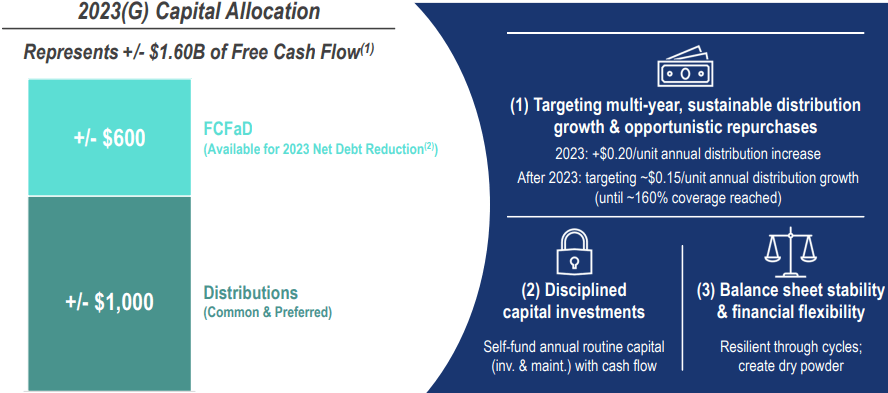
When reviewing their guidance for 2023 that is also partly embedded within their new medium-term capital allocation strategy, it shows their free cash flow is forecast to reach $1.6b, which compared against their current market capitalization of approximately $9.1b makes for a very high near-18% free cash flow yield. Apart from highlighting their prospects to fund further distribution increases, this also speaks volumes to the very desirable value their units offer, as free cash flow yield is effectively the upper limit of what they could consistently provide via unitholder returns, such as a mixture of distributions and unit buybacks.
Right now, they are not intending to push their unitholder returns to the maximum with circa $600m of this free cash flow forecast to be retained within the partnership during 2023. Although as the years progress, unitholders are still going to increasingly share in the spoils of their free cash flow, as they target annual distribution increases of $0.15 per unit until such time as they reach 160% coverage, which refers to their accrual-based distributable cash flow. Whilst $0.15 per unit does not sound exciting, their annual distributions are presently $1.07 per unit, and thus in the first year, this represents an increase of circa 14% on top of their already high circa 8% yield but wait, there should be even more in future years until they reach their 160% coverage.
Plains All American Pipeline March 2023 Investor Presentation
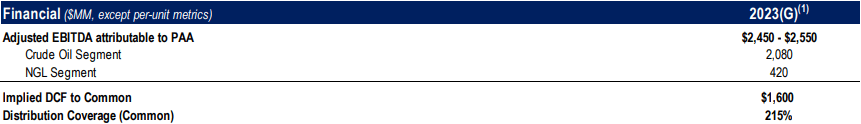
Apart from free cash flow, their guidance for 2023 also includes forecasts for their distributable cash flow that is forecast to land at $1.6b for common unitholders. I suspect this is likely to be forthcoming and thus makes for a suitable basis since it effectively equals their result of $1.596b during 2022, as per their fourth quarter of 2022 results announcement . When translated into a per-unit basis, this equals $2.29 per unit given their latest outstanding unit count of 698,390,006 and even without any future growth, 160% coverage would see annual distributions of $1.43 per unit and therefore provide a very high yield on current cost of circa 11% right now. Since their distributions are presently $1.07 per unit, it should take around two and half years to reach this point with annual increases of $0.15 per unit, which is not a particularly long wait given the rewards along the way.
Whilst they have not released any capital allocation strategy for the long-term past these years, I suspect their distributions will keep increasing well into the long term. Largely because even after reaching annual distributions of $1.43 per unit, they would only cost circa $1b to fund, plus another circa $200m for their preferred distribution payments. Unless their free cash flow unexpectedly falls off a cliff, this would still leave another circa $400m of excess free cash flow after distribution payments. Perhaps they might ramp up their future growth investments, thereby pulling back on this free cash flow, although doing so would create even greater prospects to generate free cash flow in later years. Therefore, I suspect their distributions will keep increasing well into the future, even after completing their new medium-term capital allocation strategy.
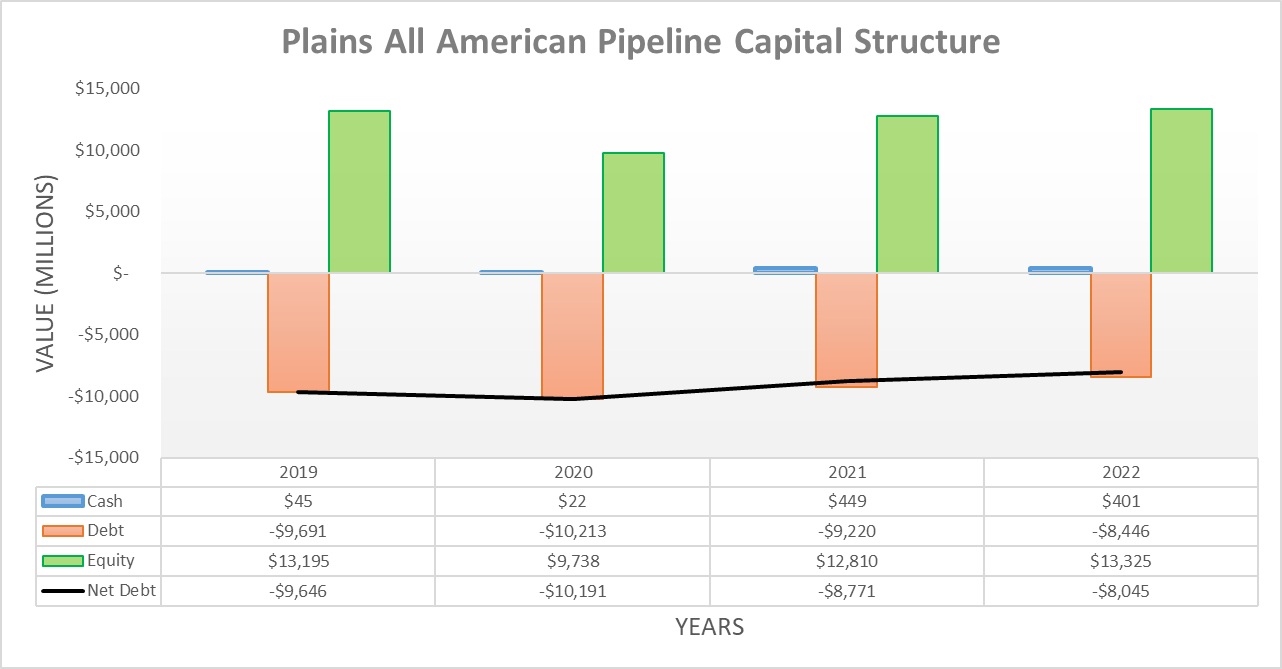
Since the partnership continued producing ample free cash flow since conducting the previous analysis, their net debt continued dropping during the second half of 2022 to end the year at $8.045b versus its previous level of $8.349b following the second quarter. This now marks a circa 20% decrease since their net debt peaked at $10.191b at the end of 2020 and when looking ahead into 2023, it should decrease another circa $600m given their aforementioned guidance and capital allocation strategy.
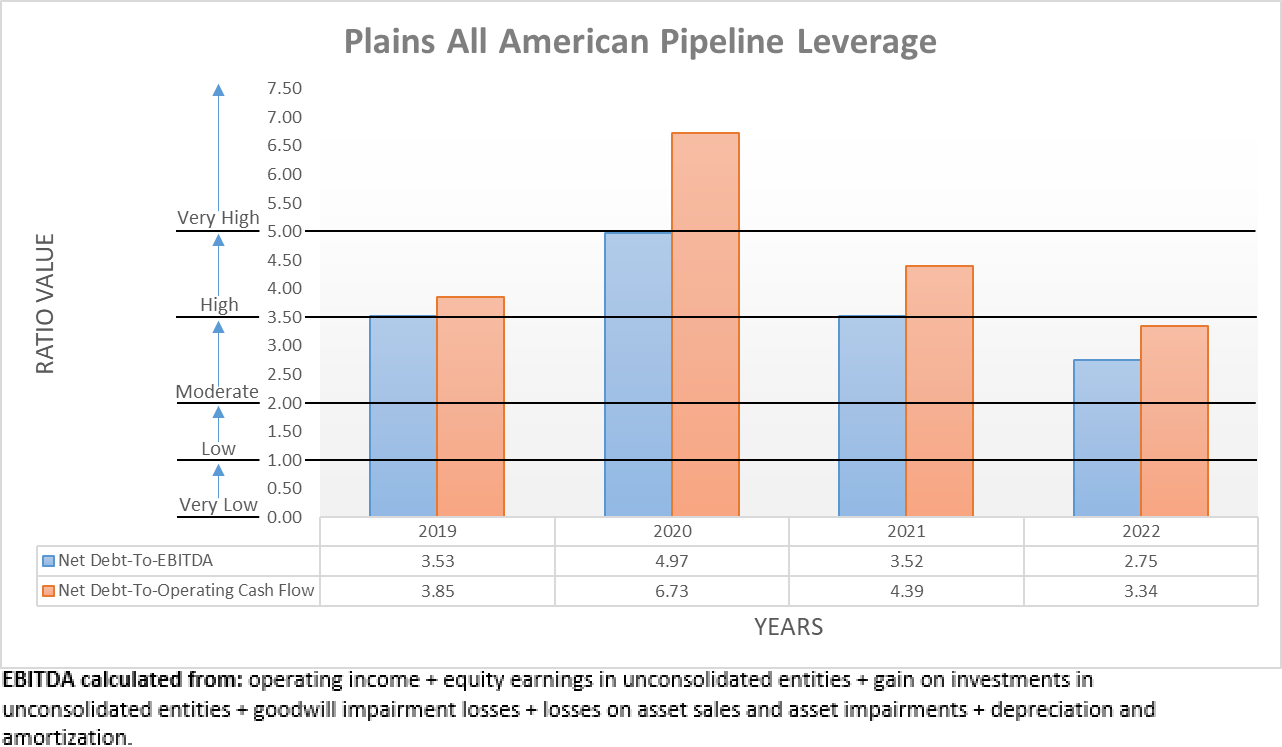
Since their net debt continued dropping alongside strong financial performance, it greatly helped their leverage, which followed in tandem during the second half of 2022 with their net debt-to-EBITDA dropping to 2.75 versus its previous result of 3.13 following the second quarter. Likewise, their accompanying net debt-to-operating cash flow also continued dropping with respective results of 3.34 versus 3.80 across these same two points in time and unlike in the past, both of their results are now out of the high territory and thus down into the moderate territory of between 2.01 and 3.50.
Meanwhile, if looking at their leverage ratio as utilized by management, it also continued dropping to a similar extent to land at 3.70 following the second half of 2022, as per slide twenty-five of their March 2023 investor presentation . Apart from being down materially versus their previous result of 4.10 following the second quarter, this same slide shows they are now even beneath the bottom end of their targeted range of 3.75 to 4.25 with a forecast to see as low as circa 3.50 at the end of 2023.
Since their leverage is already moderate and beneath even their own targeted range, it should not be controversial to say there is little requirement for continued deleveraging. Whilst it remains to be seen, I feel as though this further supports the probability of seeing further distribution increases in future years after they have achieved the aforementioned distribution target of their medium-term capital allocation strategy.
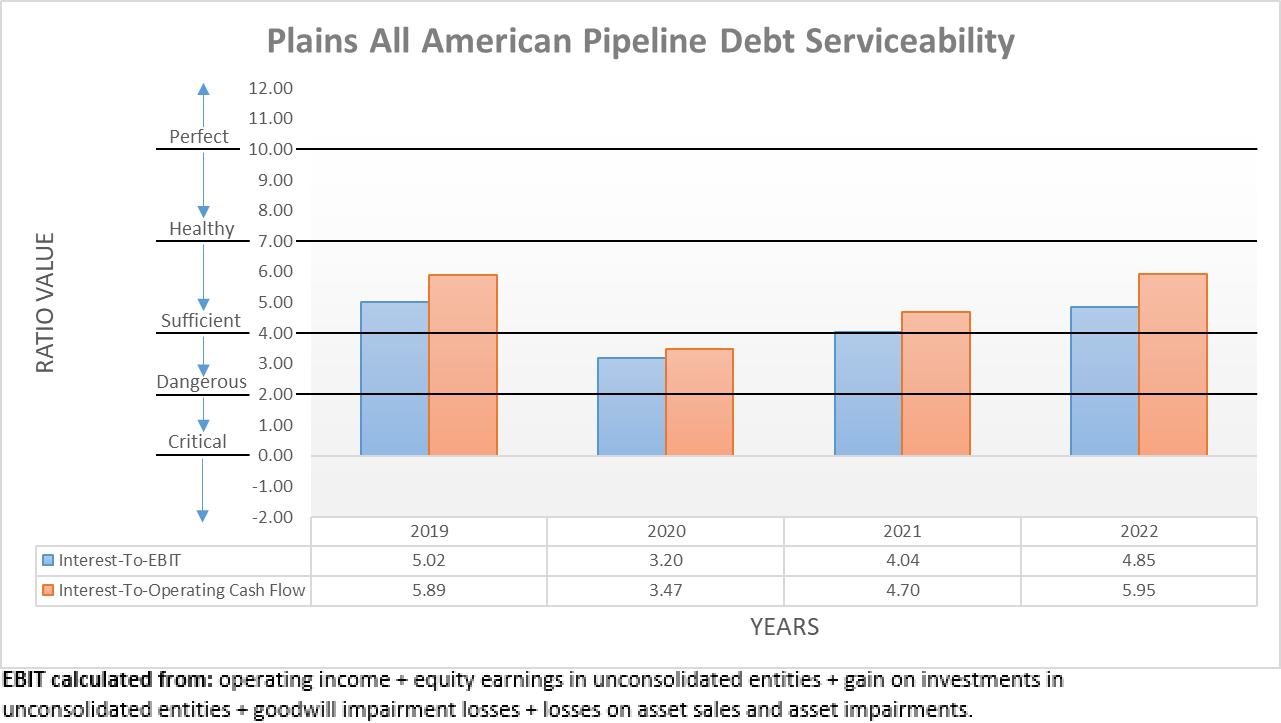
Similar to their net debt and leverage, their debt serviceability continued improving in tandem during the second half of 2022. As it stands right now, their interest coverage when compared against their EBIT is 4.85 versus their previous result of 4.17 following the second quarter. Similar to their interest coverage when compared against their operating cash flow of 5.95, this sees their debt serviceability within the range that I consider healthy but at the same time, there is still modest room for continued improvements as they repay more debt in the coming years.
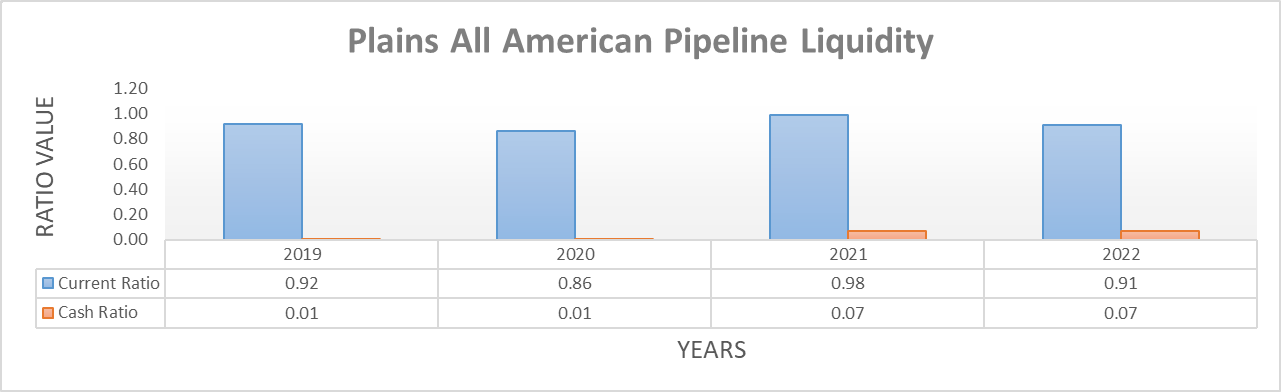
Unsurprisingly given they are a large partnership, their liquidity was once again relatively quiet and uneventful during the second half of 2022 with their current ratio now at 0.91 and thus only seeing a routine fluctuation versus its previous result of 0.97 following the second quarter. Meanwhile, their accompanying cash ratio saw its respective results increase modestly to 0.07 versus 0.04 across these same two points in time, which once again reaffirms their liquidity is adequate.
Whilst they see a modest wave of debt maturities ahead with $1.1b, $750m, $1b and $750m during 2023-2026 respectively, their ability to generate upwards of $600m per annum of excess free cash flow after distribution payments will help clear these hurdles. Obviously, they cannot repay each of these maturities in full but as a large partnership with an investment-grade credit rating, they should not have any issue refinancing the remainder. Plus, they also retain $1.317b of availability under their credit facility that does not mature until August 2027, which can be utilized as necessary to help with repaying and refinancing these debt maturities.
Conclusion
It is always nice when investments pan out as expected, especially without any setbacks and thus unitholders such as myself are now enjoying a significant distribution increase versus as recently as less than one year ago. Thankfully, there are no signs their distribution increases are going to cease anytime soon given their new medium-term capital allocation strategy and ample free cash flow that itself, sees a very high near-18% free cash flow yield. Since I suspect the best is yet to come, I believe that maintaining my strong buy rating is appropriate.
Notes: Unless specified otherwise, all figures in this article were taken from Plains All American Pipeline’s SEC filings , all calculated figures were performed by the author.
For further details see:
Plains All American Pipeline: The Best Is Yet To Come