TRV - Playing Defense With Low-Debt Dividend Growers
2023-09-28 22:38:32 ET
Summary
- The article discusses miserly managers of money. Large cap-picks with ultra low debt-to-equity ratios and nice sized, well covered, growing dividends.
- These companies also have ample interest expense coverage, an essential when the forward cost of capital is ever-increasing.
- Insurance, oil & gas seem to be the best operators at the moment with the least need for debt in their capital stacks.
Low debt for a high-rate environment
We know the FED continues to raise rates. Rates that are unabashedly touted by FED chair Jerome Powell as going to be "higher for longer" . This coupled with some negative catalysts on the horizon has led me to some broad-based versus concentrated strategies.
I'd like to present another conservative broad-based buy and hold screen for September, one based on companies with low debt, low BETA, and a high return on equity. As we may be in for a bit of stagflation ahead, I'd like to consider this my Anti-Stag portfolio. Large cap, high quality low-debt picks. Let's take a look at the criteria to make the cut.
Large cap
I'm not keen on small cap stocks at the moment unless they are self-funding, like oil and gas. Raising capital for these companies will be more difficult than their large cap brethren with advantages in credit rating and demand for credit and equity offerings should they need to get their hands on more cash. Cash is quickly becoming king again in the sense of he who has it can continue to operate, and he doth not, need to pay an arm and a leg for it.
Low debt-to-equity
Debt-to-equity ratios need to get more attention these days with the ever-rising cost of debt. The same goes for the EBIT to net interest coverage ratios.
My current screeners for investment grade A to AAA corporate debt are currently showing ranges between 4.45% on the low end to 6.497% on the high end. Ratcheting up by credit rating degradation. These are for 3-5 year maturities.
Currently Aflac, as an example has a credit rating of A3/A-. Their longest duration corporate bond I could currently find is maturing in 2039 with a 6.9% coupon rate . With some high-quality companies now floating debt over 6%, the less debt needed to run the business, the better.
Dividend of at least 2% with a CAGR above 5%
In times of stagflation, where we have persistently stubborn inflation and slow growth, a good dividend can be all you need to beat the market. We are still missing the high unemployment facet of stagflation, but full employment will also keep prices of goods and services higher for longer. This will stunt the growth rates of most companies as it becomes difficult to raise their prices as quickly as the underlying cost of goods sold.
Low Beta
Entering choppy water can at least give the investor solace should they be able to beat the market both on the way up and on the way down. I am as happy when my portfolio goes up more than the market as I am when it goes down less than the market. As a long-term "buy-and-hold" investor, we should prepare for both dynamics. Buying stocks with a Beta lower than the market to reduce volatility can be a great psychological aid.
High return on equity
With a return on equity above 10%, we know that these companies can get sufficient returns on investors' funds. Being that these companies also do not rely heavily on debt , we can be more certain than not that returns on capital can continue regardless of interest rates. We as investors follow earnings growth too closely and return on equity combined with debt levels too distantly. If earnings are being juiced with a lot of debt, we can expect growth to slow more-so for those that employ more debt in their capital stack than those who do not.
Sufficiently cheap
Using 15 X GAAP earnings as the upper limit for the portfolio threshold is a good start to keep the price-to-earnings within the constraint of long-term market averages.
The list from the screen:
After putting the U.S.-based large caps through the wringer on the above criteria, the list was whittled down to 5 companies that penciled out.
All numbers courtesy of BOFA Global Research, most recent financial quarter MRFY unless indicated otherwise
| STOCK | |
| DIV YIELD | |
| DEBT-TO-EQUITY | |
| ROE | |
| Beta | |
| Current Year P/E Estimate | |
| Div payout ratio | |
| ( AFL ) | |
| |
| |
| |
| |
| |
| |
| ( CVX ) | |
| |
| |
| |
| |
| |
| |
| ( HIG ) | |
| |
| |
| |
| |
| |
| |
| ( SNA ) | |
| |
| |
| |
| |
| |
| |
| ( TRV ) | |
| |
| |
| |
| |
| |
|
1 Year performance amongst the group
Aflac
With short-term interest rates skyrocketing and insurance companies able to invest the "float", or insurance premiums not paid out for claims, insurance companies are an excellent play on short-term interest rates. Three large cap insurance giants made this list with the other being Travelers and The Hartford Financial Services Group. Aflac has the widest margin of EBIT/interest expense coverage amongst this insurance group.
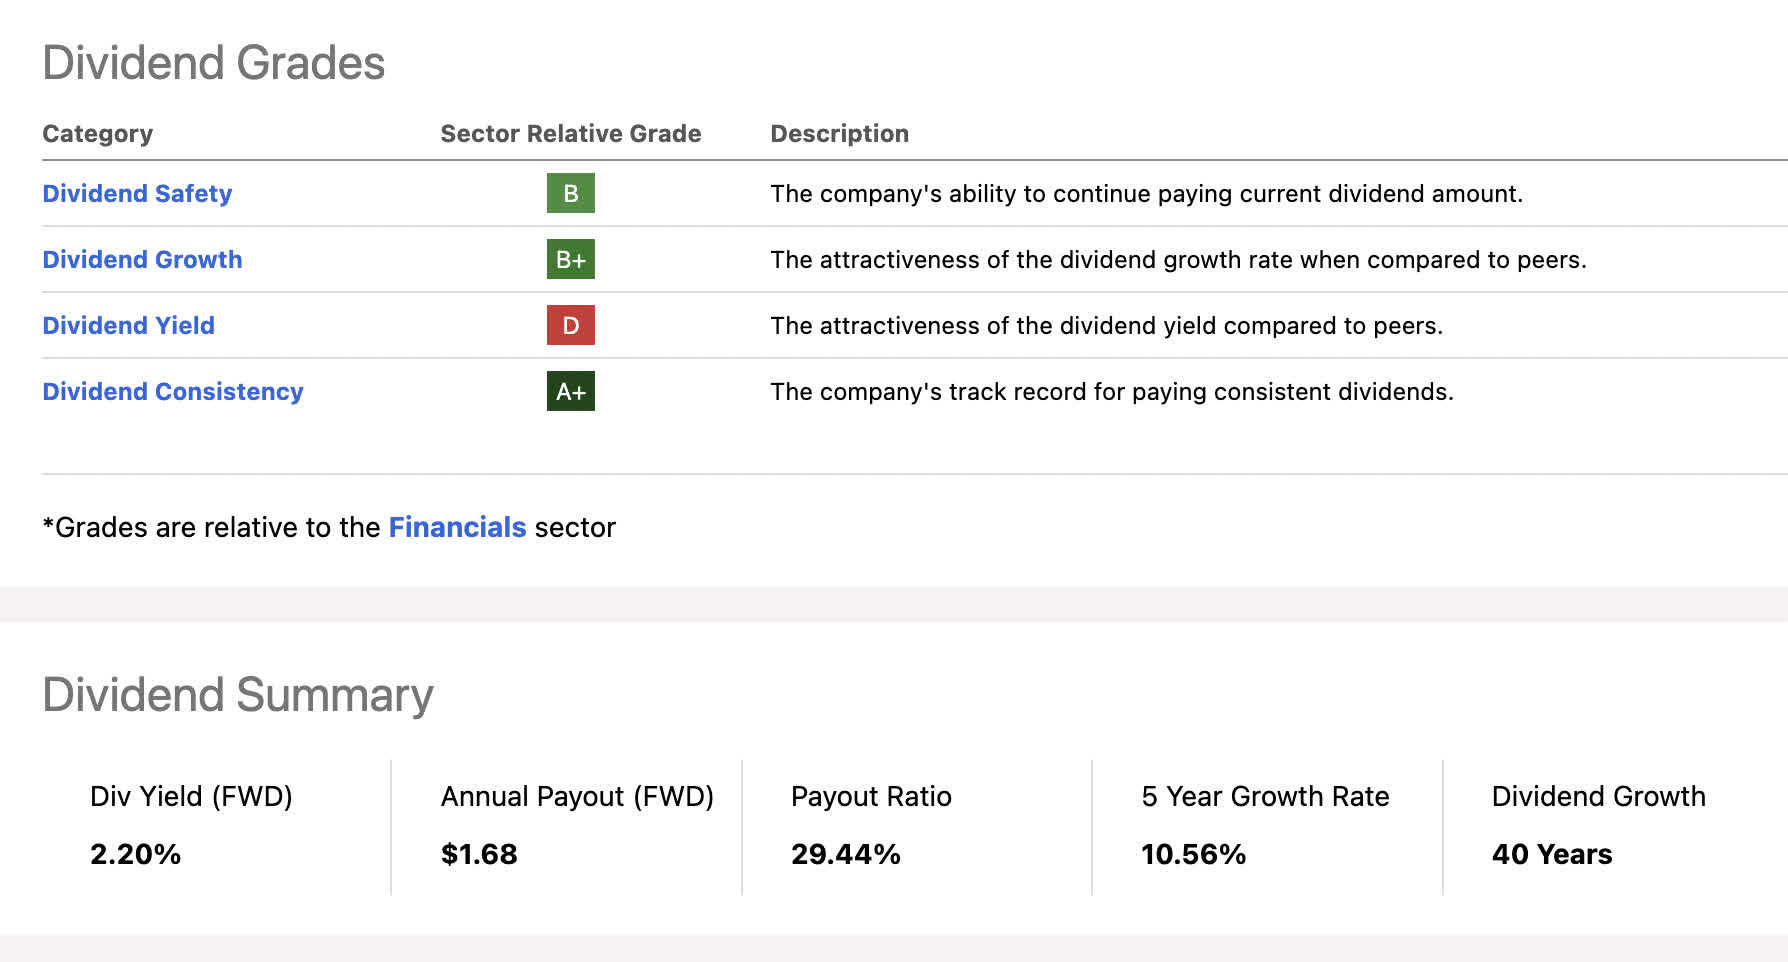
Aflac is producing a superior return on equity with a similar capital makeup in this trinity. The company currently has a debt-to-equity ratio of 33%, ROE of 15%, a 2.2% yield with a 5-year dividend CAGR of 10.56%. Aflac is a dividend aristocrat with 40 years of growth. The company's operating segments can be divided into the following:
Data courtesy of Fact Set:
Revenue sources
| Life and Health Insurance |
| 98.63% |
| Reinsurance |
| 1.37% |
Dividend scores
EBIT/interest expense coverage
All numbers in millions courtesy of Seeking Alpha
- TTM EBIT=$4,982
- TTM interest expense= 213
23 X coverage
Chevron
As one of the largest, integrated oil majors in the world, Chevron is a popular pick amongst pundits. With my personal largest single investment being in Exxon ( XOM ), Chevron is appealing to me and a name I am continually adding to. The main reason is that it is the last remaining Dow constituent energy name and I self-index the DJIA 30. Chevron is higher weighted towards fossil fuel exploration and production than Exxon at 17.96% vs. 7.67% for Exxon.
Not only is Chevron and the entire energy industry in general light on debt, but the returns on capital seem very sustainable with no end to higher oil prices in sight. Chevron is a great play on a higher exploration mix versus the other large-cap, fully integrated oil companies.
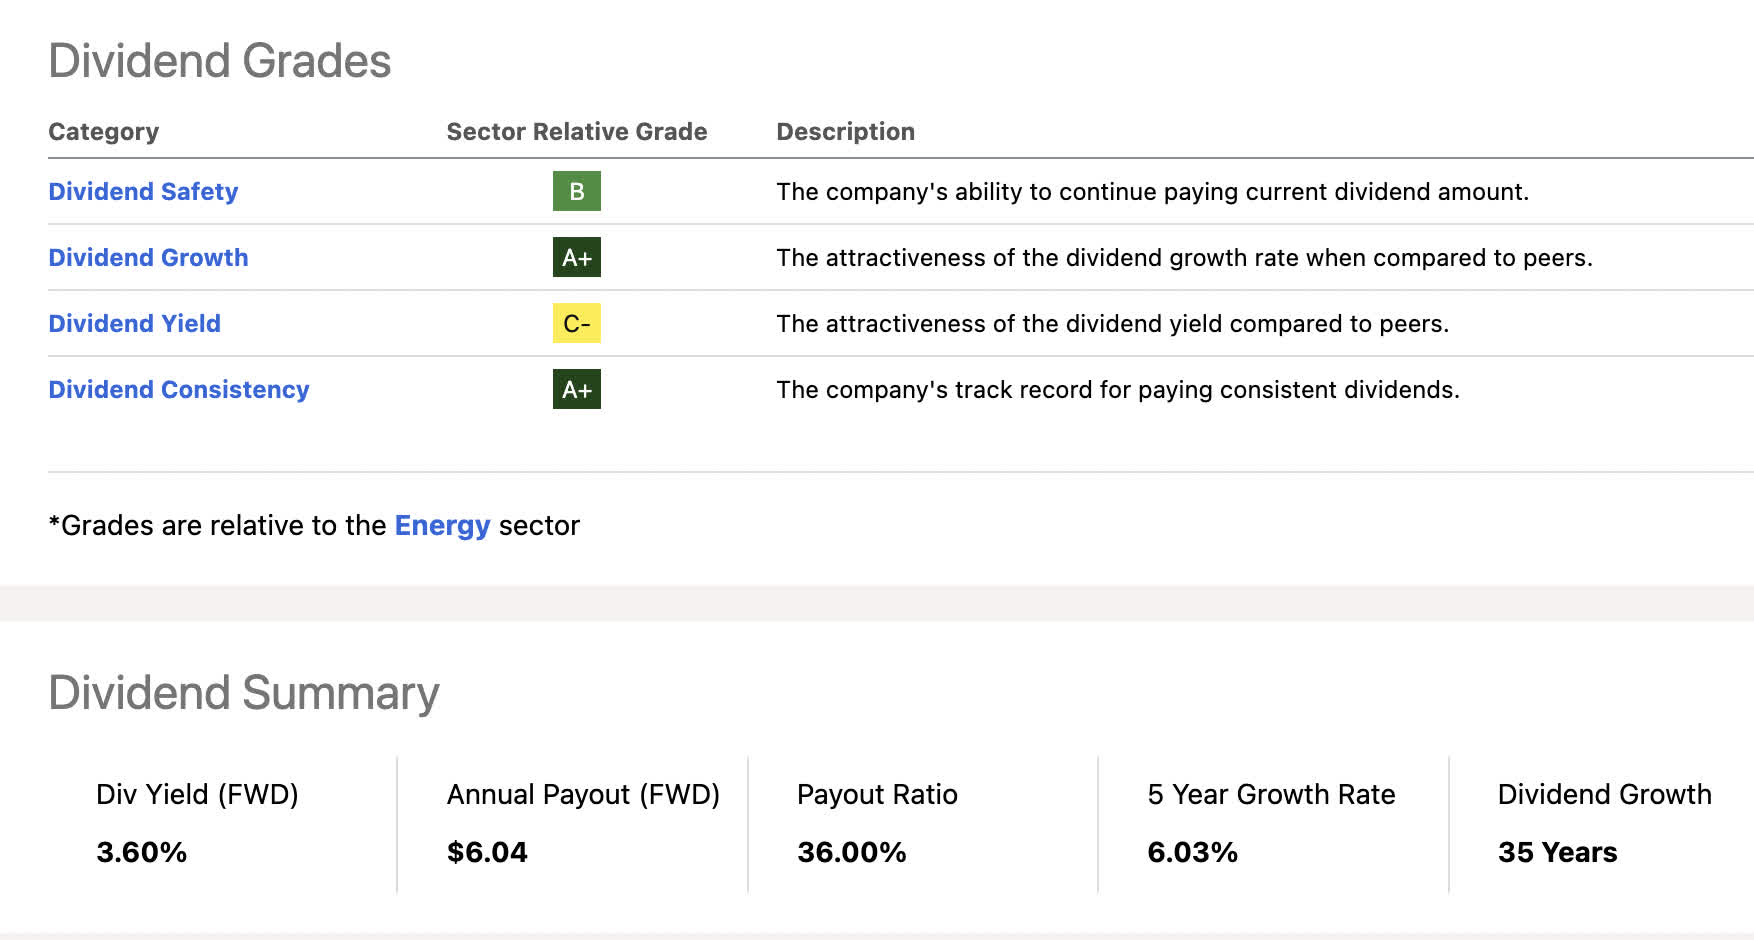
The company currently has a debt-to-equity ratio of 17%, ROE of 23.7%, a 3.6% yield with a 5 Yr dividend CAGR of 6.03%. Chevron is a dividend aristocrat with 35 years of growth:
Data courtesy of FactSet:
Revenue sources
| Petroleum Refineries |
| 73.1% |
| Other Fossil Fuel Exploration and Production |
| 17.96% |
| Americas Fossil Fuel Exploration and Production |
| 8.89% |
| General or Multi-Industry Revenue |
| .05% |
Dividend scores
EBIT/interest expense coverage
All numbers in millions courtesy of Seeking Alpha
- TTM EBIT= $36,466
- TTM interest expense= $486
75 X coverage
The Hartford Financial Services Group
The Hartford Financial Services Group, Inc. is a US-based provider of both insurance and financial services operating domestically and internationally. Among these three insurance picks, Hartford offers the most diverse range of products that also includes workers' liability, surety bonds, professional liability insurance, and even livestock and marine policies.
The company is in the middle of the insurance pack of picks regarding its EBIT/ interest expense coverage at 11.6 X TTM.
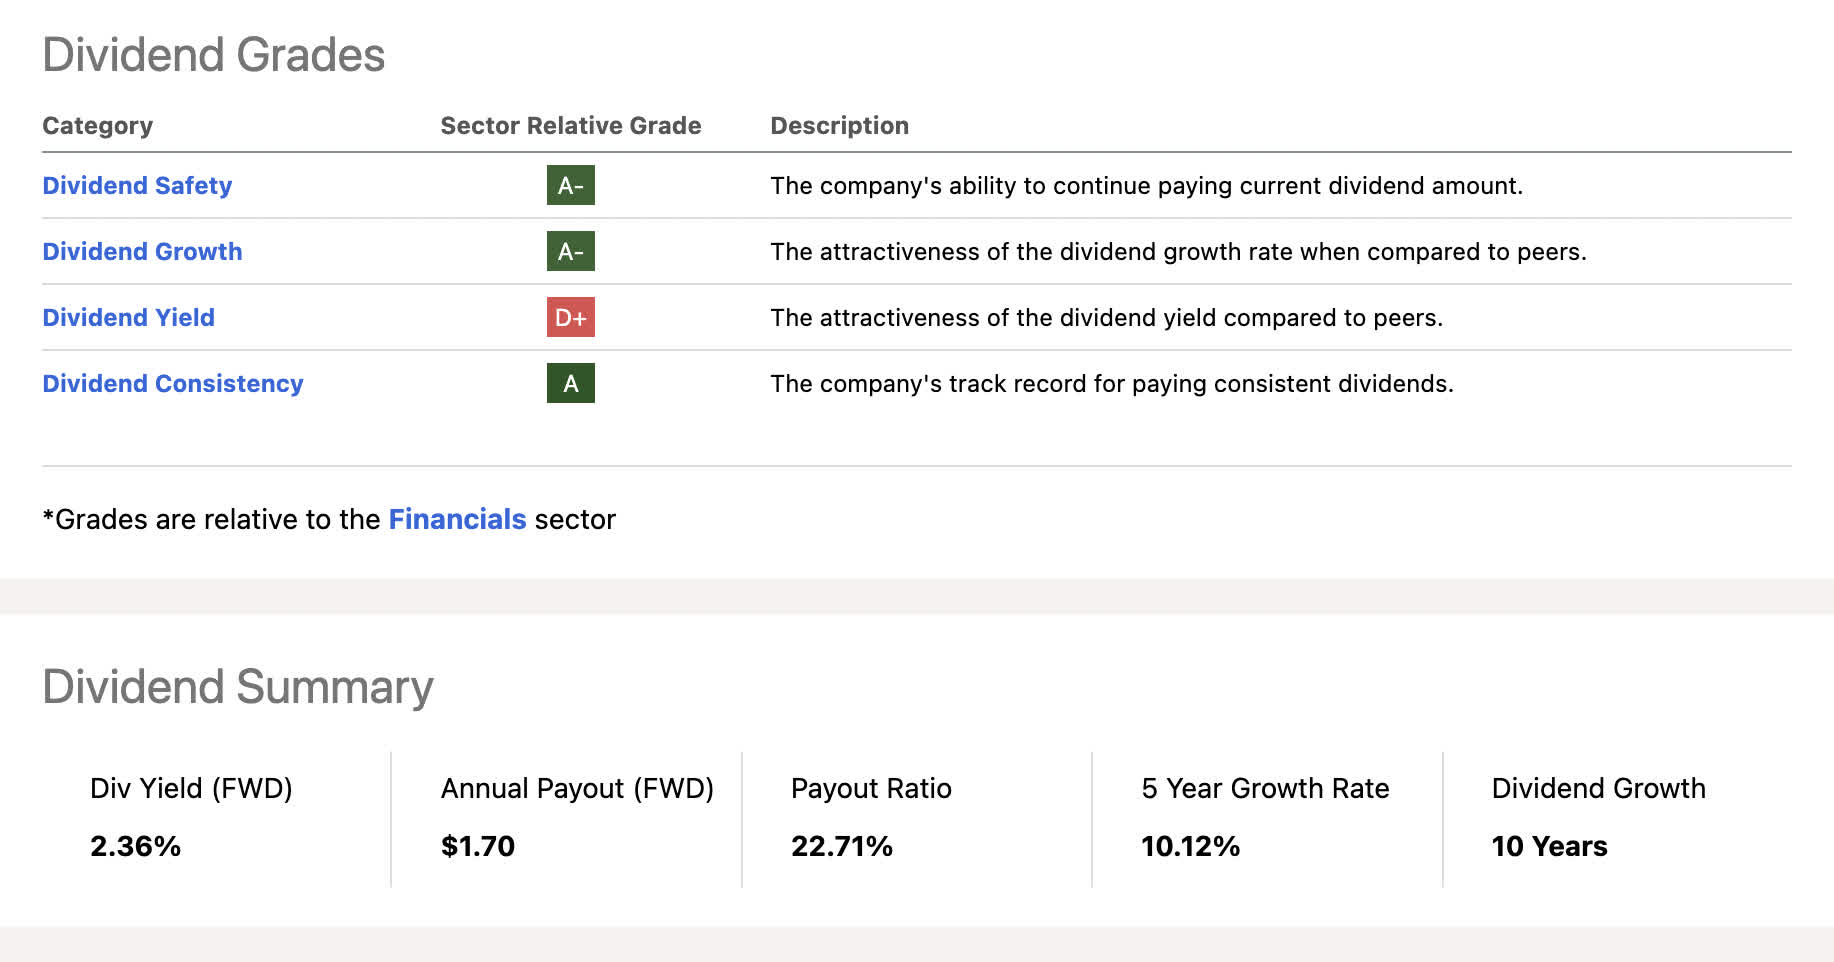
The company currently has a debt-to-equity ratio of 32.76%, ROE of 11.5%, a 2.33% yield with a 5 Yr dividend CAGR of 10.12%.
Data courtesy of Fact Set:
Revenue sources
| Property and Casualty Insurance |
| 59.23% |
| Life and Health Insurance |
| 27.09% |
| Asset Management and Financial Advisory Services |
| 14.4% |
| Reinsurance |
| 2.09% |
Dividend scores
EBIT/interest expense coverage
All numbers in millions courtesy of Seeking Alpha
- TTM EBIT= $2707
- TTM interest expense= $233
11.6 X coverage
Snap-on
Snap-on Incorporated is a widely diversified tool maker that not only builds and sells equipment but also provides diagnostics and repair information worldwide. With a wide range of products that have to do with industrial, automotive, and home-building equipment, Snap-on could face some cyclical downturns if manufacturing/homebuilding activity receded in a recession.
This is a dealer-purchased, rather than in-store tool provider with their in-house tech service focused on Enterprise and direct-to-business sales. The Wisconsin-based company is a profitable S&P 500 component. They also provide automotive emissions diagnostics equipment which is very durable and non-cyclical.
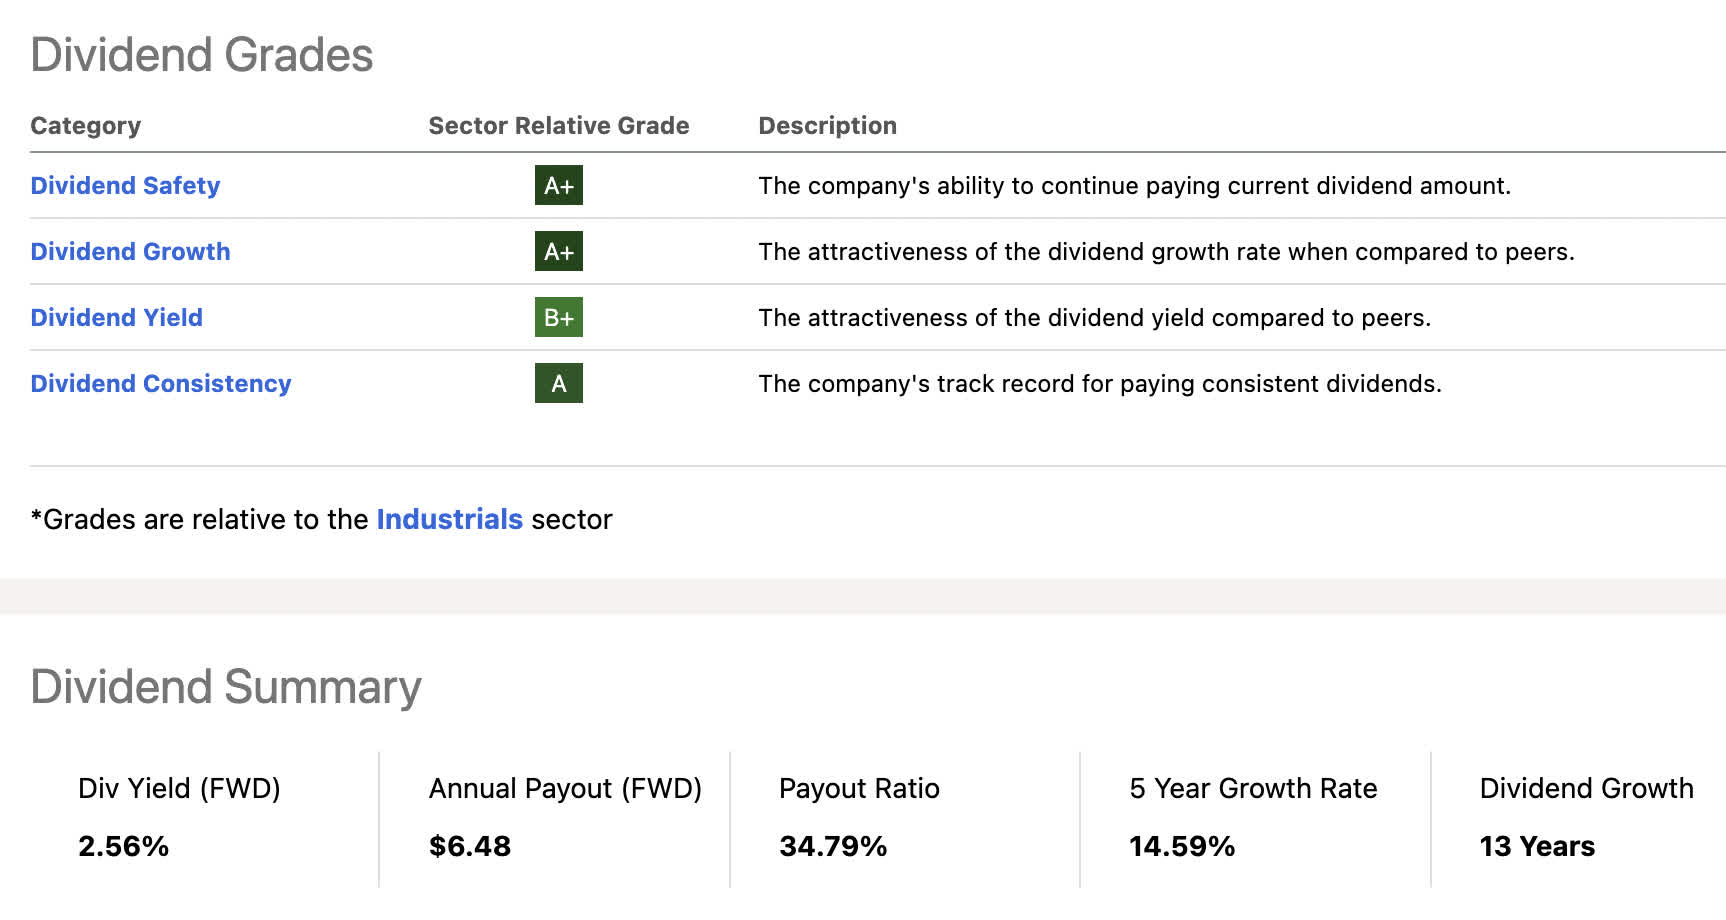
The company currently has a debt-to-equity ratio of 28.3%, ROE of 21.04%, a 2.56% yield with a 5 Yr dividend CAGR of 14.59%
Data courtesy of Fact Set:
Revenue sources
| Tools and Outdoor Care Equipment |
| 69.01% |
| Factory Automation Equipment |
| 23.77% |
| Commercial Finance Services |
| 7.22% |
Dividend scores
EBIT/interest expense coverage
All numbers in millions courtesy of Seeking Alpha
- TTM EBIT= $1,308
- TTM interest expense= $48.8
26.8 X coverage
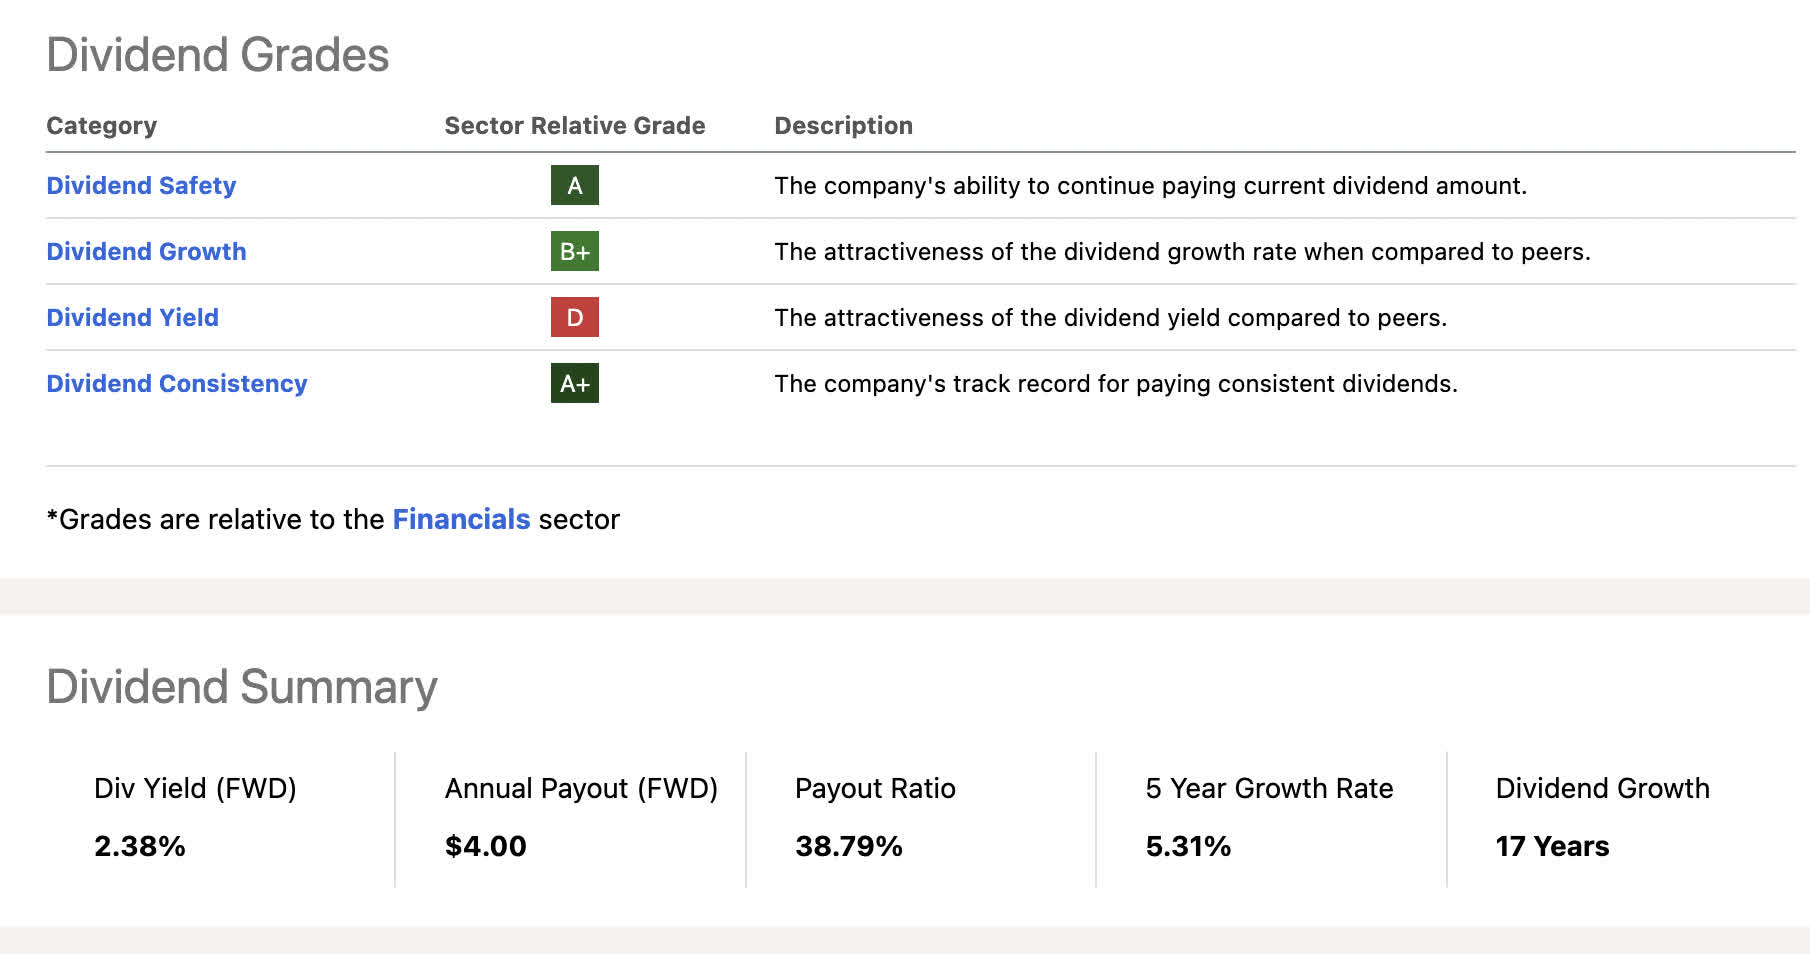
Travelers
This portfolio gets you different mixes of insurance types. The property and casualty king here is certainly Travelers. Although Fact Set defines the company's revenue sources as 100% within property and casualty, that umbrella term runs a wide gamut of insurance products. Casualty insurance spans individuals, businesses, and government departments. They even cover terrorism and ransom insurance. Out of the three insurance operators on the list, Travelers is running the lowest coverage of EBIT to interest expense at 7.72 X.
The company currently has a debt-to-equity ratio of 35.11%, ROE of 11.18%, a 2.38% yield with a 5 Yr dividend CAGR of 5.31%
Data courtesy of Fact Set:
Revenue sources
| Property and Casualty Insurance |
| 100% |
Dividend scores
EBIT/interest expense coverage
All numbers in millions courtesy of Seeking Alpha
- TTM EBIT= $2,751
- TTM interest expense=$356
7.72 X coverage
Summary
Increasingly so, searching out profitable, low-debt miserly managers of money will become a screening target for fund managers. When combining low debt with a large market cap and high returns on equity, the pickings become even slimmer.
All of these names have performed well over the past year and have the runway to continue meeting and exceeding earnings expectations. I am enjoying more broad-based strategies at this point until we find out whether or not the FED is fibbing about forward rate trends and whether or not the Federal government will kindly request a course reversal.
For further details see:
Playing Defense With Low-Debt Dividend Growers