DIA - Private Domestic Sector Prints A $122 Billion Surplus Pointing To Better Markets In August
2023-08-09 18:10:34 ET
Summary
- The article examines the US sectoral flows for July 2023 and assesses their impact on markets in August.
- The domestic private sector recorded a $122B rise in financial balances, driven by a large injection of funds by the federal government.
- The stock market is expected to continue its upward trend, supported by strong fiscal flows and positive global systemic liquidity flows.
The purpose of this article is to examine the US sectoral flows for July 2023 and assess the likely impact on markets as we advance into August 2023. This is pertinent as a change in the fiscal flow rate has an approximately one-month lagged effect on asset markets and is a useful investment forecasting tool. Other macro-fiscal flows can point to events months or years ahead.
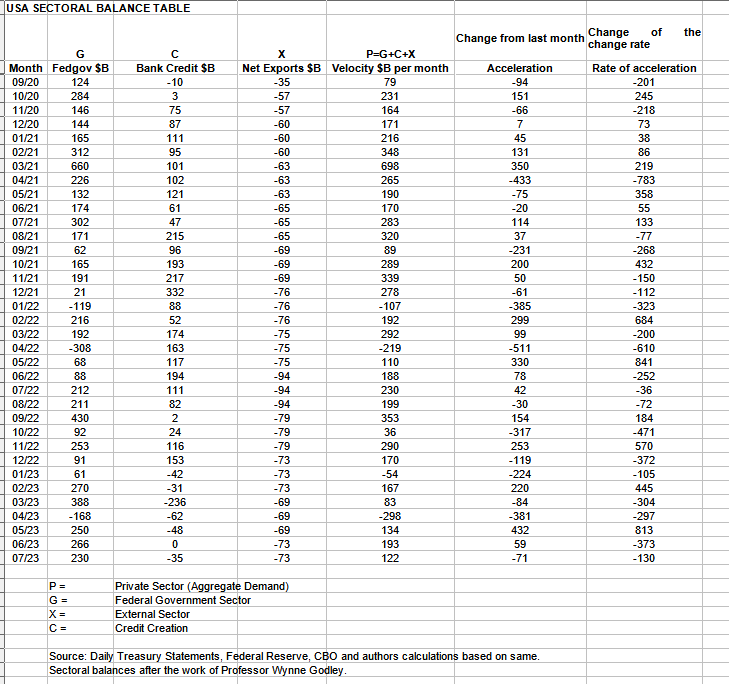
The table below shows the sectoral balances for the US which are produced from the national accounts.
US Treasury and author calculations
In July 2023, the domestic private sector recorded a $122B rise in financial balances overall, a positive result.
From the table, one can see that the $122+ billion private domestic sector addition of funds came from a large $230+ billion injection of funds by the federal government (and this includes the new injection channel from the Fed of around $8.28B from interest on reserves that went directly into the banking sector), less the -$73B billion that flowed out of the private domestic sector and into foreign bank accounts at the Fed in return for imported goods and services. The bank credit creation was a negative $35B as money was deleted via bad loan write-downs and repayment of other loans. There is a ton of potential spending power still to come once bank lending gets underway again.
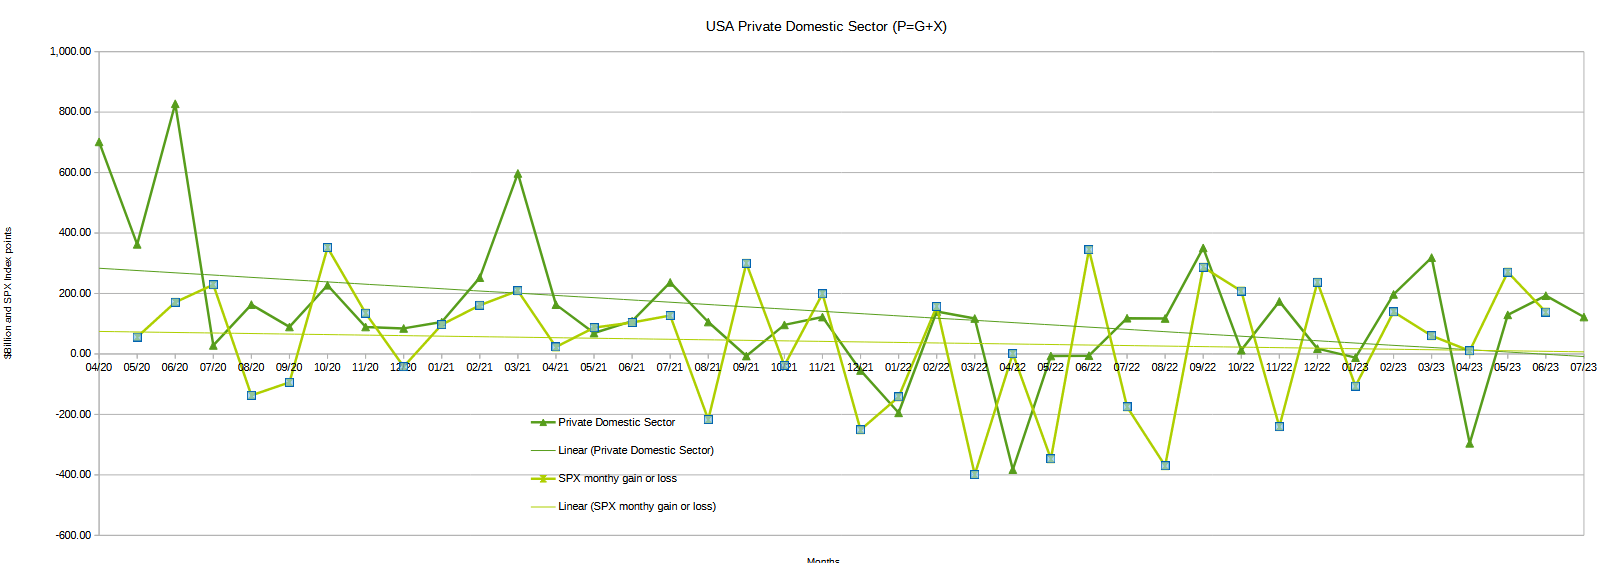
The chart below shows the sectoral balance data plotted in nominal terms. A trend line has been added to give an idea of the broad direction, which is downward for both the private domestic sector (where asset markets are located) and the SPX, though the private domestic sector balance is gently beginning to tilt upward. The calculation is federal government spending or G, plus the external sector (X and usually a negative factor) to leave that amount of money left to the private domestic sector, or P, by accounting identity true by definition.
The chart suggests that the SPX's next move would be for further gains following the upward move in the private-domestic sector balance. The SPX has continued its upward trajectory over the month and is most likely going to do the same in August given the private domestic sector balance is again positive if a little flatter than last.
US Treasury and author calculations
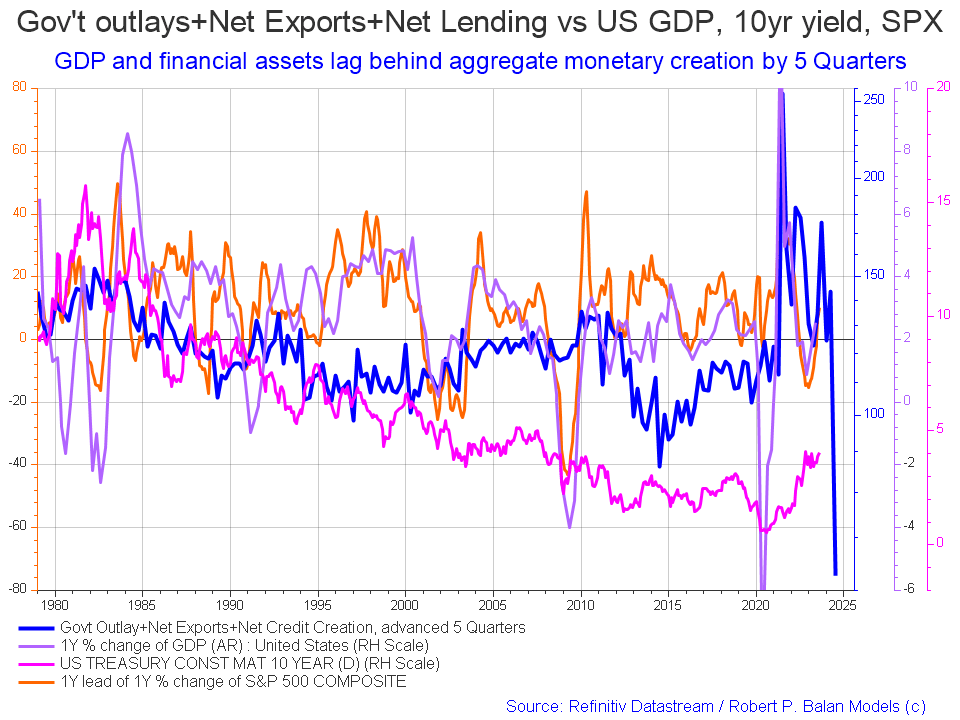
The following chart emerges when one graphs the change rate of the information in the US sectoral balances table above and adjusts for impact time lags. This is like a long-range market radar set.
Mr Robert P Balan
This chart updates from financial aggregates about once a month as they come out. This month one cannot look past the huge drop in the leading blue line of financial aggregates that will impact in late 2024.
The blue line shows the fiscal impulse from federal government outlays plus bank credit creation and less the current account balance and leads by up to five quarters (a year and three months). Short term, the financial aggregates and following co-variant factors are rising into the end of 2024 whereupon they come down sharply.
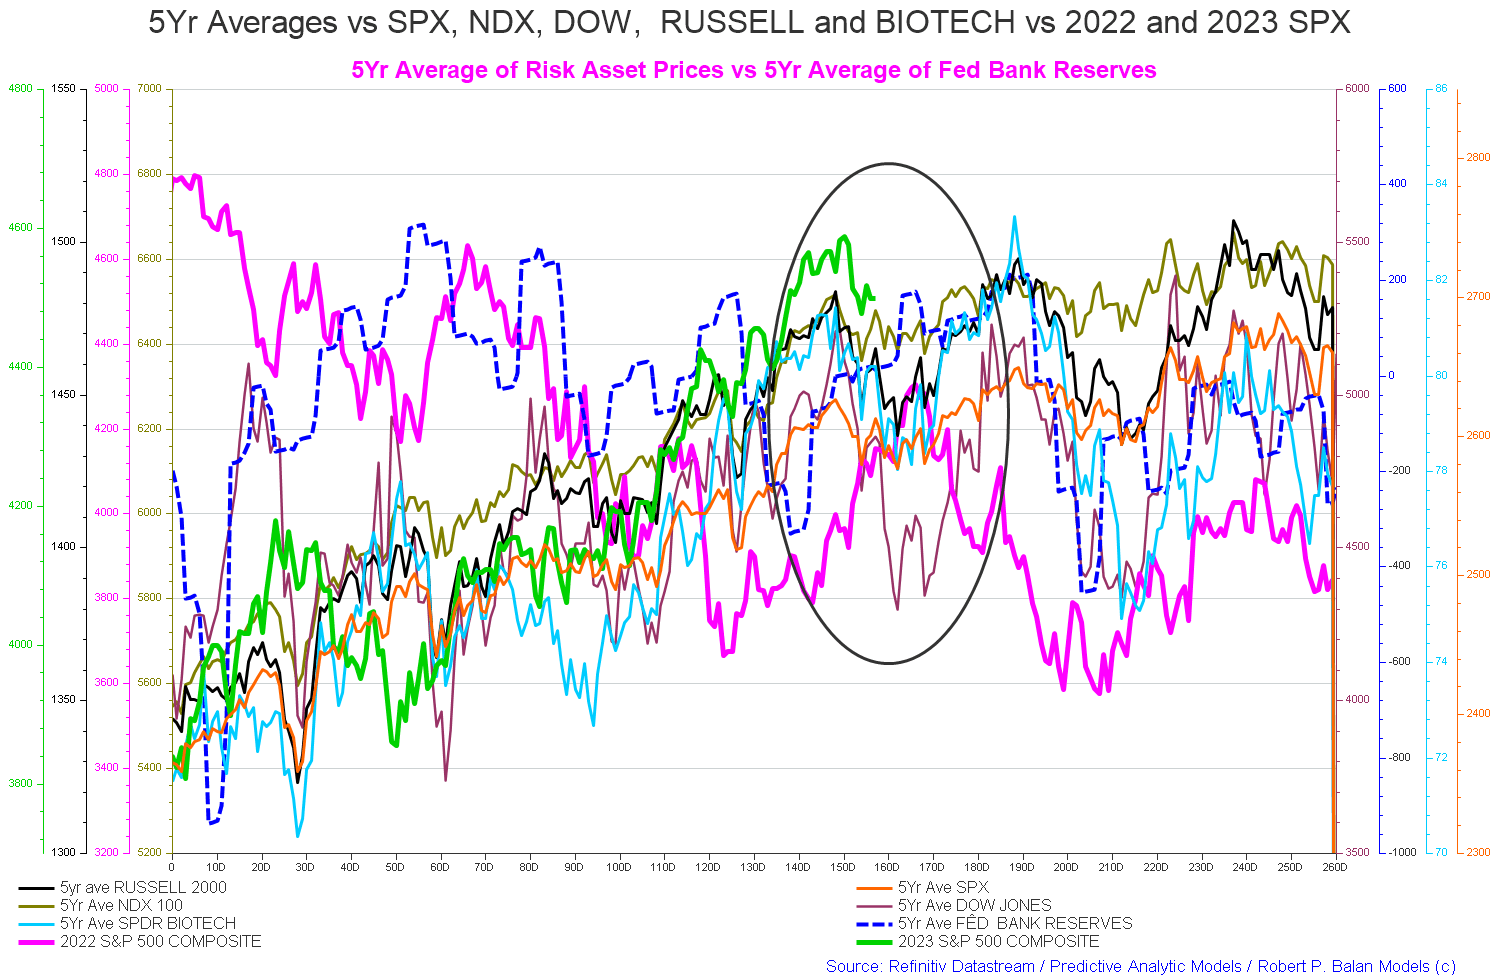
The chart below shows the five-year average of the seasonal stock market patterns for the SPX ( SPX ), NDX ( NDX ), Dow ( DIA ), Russell 2000 ( RTY ), and Biotech ( IBB ) market indexes. The black oval shows roughly where we are (trading day 158) at the time of writing and the end of the green line on the chart below.
The five-year index averages call for a drop now into trading day 160 (the first half of August) and then a rise into trading day 180 (the first half of September). Note that the overall trend is one of rising markets from left to right.
Mr Robert P Balan
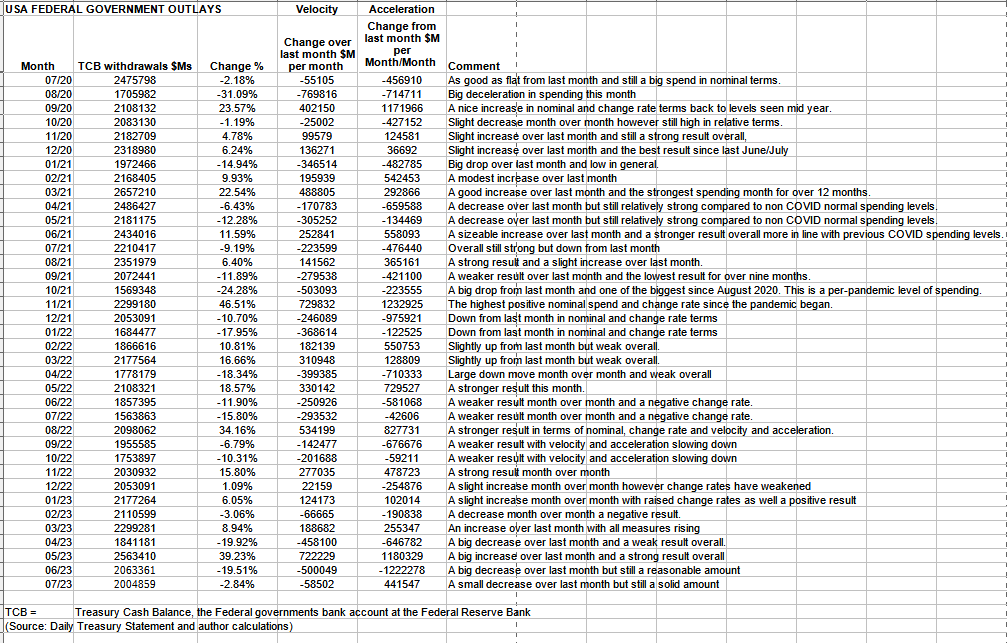
The table below shows the total federal government withdrawals from their account at the Federal Reserve Bank. A withdrawal by the federal government is a receipt/credit for the private sector and therefore a positive for asset markets.
US Treasury and author calculations
The table shows that total outlays were lower than last month but still a solid $2T+.
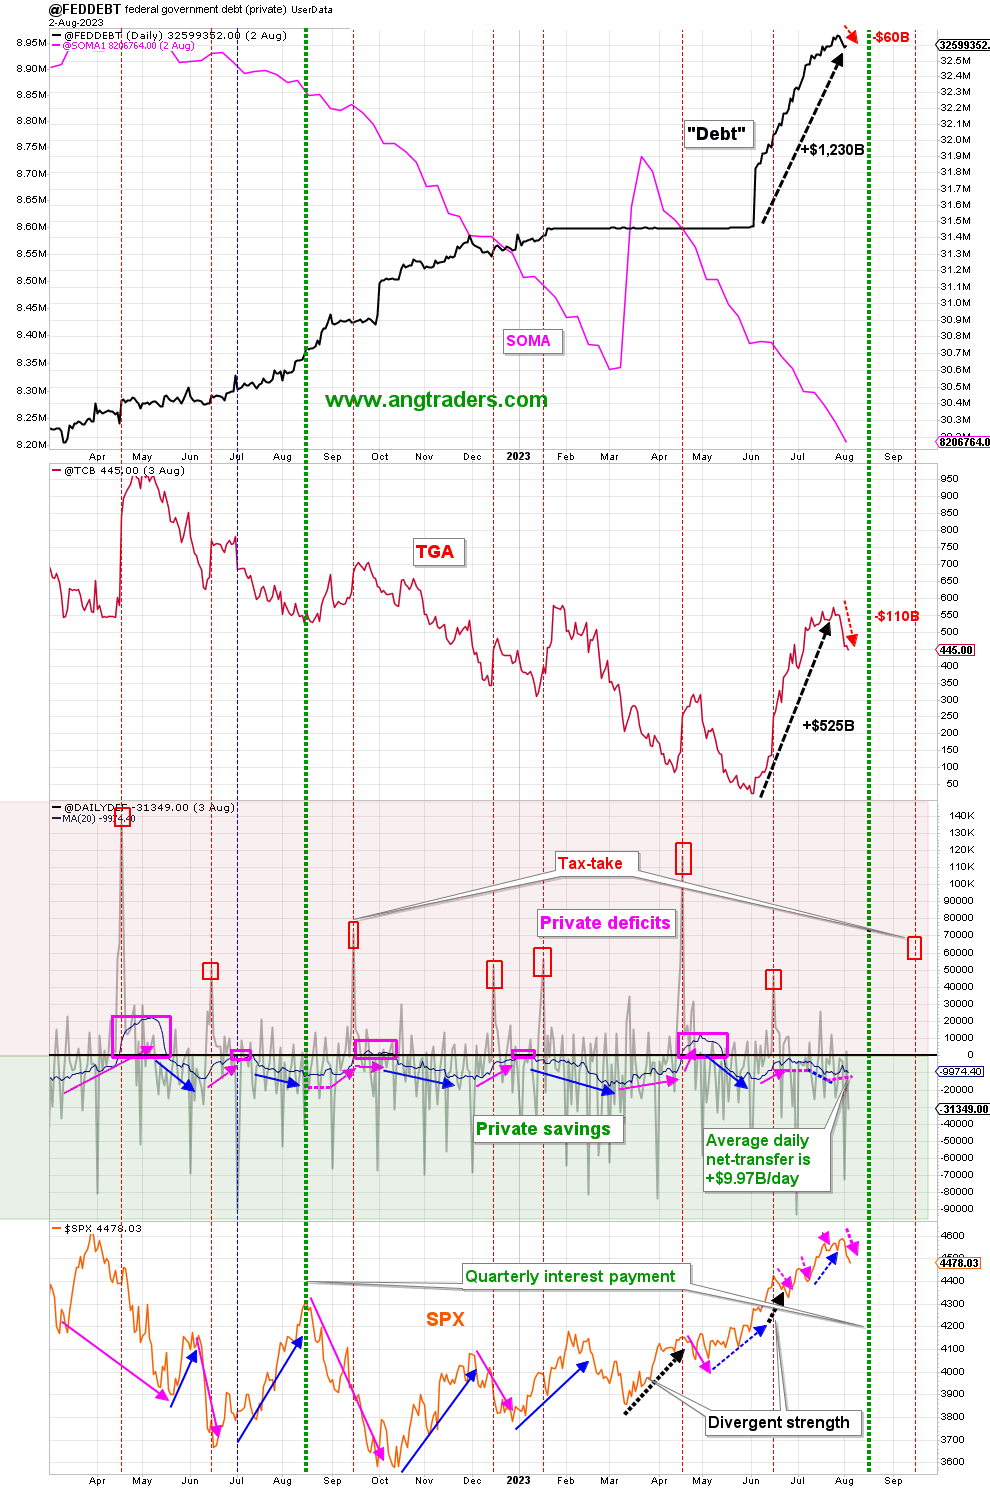
The chart below (bottom panel) shows graphically the relationship between the federal government (currency creator) and the private sector (currency user) and is from ANG Traders. The bottom panel highlights in red and green the financial relationship between the currency creator (red area) and currency users (green area). One's loss is the other's gain and vice versa, the difference is that the federal government creates the money via its central bank while the private sector does not have this luxury. Federal taxation removes spending power from the private sector but the federal government does not "need" the money as it can create, ad hoc, as much as it needs at any time.
Fund-Flows
- The SOMA continues to be reduced; swapping out Treasuries and MBS to reduce reserves.
- The "debt" (stock of Treasuries) has dropped back by ~$60B; this tends to weaken the SPX (see below).
- The TGA is lower by $110; this helps to moderate the effect of the "debt" reduction (above).
- The average daily net-transfer has flattened out, but remains at a healthy +$9.97B/day , down from last week's +$10.29B/day.
- A closer look (chart below), shows that the 20-day average daily net-transfer (+$9.97B/day) is still above the 220-day MA (+$6.70B/day). Last year at this time, the 220-day MA was only +$4.73B/day, a 42% difference. The net-transfer at this point in the fiscal-year is +$1,422B , which is 47% higher than the +$968B net-transferred last year at this time. At the current rate, we are on-pace to reach a +$1,700B net-transfer by September 30/23, 46% higher than +$1,166B in fiscal 2022.
(Source: Mr. Nick Gomez, ANG Traders, Weekly Report for Subscribers the Away from the Herd SA Market Service).
ANG Traders
The next major fiscal milestones are the mid-August Treasury interest payment and then a smaller Treasury interest payment in early September on the plus side of the ledger. Then on the negative side, there's the large federal tax collection in mid-September when corporations pay their next tax installment.
At the White House in the last month, more student loans were forgiven in a small move of compassion to the indebted classes.
The next Fed meeting is on 20-21 of September so we get a reprieve from the steady interest rate rises. In the meantime, the traditional annual central bankers meeting takes place at Jackson Hole on the 28-29 August where with no doubt another round of rate rises will be globally coordinated.
The impact of the last round of Fed rate rises can be read in more detail in my previous article .
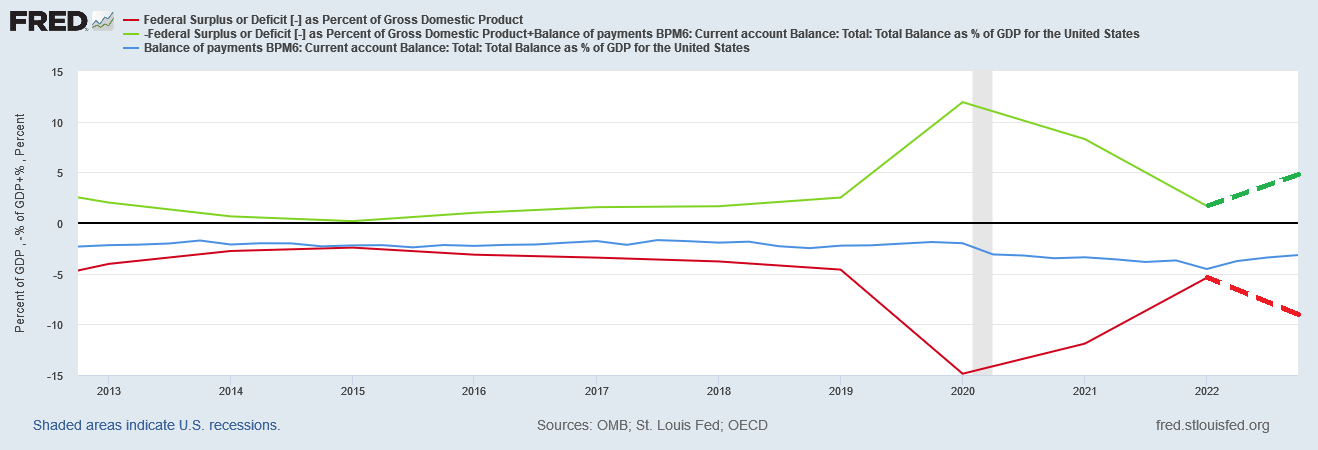
Last month the chart below produced the forecast for the US sectoral balances out to the end of the year and into the next. This is based on the federal spending deficit that is currently running at about 8% of GDP, the external balance is about -3% of GDP therefore making the private domestic sector balance at least 5% of GDP after the formula P = G + X.
FRED
In the meantime, the Levy Institute published an update to their own forecast of the US sectoral balances in this publication. The diagram below is taken from the Levy report .
Levy Institute
Note that the Levy Institute authors have reversed the poles on the sectoral balance polarity as compared to the earlier diagram above. The general shapes though are the same and see the private domestic sector balance expanding outwards into and past 2026. This is very reassuring complementary research.
The Levy report goes on to examine weakness in the economy with regard to household and business debt and presents the following two charts.
Levy Institute
While the household sector looks OK as compared to how it looked prior to the GFC in 2006-2008 the same cannot be said of the business sector. The next GFC event will most likely have its roots in the business sector where the impact of the Fed's interest rates is felt the most given that most business loans are short-term and on variable interest rates where the rate rises equal an almost instant increase in operating costs.
The household sector has some protection against the Fed's rate rise regime given that mortgage debt is to 90% protected behind a wall of 30-year fixed interest Jumbo loans. The same cannot be said for car loans and credit card debt though, these are ratcheting up with each Fed rate rise.
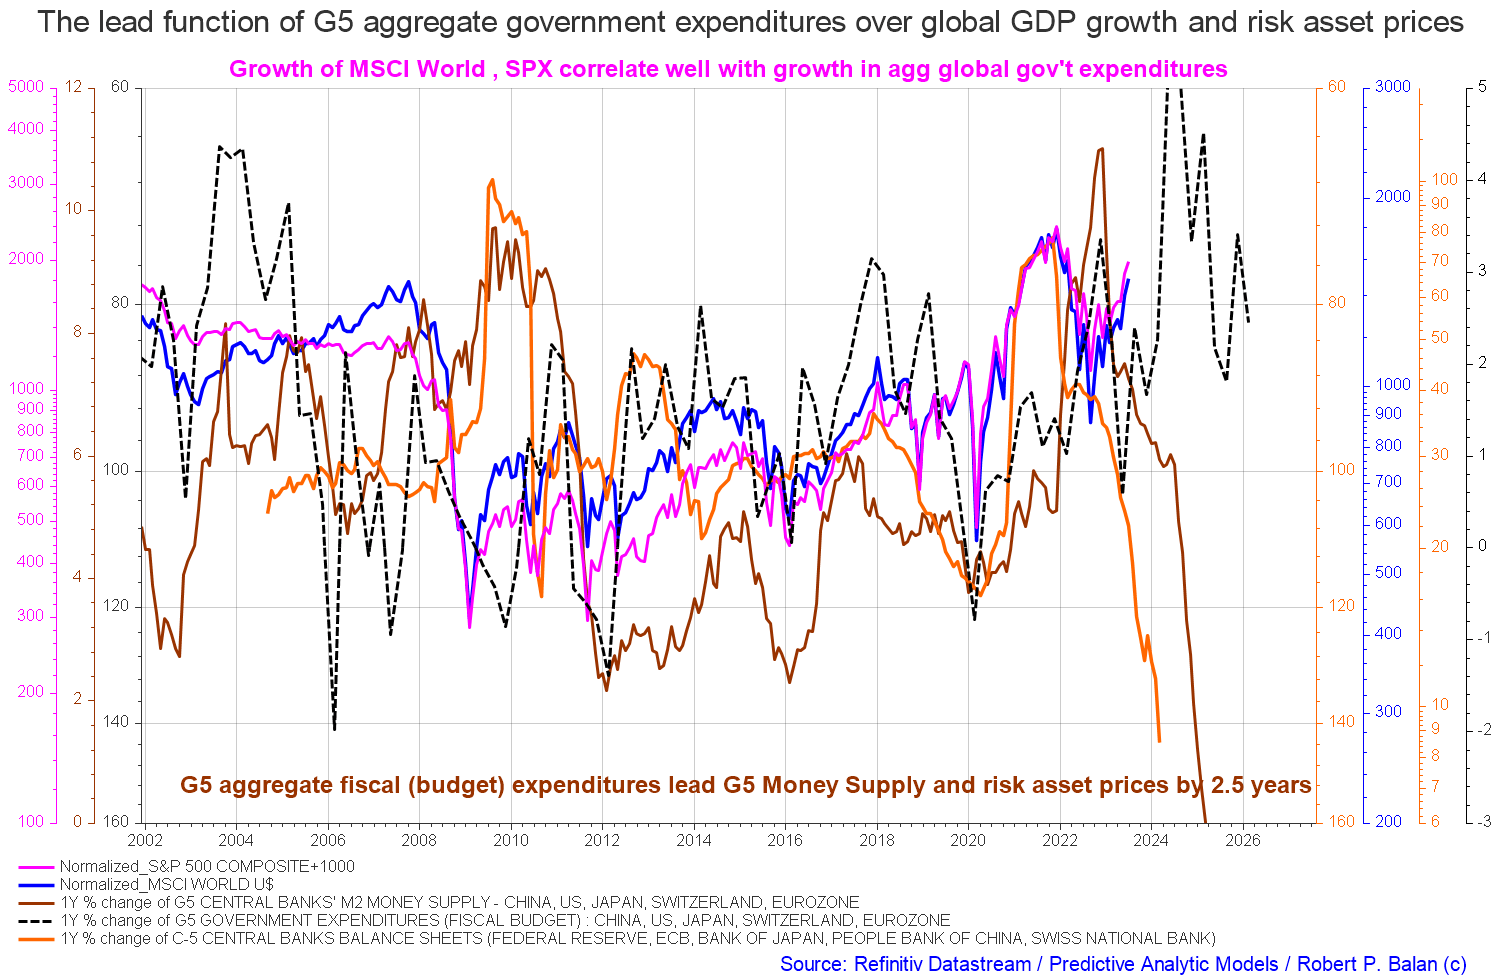
On the larger world macroeconomic side, we have the G5 chart below. The chart below comes from Mr. Robert P. Balan of the Predictive Analytic Models Market Service. The chart shows the level of money creation by the top five world governments (the G5) in a change rate format, along with a host of other indexes. This chart gives a sense of important inflection points and direction.
Mr Robert P Balan
The good news is that after navigating a large drop in monetary aggregates they are now broadly rising to a peak in mid-2024 with some turbulence along the way.
Another factor pointing to a peak in 2024 is the US Presidential election cycle shown in the chart below.
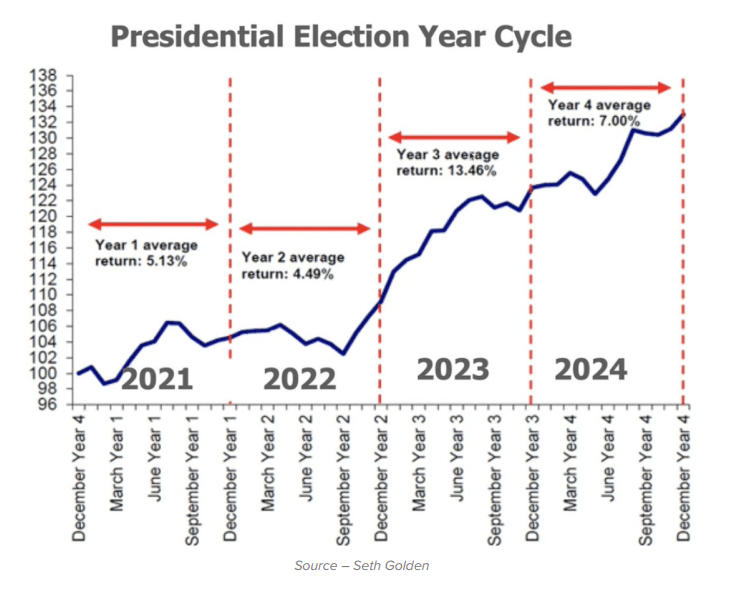
Mr Seth Golden
The incumbent president will follow the time-honoured practice of ensuring there is plenty of federal spending going into and through 2024 to give him the best chance of being popular with voters and getting another term in office.
If you are looking to make a market entry, sometime in the last quarter of 2023, the first quarter of 2024 is likely to be a good time judging by the macro tidal forces that underpin the asset markets.
For further details see:
Private Domestic Sector Prints A $122 Billion Surplus Pointing To Better Markets In August