PFIE - Profire Energy: Has Potential To Deliver Solid Returns (Technical Analysis)
2023-08-28 06:01:41 ET
Summary
- Profire Energy presents a solid medium to long-term investment opportunity, with a breakout in the stock's chart indicating bullish potential.
- PFIE stock has a history of successful breakouts and the current breakout is the strongest yet, with high volume and a long consolidation period.
- In addition to technical analysis, PFIE's recent financial performance, including revenue growth and improved gross margins, makes it an attractive investment option.
So, I was scanning charts to see if there are some good opportunities in the short term. But instead, I stumbled upon a chart that caught my eye. The chart indicated a solid medium to long-term investment opportunity. I generally prefer fundamental and financial analysis for long-term investment, but this was a different case. The chart was too good to ignore, but still, I could not ignore the financials, so I went ahead to see the financials, and I didn’t see any red flags. So I decided to write about the company named Profire Energy ( PFIE ). I think this can be a solid medium to long-term investment option; hence, I assign a buy rating on PFIE.
Technical Analysis [Monthly Time Frame Analysis]
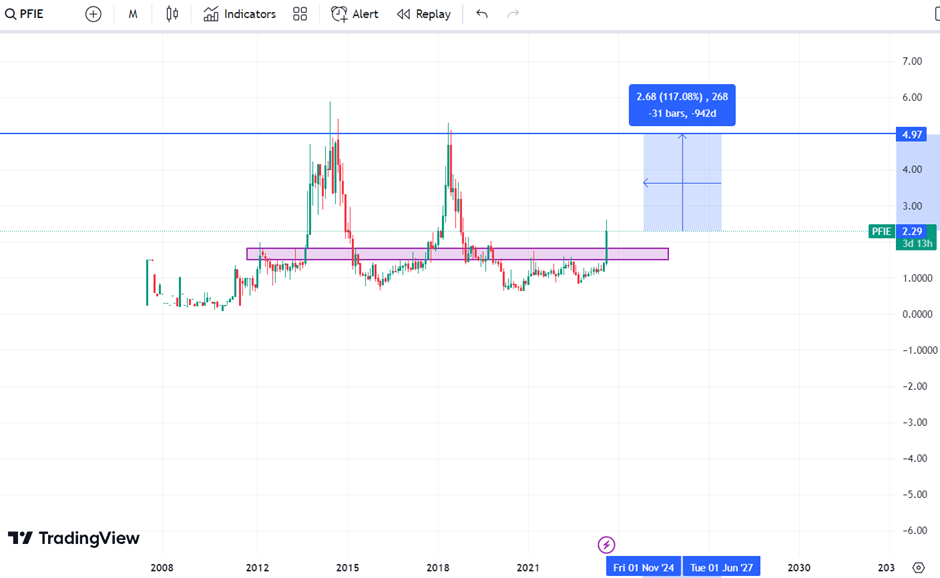
In my opinion, for a long-term investment, a monthly time frame analysis. In 2014, the stock made a high of $6, but after making the high, the stock fell down to the level of $0.65. But after being in a downtrend for about four years, the stock started its upward journey and reached the level of $5.3. But after reaching the level, the stock made a double top pattern and again started to fall and reached $0.65. The stock started to consolidate around the level of $0.65-$2, which went on for about six years. But after six long years, the stock has finally broken out of the range with a huge green candle, which is a bullish sign. The possibility of a breakout being successful increases when the breakout has come after a long consolidation, and in this case, the consolidation period was about six long years. So, I think the possibility of this breakout being successful is quite high. In addition, the volume in this candle is the highest in the past 30 months. Now, let's go back to the past and see how the stock has behaved historically. We can see that a similar breakout occurred in September 2013 when the stock broke the $2 level and closed above it for the first time, and after giving the closing, the stock increased by more than 200%. The time the stock took to move 200% was 305 days, and before this breakout, there was a consolidation for about 17 months. The second time the stock gave a strong breakout above $2 was in September 2017, and from the breakout level, the stock moved up by 170% and achieved it in 240 days. Similarly, this time, there was a huge consolidation before the breakout, and the consolidation period was about 850 days. So this is like history repeating itself, but the breakout is the strongest this time. Because the volumes are the highest compared to the past two breakouts, and the consolidation period this time was the highest. So, I believe this a great buying opportunity because I think the stock can move up by 117% to the $5 level because currently, there is no resistance or major level from which the stock might face selling pressure. The next major resistance that I see is the $5 level because, in the past, the stock has reversed from that level after giving a strong upward rally. Hence, my target for the stock is $5, and I think the target can be achieved in one year because this breakout is similar to past breakouts.
Technical Analysis [Weekly Time Frame Analysis]
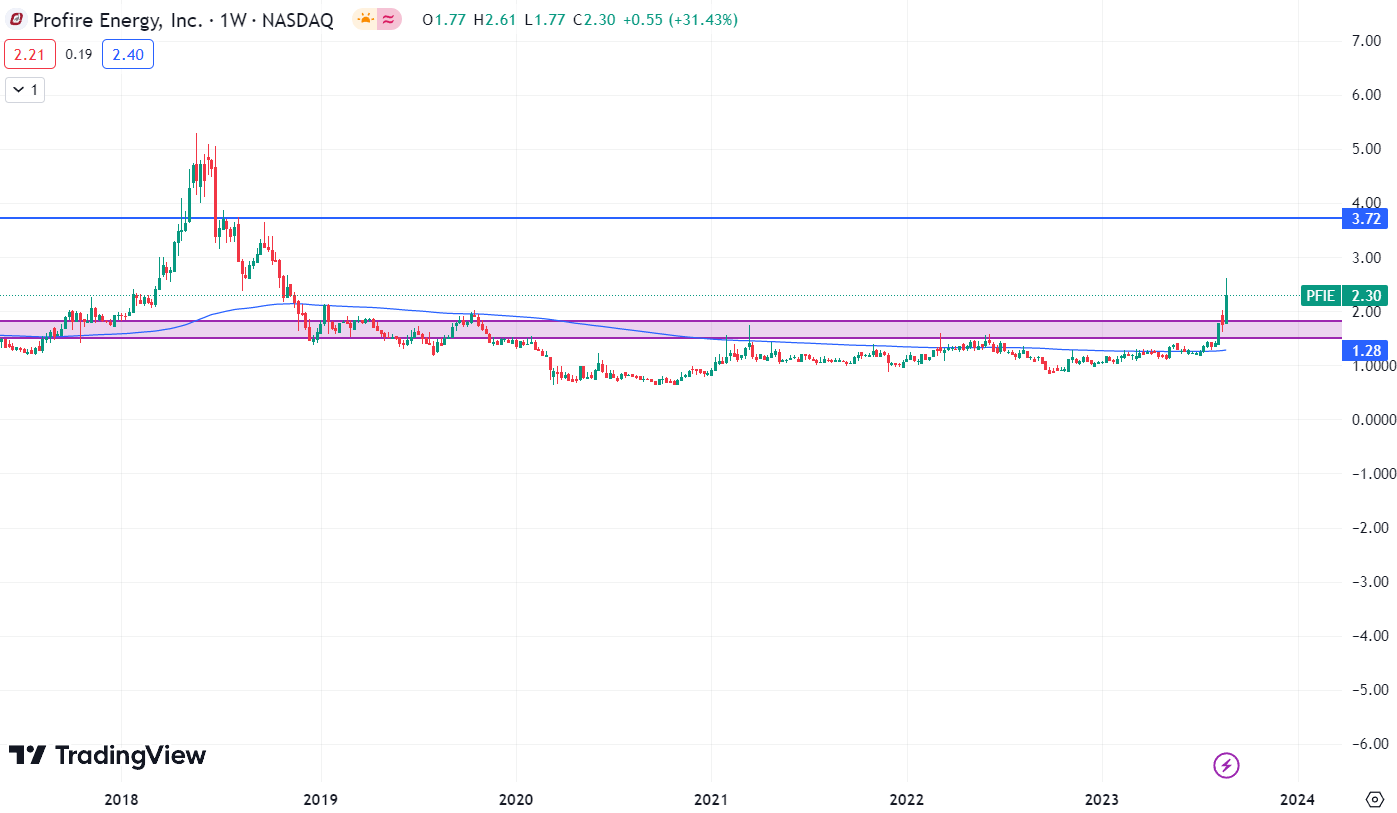
Although monthly time frame analysis is always the strongest and most reliable for long-term investment analysis, my personal favorite is weekly time frame analysis because we can predict how the stock may behave in the short or medium term. PFIE is trading at the $2.3 level. In the weekly time frame, too, the stock is looking bullish. In the last four days, the American market is down by 1%, but despite weakness in the American market, this stock has risen more than 25% in the last four days. This indicates that buyers are active in this stock. After being in a downtrend for a long time, this stock is showcasing strength and outperforming the market. The next resistance level that the stock might face is $3.7, but there are no obstacles to stop the stock at the current level. Hence, I see the stock reaching the $3.7 level soon. Hence, I believe the stock is looking good in both the short term and long term. So, I assign a buy rating on PFIE with a target of $5. This target can be achieved in one year, and for the short term, my target for the stock is $3.7.
Should One Invest In PFIE?
Now, looking at the recent financial performance of the company. Their revenue in Q2 FY23 was $14.4 million, a significant rise of 50% compared to Q2 FY22. The company credited its diversification efforts for the revenue increase. Their gross margins in Q2 FY23 was 51.3%, which was 45.7% in Q2 FY22. I think increased fixed-cost recovery from increased sales and higher pricing were the major reasons behind the significant improvement in the gross margin. In addition, despite a 50% increase in revenue in Q2 FY23 compared to Q2 FY22, its operating expenses in Q2 FY23 declined by 2.7% compared to Q2 FY22, and when compared to the Q1 FY23, the operating expense in Q2 FY23 saw a decline of 6.6%.
Additionally, compared to Q2 FY22, their net income went up more than ten times in Q2 FY23. Their cash & cash equivalents by the end of June 2023 increased by 11.6% compared to December 2022. In my opinion, the technical setup and the company's financials are perfect. Their financial performance was excellent in Q2 FY23.
Now, talking about PFIE's valuation. PFIE has a P/E [FWD] ratio of 11.15x, which is way lower than its five-year average of 32.96x. PFIE has an EV / Sales [TTM] ratio of 1.66x, which is lower than the sector median of 2.15x. It shows that PFIE is currently trading at a great discount and is undervalued. If we compare PFIE to some of its peers, like NGS and ESOA , we can see that it has been outperforming its peers. PFIE has a revenue growth [YOY] of 62.36%, and its peers NGS and ESOA have a revenue growth [YOY] of 28.23% and 58.55%, respectively. So, I believe the performance of PFIE is solid, and the strong growth makes them undervalued.
The company's revenue growth has been significant, and the company is looking financially and technically strong. In addition, the company looks undervalued. Hence, I assign a buy rating on PFIE.
Risk
The company's operations are impacted by municipal, provincial, state, federal, and international rules and regulations on the gas and electric safety standards and codes currently in use in the oil and gas industry, as well as laws and regulations on worker safety and environmental protection. To comply with applicable environmental legislation during the fiscal years ended December 31, 2022, and December 31, 2021, respectively, they did not incur any significant direct costs. However, given that environmental rules and regulations on the oil and natural gas business are frequently subject to change, there can be no assurance that this will be the case in the future.
Bottom Line
The technical setup of PFIE is looking perfect, and the company's financials have improved significantly. In addition, the company looks undervalued. So, I believe this can be a great buying opportunity because I think it can provide significant returns to investors in the next twelve months. Hence, I assign a buy rating on PFIE.
For further details see:
Profire Energy: Has Potential To Deliver Solid Returns (Technical Analysis)