PSCT - PSCT: 17% Profitability Gap A Small-Cap Tech Risk Or Opportunity?
2023-10-21 08:22:32 ET
Summary
- PSCT holds 63 small-cap tech stocks with a 7.08% weighted average net income margin. In contrast, XLK, a big-tech S&P 500 fund, has a 24.17% margin, a 17-point difference.
- Lower profitability is normal with small-cap stocks. However, what's not normal is no growth potential advantage. PSCT actually offers less estimated sales and EBITDA growth than its large-cap peer.
- PSCT has substantially lagged XLK over the last seven years, and is off by more than 30% in 2023. I expect this underperformance to continue.
- The main reason to buy PSCT is to diversify by size. However, I consider the profitability gap too big and don't see it outpacing XLK moving forward. For these reasons, I've assigned a "sell rating" to PSCT.
Investment Thesis
The Invesco S&P SmallCap Information Technology ETF ( PSCT ) is an obvious choice for tech investors seeking to hold companies with exceptional growth potential. However, after a review of its fundamentals, I've determined PSCT offers only marginally higher estimated earnings per share growth than plain vanilla large-cap counterparts like FTEC, IYW, XLK, and VGT, and that comes with a significant sacrifice on quality. With 10% more volatility and net income margins at just 7.08%, the risk-to-reward is too high, so I recommend readers avoid PSCT now.
PSCT Overview
Strategy Discussion
PSCT tracks the S&P SmallCap 600 Capped Information Technology Index, holding 63 small-cap Technology stocks according to Global Industry Classification Standards. As a subset of the S&P SmallCap 600 Index, the Index is float-adjusted market-cap-weighted with a market cap range between $850 million and $5.2 billion. A cap applies to any individual company with a weight greater than 22.5% (buffer at 25%), and the sum of all companies with weights above 4.5% cannot exceed 45% of the total weight (buffer at 50%). Finally, the Index rebalances after the close of business on the third Friday of March, June, September, and December, with reference dates the month prior.
The profitability requirement for all members of the S&P Composite 1500 Index is worth noting. Specifically, the sum of the last four quarters of GAAP earnings should be positive, as should the most recent quarter. However, this rule applies only to new members. A committee uses factors like turnover and sector representation when deciding on Index changes. While I appreciate any profitability screen for small-cap stocks, I'll demonstrate later how the screen appears insufficient.
Sub-Industry Exposures and Top Ten Holdings
PSCT holds 63 stocks across nine GICS sub-industries, as follows:
- Electronic Components: 16.69%
- Semiconductors: 15.73%
- Electronic Equipment & Instruments: 14.41%
- Application Software: 13.49%
- Semiconductor Materials & Equipment: 11.86%
- Systems Software: 9.50%
- Communications Equipment: 8.75%
- IT Consulting & Other Services: 6.93%
- Technology Hardware, Storage & Peripherals: 2.63%
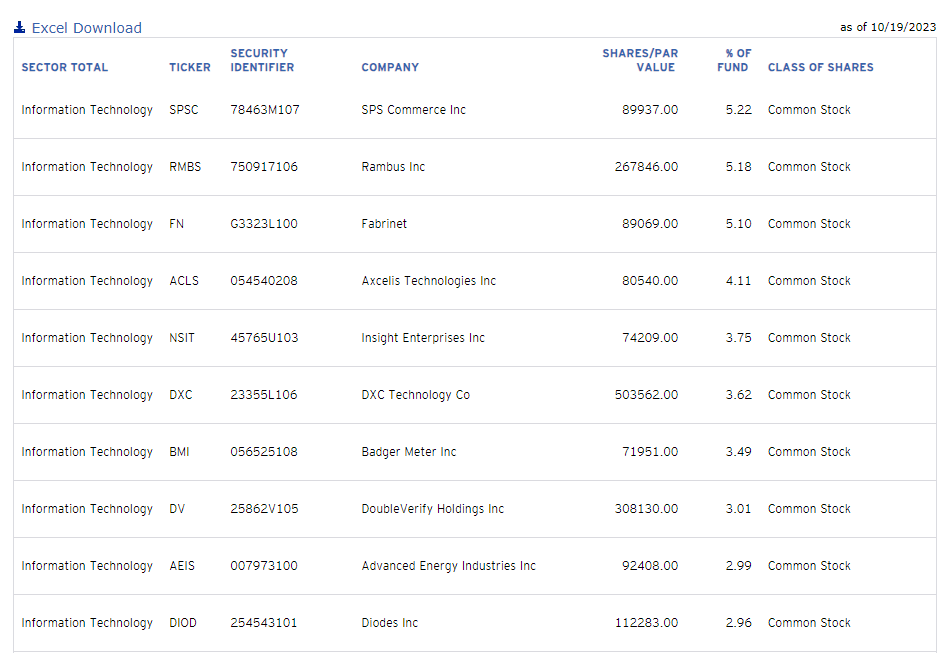
Its top ten holdings are below, totaling 39.43%. In contrast, the Technology Select Sector SPDR ETF ( XLK ), which holds Technology stocks in the S&P 500 Index, has a 70.58% concentration in its top ten holdings, including 47.03% to Apple ( AAPL ) and Microsoft ( MSFT ). Diversifying into small-caps may make sense if you have specific concerns about these two stocks. Still, the grass isn't always greener on the other side, as the saying goes.
As for small-cap Technology ETFs, PSCT is the only option available. With a weighted average market capitalization of $3.08 billion, only the Jacob Forward ETF ( JFWD ) comes close at $7.40 billion, and that's a multi-sector fund with significant exposure to Health Care stocks. However, PSCT's exclusivity has yet to win over investors. Since its launch in April 2010, PSCT has just $286 million in assets under management and a 0.29% expense ratio. Still, PSCT is the most popular fund in Invesco's line of small-cap sector ETFs, including PSCD , PSCC , PSCE , PSCF , PSCI , PSCM , and PSCU .
Performance Analysis
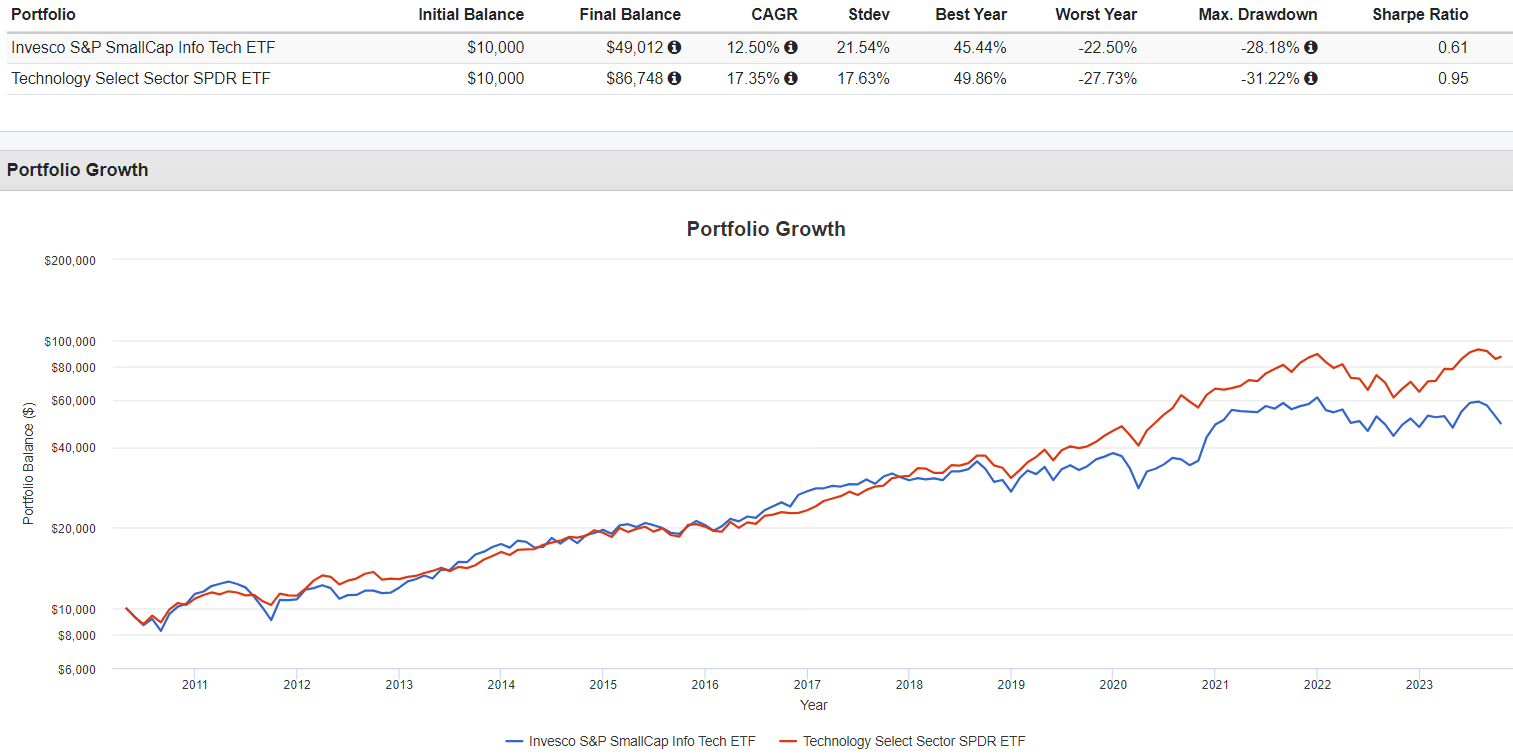
Since May 2010, PSCT has delivered a 12.50% annualized return compared to 17.35% for XLK. As is the norm for small-cap ETFs, PSCT also experienced higher volatility, as measured by its annualized 21.54% standard deviation figure, than XLK. The result was worse risk-adjusted returns (Sharpe Ratio).
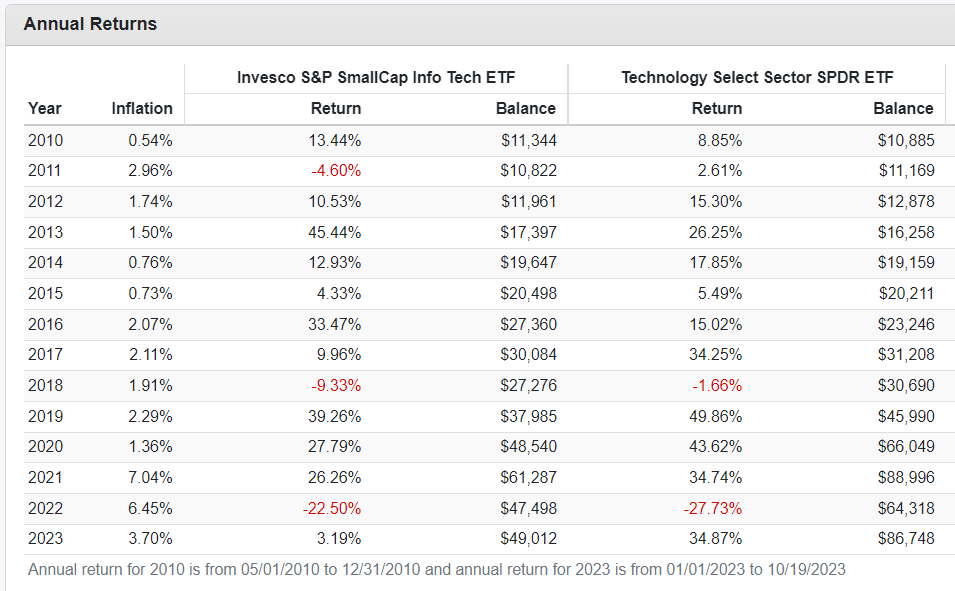
As shown below, PSCT substantially outperformed by 19.20% in 2013 (45.44% vs. 26.25%) and 18.45% in 2016 (33.47% vs. 15.02%). However, it also averaged a 20.60% underperformance in 2017, 2019, 2020, and 2023. YTD through October 19, 2023, PSCT trails XLK by 31.69%, the most on record, and its 3.19% YTD gain is just fourth-best since 2010.
By design, PSCT doesn't hold mega-cap stocks like XLK, and while it's sometimes prudent to diversify by size, avoiding these high-quality names has not been a winning strategy over the last seven years. Valuation concerns aside, mega-cap stocks often bounce back quickly after declines because they are highly profitable. For example, Apple declined 3.02% in 2015 but recorded 12.48% and 48.48% gains in 2016-2017. One year later, Apple declined by 5.39%, only to post 88.97% and 82.31% gains in 2019-2020. Finally, a 26.40% decline in 2022 preceded a 35.62% gain in 2023. XLK seems to be the better choice for passive investors.
PSCT Fundamentals
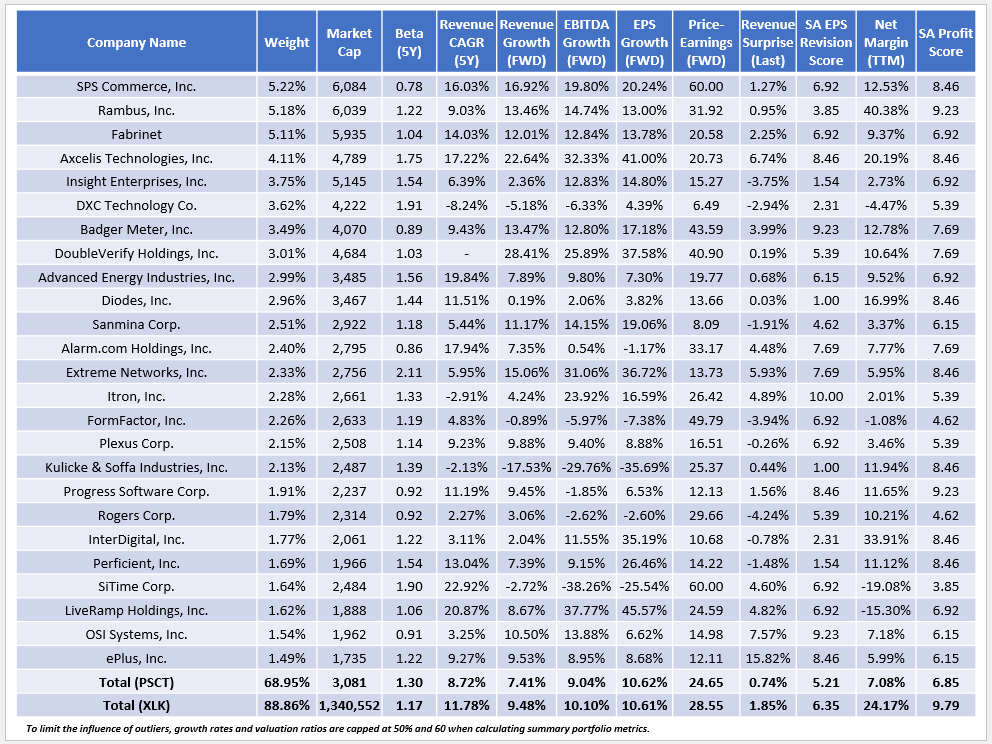
That doesn't mean small-cap tech stocks don't offer opportunity. To evaluate this potential, I've compiled a table highlighting selected fundamental metrics for PSCT's top 25 holdings, totaling 68.95% of the portfolio. Several growth metrics that might appeal to small-cap tech investors and how they compare with XLK are included.
I want to make a few observations:
1. Consistent with the higher standard deviation figures discussed earlier, PSCT features a higher five-year beta (1.30 vs. 1.17) mainly because of high allocations to Semiconductor and Semiconductor Materials & Equipment, sub-industries with weighted average 1.45 and 1.60 five-year betas. I recently covered the iShares Semiconductor ETF ( SOXX ) and determined the risk was excessive after its valuation edge disappeared with the rise of stocks like Nvidia ( NVDA ).
2. PSCT features 7.41% and 9.04% estimated sales and EBITDA growth, 1-2% less than what XLK offers. Estimated earnings per share growth is the same at 10.62% and 10.61%. This wasn't the case six months ago when PSCT held a 2.66% advantage on EPS growth (11.84% vs. 9.18%), so it's disappointing for an ETF whose main attraction is high growth potential.
3. PSCT trades at 24.65x forward earnings, 3.90 points less than XLK. This discount represents partial compensation for the extra risk of owning less profitable small-cap tech stocks. However, the difference with XLK is enormous. PSCT's weighted average net income margin is only 7.08% compared to XLK's 24.17%. Furthermore, 46/63 constituents (61.73% of total weight) have margins less than 10% compared to 18/64 (12.12% of total weight) in XLK. Given how analysts expect only 10.62% EPS growth over the next year, this margin gap likely won't narrow anytime soon.
4. PSCT's constituents barely met sales expectations last quarter per its 0.74% weighted average sales surprise. Unfortunately, the trend is negative, with the previous two quarterly surprises of 2.48% and 2.33%. As good of a year as it has been for Technology stocks, the enthusiasm might be wearing off. While still earning into Q3 earnings season, Badger Meter ( BMI ) reported a 3.99% and 8.85% sales and earnings surprise, while SMART Global Holdings ( SGH ) missed by 15.57% and 23.06%. PSCT's 5.21/10 EPS Revision Score, derived from individual Seeking Alpha Factor Grades, also suggests less optimism vs. big tech.
Investment Recommendation
PSCT has substantially underperformed XLK over the last seven years, and I expect that to continue. It's normal for small-caps to be less profitable, but the 17% difference in net income margins is huge, and PSCT doesn't offer any earnings growth advantage over XLK and still trades at nearly 25x forward earnings. Along with an inferior track record, which includes lower risk-adjusted returns, I can't find a good reason to buy PSCT other than for diversification. That's not an approach I favor, so I recommend tech investors avoid PSCT and stick with XLK. Thank you for reading, and I look forward to the discussion in the comments below.
For further details see:
PSCT: 17% Profitability Gap, A Small-Cap Tech Risk Or Opportunity?