PHM - PulteGroup: No Margin Of Safety Based On A Cyclical Perspective
2023-06-25 06:20:59 ET
Summary
- Pulte is a cyclical company with no revenue growth over the latest Housing Starts cycle from 2005 to 2022, despite acquisitions.
- Pulte is financially sound, but not considered a growth company; it is more appropriate to value it based on its Earnings Power Value (EPV).
- The EPV of Pulte over the cycle shows no margin of safety, even if assuming a 1/3 increase in long-term annual average Housing Starts.
- There is only a margin of safety if you assumed that it is not a cyclical company. But this is not supported by the evidence.
Investment Thesis
PulteGroup, Inc ( PHM ) is a cyclical company. During the latest Housing Starts cycle from 2005 to 2022 (peak-to-peak), there was hardly any growth in Pulte's revenue. This was despite several acquisitions in 2016, 2019, and 2020.
Over the past 70 years, there was no growth in the long-term annual average Housing Starts. However, there was growth in the Housing Price Index. I would not consider the sector as a growth one.
As such I valued Pulte based on its Earnings Power Value. A valuation of Pulte over the cycle on such a basis showed that there is no margin of safety. This is even if you assumed that there would be a 1/3 increase in the long-term annual average Housing Starts.
Thrust of my analysis
In my article “ Home Builders' Base Rates: A Reference For Better Fundamental Analysis ”, I identified the top 9 listed home builders. These are companies with readily available financial data from 2005 to 2022 – the latest peak-to-peak Housing Starts cycle. Pulte is one of the companies on that list.
I had previously determined the intrinsic value of Lennar and Toll Brothers based on their performance over the 2005 to 2022 cycle. Refer to:
- Lennar – the market is pricing a change in the long-term Housing Starts.
- Toll Brothers: No Margin Of Safety Even With Uptick In Long-Term Annual Average Housing Starts.
I will analyze and value Pulte based on the same approach. This is the third article in my series to determine the cyclical value of the top 9 home builders. To recap:
Pulte is a cyclical company and as such any analysis and valuation should be based on its performance over the cycle.
While nobody disputed the cyclical nature of the sector, we have different views on the long-term annual Housing Starts. As such I valued Pulte based on 4 Scenarios:
- Scenario 1 – no change in the long-term annual Housing Starts of 1.5 million units.
- Scenario 2 – an increase in the long-term annual Housing Starts to 2.0 million units.
- Scenario 3 - no change in the long-term annual Housing Starts of 1.5 million units. Given the improvements in gross profitability, I scaled the Gross Profit Margins to account for this improvement.
Scenarios 1, 2, and 3 were based on the Gross Profits for the homebuilding segment = Settlements X Selling Price X Cyclical Gross Profit Margins. The Cyclical Gross Profit Margins were assumed to be the average 2005 to 2022 Gross Profit Margins.
I also considered Scenario 4 where I assumed that Pulte is not a cyclical company.
Pulte has 2 major operations – homebuilding and financial services. The homebuilding operation is the larger earnings contributor and I modeled the revenue based on Settlements X Selling price.
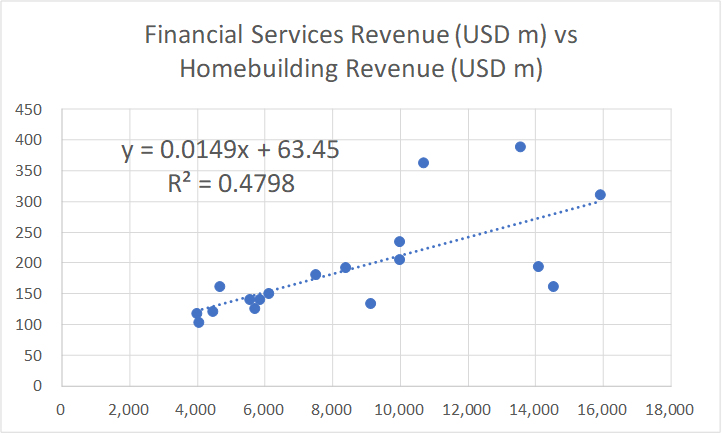
The financial services operations only contributed about 2% of the total revenue in 2022. I modeled the revenue for this operation based on a linear regression equation linking its revenue to that of the homebuilding one. This was derived using the EXCEL plotting function as illustrated in Chart 1.
Chart 1: Link between Finance Services Revenue and Homebuilding Revenue (Author)
Based on the above Scenarios and financial models, I found that there is no margin of safety based on Scenarios 1, 2, and 3. There is some margin of safety under Scenario 4, but I don’t think this reflects reality.
Cyclical sector
Pulte operates in a cyclical sector as acknowledged by the company.
“…The homebuilding industry is cyclical…” Pulte Form 10k, 2022
In my previous 2 articles of this series, I drew the following conclusions based on my analysis of the Housing Starts and House Price Index. Refer to them for the details.
- Over the past 70 years, there is no growth in the long-term annual average Housing Starts. I took this long-term average as 1.5 million units per year.
- In the past 2 years, Housing Starts seem to be at the long-term annual average level.
- Over the past 70 years, there have been 4 occasions when the annual Housing Starts had exceeded 2 million units.
- While there is no growth in the annual average Housing Starts, there was long-term price growth. The revenue growth for the home building sector resulted from both volume growth and price growth.
I used these conclusions to determine the various parameters and assumptions for my valuation of Pulte.
Valuation of cyclical companies
Damodaran opined that cyclical companies’ performance depends on where they are in the cycle. Extrapolating the performance based on the current earnings and cash flows can lead to misleading valuations.
To overcome the cyclical issue, we have to normalize the performance over the cycle. How can we do this yet reflect the current size of the business?
Damodaran suggested that we should take the current revenue and determine the earnings by multiplying it with the normalized margins.
Long-term annual average Housing Starts
I have assumed that there is no change to the long-term annual average Housing Starts. My basic argument is that 70 years of data cannot be wrong. But there are many Seeking Alpha readers who believe that there is some fundamental change to this long-term annual average Housing Starts.
The debate is about whether the current drop in Housing Starts is merely a temporary pullback from an uptrend, or the start of its downtrend leg.
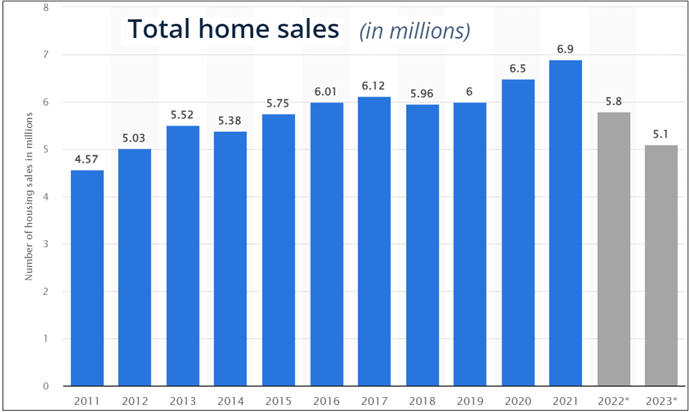
I am more inclined to believe that we are at the start of the downtrend. This is supported by the projected decline in the total home sales as per Chart 2.
Note that new homes are only a small portion of the total home sales and any projected decline in the total home sales will also affect the Housing Starts.
Chart 2: US Total Home Sales (Statista)
Note to Chart 2: 2022 and 2023 are forecasts.
Pulte did not opine that there is going to be a change in the long-term annual Housing Starts. But it did state that there is a housing shortage.
“We expect that the more challenging environment for new residential housing will continue through at least 2023… Despite these conditions, there remains a housing shortage across the United States…” Pulte Form 10k 2022.
I don’t have a crystal ball on how the future will turn out. As such I will present valuations based on both views and leave it to you to determine which is more likely.
To give you a better idea of the rationale for the opposing view, I quote the following from Toll Brothers’ 2022 Annual Report:
“…the chronic undersupply of new homes…Housing starts have not kept up with population and household growth in the U.S. for at least the last 15 years, and this lack of supply will continue to support the market for new homes.
Demographic trends are also in our favor, as the two largest demographic groups in America - Millennials and Baby Boomers - are both on the move. Millennials…have demonstrated that homeownership remains a strong foundation of the American dream…Baby Boomers, many with significant savings and substantial equity in their existing homes, are also a strong driver of new home demand…”
Performance
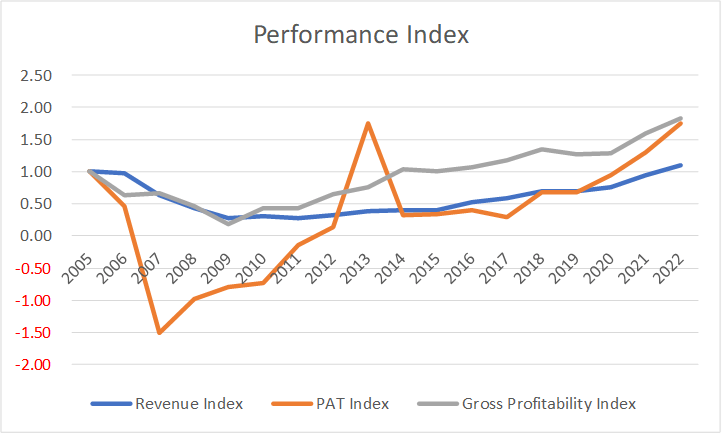
I look at 3 metrics to get an overview of the performance over the cycle – revenue, profit after tax (PAT), and gross profitability (gross profits/total assets).
Chart 3 shows the performance of Pulte over the 2005 to 2022 cycle. During this period there were:
- 0.84 correlation between Pulte revenue and the Housing Starts.
- 0.89 correlation between the US Housing Starts and Pulte’s Settlements (or deliveries)
Chart 3: Performance Index (Author)
Note to Chart 3: I converted the various metrics into indices to enable them to be plotted on the same chart. The index for a particular year is the value for the year divided by the respective 2005 value.
The conclusion is that Pulte is a cyclical company whose performance is tied to the US Housing Start. Note the following performances:
- There is hardly any revenue growth over the cycle. The revenue in 2022 is about the same as that for 2005.
- During the trough part of the cycle, Pulte incurred losses. In fact, from 2007 to 2009, the homebuilding operations had negative gross profit margins.
- Pulte managed to improve its gross profitability. According to Professor Novy-Marx, gross profitability has the same power as PBV in predicting cross-section returns. The augurs well for Pulte.
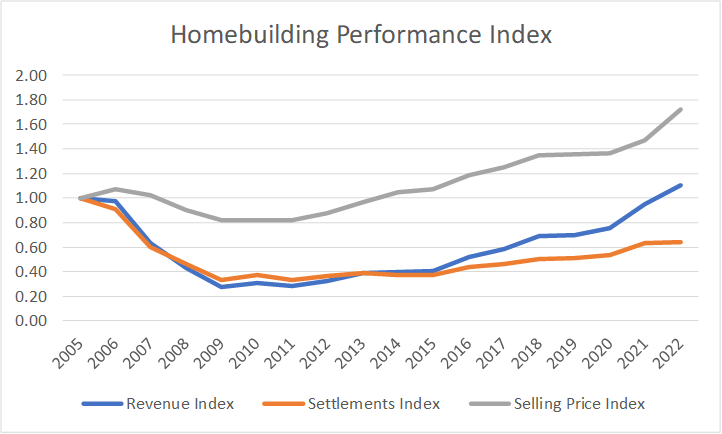
The revenue performance is an eye-opener. From 2005/06 to 2021/22, revenue grew at about 0.2 % CAGR. But this was due to a combination of declining volume and price growth as shown in Chart 4.
I estimated that during this period physical volume (as measured by settlements) contracted at 2.7 % compounded per year while unit selling price grew at 2.9 % CAGR. Are these signs of a growth company?
Chart 4: Revenue, Settlements, and Selling Price (Author)
You can see that over the past 2 years, the high revenue growth was due to both growths in selling prices rather than volume.
Note that Pulte undertook several acquisitions over the past few years - JW Homes in 2016, American West in 2019 and Innovative Construction Group in 2020.
I estimated that it spent about USD 700 million for the above. It makes you wonder what the revenue picture would be if it did not acquire them.
What does all this mean?
- Pulte is not a growth company in a no-growth (volume terms) cyclical sector. It may be more appropriate to value it based on its Earnings Power Value.
- We may have to account for the improvements in gross profitability. I covered this under Scenario 3.
Financial position
I would rate Pulte as financially strong based on the following:
- As of the end of Dec 2022, it has USD 1.1 billion in cash. This is about 7 % of its total assets.
- It has a Debt Equity ratio of 0.32 at the end of 2022. My base rate for the sector was a mean Debt Equity ratio of 0.41 for 2022.
- Over the past 18 years, it generated an average of USD 658 million per year in Cash Flow from Operations compared to the average PAT of USD 490 million per year. The mean Cash Flow from Operations over the same period for my base rate was USD 328 million.
- It managed to generate positive Cash Flow from Operations for 15 out of the 18 years. Excluding Pulte, there were 8 home builders in my base rate panel companies. Of these, only 1 did better than Pulte on this measure.
I would like cyclical companies to be financially sound going into the downtrend leg of a cycle as I do not know how severe the downtrend will be. Pulte fits the bill.
Valuation
I valued Pulte based on Earnings Power Value using the single-stage Free Cash Flow to the Firm (FCFF) model.
I focused on 4 Scenarios:
- Scenario 1. I assumed that 2021/22 represented the long-term annual average Housing Starts of 1.5 million units.
- Scenario 2. This assumed that the long-term annual average Housing Starts was increased to 2.0 million units.
- Scenario 3 - no change in the long-term annual Housing Starts of 1.5 million units. Given the improvements in gross profitability, I scaled the Gross Profit Margins. The scaling factor = 2022 Gross Profit Margin divided by the 2005 Gross Profit Margin.
- Scenario 4 – This is the non-cyclical scenario. I assumed that the 2021 and 2022 performances represented the long-term performance. As such I used the actual average 2021 and 2022 Gross Profit Margins.
Scenarios 1, 2, and 3 were based on a financial model where the Gross Profits for the Home building segment = Settlements X Selling Price X Cyclical Gross Profit Margins. The Cyclical Gross Profit Margins were assumed to be the average 2005 to 2022 Gross Profit Margins.
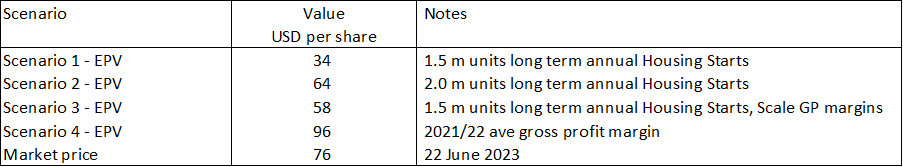
Table 1 summarized the results. You can see that there is no margin of safety under Scenarios 1, 2, and 3. While there is a margin of safety under Scenario 4, I do not think that this is realistic.
Table 1: Summary of Pulte valuation (Author)
Note that the value under Scenario 2 is over-estimated as it assumed that we are now at the 2.0 million units of Housing Starts. In reality, it would take a few more years to reach this level and the valuation would be reduced accordingly. I did not estimate the value under this case as there is already no margin of safety.
But I carried out such an analysis in the Toll Brothers' article and found that the value was reduced by about 20%. You can assume that if I had carried out a similar valuation for Pulte I would get about the same level of reduction.
Sensitivity analysis
For the valuation shown in Table 1, I took the average Gross Profit Margins for each year from 2005 to 2022.
But in my earlier Lennar article, I had computed the normalized Gross Profit Margin = (sum of 2005 to 2022 gross profits) divided by the (sum of the 2005 to 2022 revenue).
This was different from what I did for Pulte above.
If I had adopted the Lennar approach, the value of Pulte would be higher as shown in Table 2. As you can see there is still no margin of safety.
Changing how the average Gross Profit Margins are computed does not change the conclusion for Scenarios 1 and 3. I would argue that it would also not affect the conclusion under Scenario 2 if we consider the time to reach the 2.0 million units of Housing Starts.
Table 2: Valuation with a different basis for estimating the gross profit margins (Author)
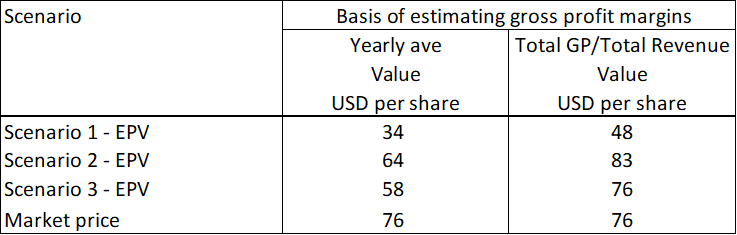
Note to Table 2: When I changed how the Gross Profit Margins were computed, I did it for both the homebuilding and financial servicers operations.
Valuation model
I valued Pulte based on its Earnings Power Value (EPV) using the single-stage Free Cash Flow to the Firm (FCFF) model.
Value of the operating assets of the firm = FCFF X (1 + g) / (WACC – g).
Where:
FCFF = EBIT X (1 – t) X (1 – Reinvestment rate).
In the case of the EPV, g and Reinvestment rate are both = 0.
t = tax rate based on the past 3 years’ average.
WACC = weighted average cost of capital derived from the first page of a Google search for the term “Pulte WACC” as summarized in Table 3.
Table 3: Estimating the WACC (Various)
EBIT = Gross profits – Selling, Admin, and Selling or SGA expenses – Other expenses and asset write-downs.
Gross Profits
The gross profits for Pulte were derived as shown in Table 4. You can see that I broke it down into 2 components - homebuilding and financial services.
Table 4: Deriving the gross profits (Author)
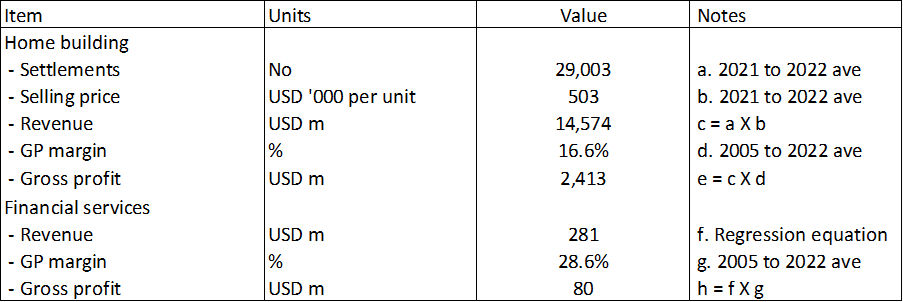
The gross profits for the homebuilding operations = Settlements X Selling Price X Gross Profit Margins. The assumptions for the various parameters for the 4 Scenarios are summarized in Table 5.
Table 5: Assumptions for the homebuilding gross profits (Author)
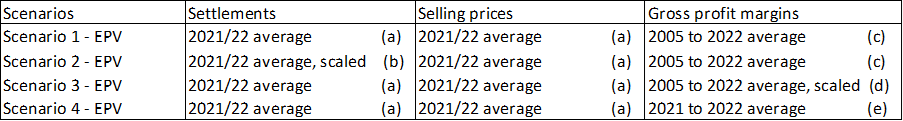
Notes to Table 5:
a) These 2 years represented the long term annual average Housing Starts of 1.5 million units.
b) 2021/22 average X (2/1.5) to scale it to 2.0 million units Housing Starts.
c) Based on the homebuilding segment margins.
d) Based on the homebuilding segment margins with Scaling factor = 2022 GP margin/2005 GP margins.
e) Assumed that it is non-cyclical.
The gross profits for the financial services operations = Revenue X Gross Profit Margins.
The revenue for the financial services we derived based on the linear regression equation using EXCEL as shown in Chart 1 where:
- Revenue for the homebuilding operations was the independent variable.
- Revenue for the financial services operations was the dependent variable.
The Gross Profit Margins for the financial services operations were based on 2005 to 2022 average margins.
Chart 1 (reproduced): Link between Finance Services Revenue and Homebuilding Revenue (Author)
Sample calculation
Table 6 shows a sample calculation for the intrinsic value.
Table 6: Sample calculation for the intrinsic value (Author)
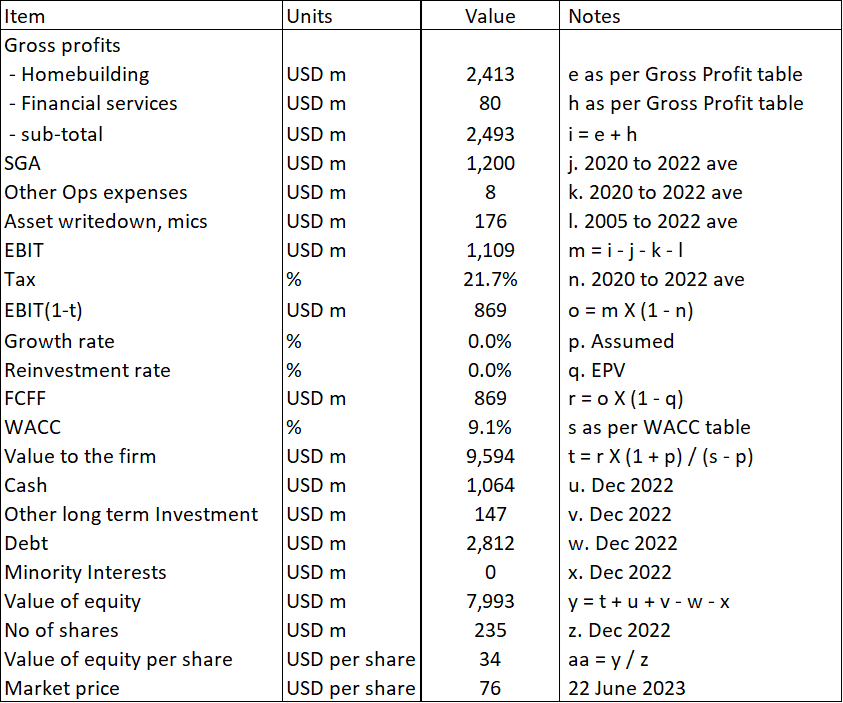
Note to Table 6: Over the past 18 years, Pulte incurred some asset write-downs and other one-off charges. I included the average in my valuation.
Risks and limitations
The crux of my valuation is that Pulte is a cyclical company. You should consider the following when looking at my valuation:
- Low WACC
- No growth
- Regression equation
Part of the reason for the 9.1 % WACC was because of the current high risk-free rate and equity risk premium. This is due to the uncertainty associated with the high inflation rates, possible recession, and the Ukraine invasion. If you are going to look at the value over the cycle, I would argue that you should also consider the values over the cycle. This meant that my valuation is conservative.
I used an EPV model in my valuation ie zero growth rate. This is because I had shown that there was negligible revenue growth over the cycle. But revenue growth is not the only growth component. Pulte had achieved good growth in gross profitability. You may thus argue that we should incorporate some growth in the valuation. In mitigation, I had provided Scenario 3 and even then, there is no margin of safety
Finally, in my analysis and valuation, I derived the financial services revenue using the linear regression equation. There is a 0.48 R-squared value for this equation. In other words, the equation only explained about half of the changes in the revenue. I would have preferred a higher R-squared. In mitigation, the financial services are very small as they contributed about 2 % of the total revenue in 2022.
Conclusion
While I would rate Pulte as financially sound, I would not consider it as a growth one.
Given this and that it is a cyclical company, any analysis, and valuation of Pulte should be based on its EPV over the cycle.
I assumed that the cycle is represented by the 2005 to 2022 performance. This is pegging it to the latest peak-to-peak Housing Starts cycle.
My EPV of Pulte over the cycle showed that there is no margin of safety. The crux of my valuation is that there is no growth in the long-term annual Housing Starts.
Even if you assumed that there is a 1/3 increase in the long-term annual Housing Starts, my analysis showed that there is not enough margin of safety since it would take time to reach this increased level.
There is only a margin of safety if you assumed that Pulte is a non-cyclical company and that the past 2 years’ performance represented its future. This is not a realistic view given the evidence presented.
For further details see:
PulteGroup: No Margin Of Safety Based On A Cyclical Perspective