PBYI - Puma Biotechnology: Recent Rally Above $5 Unsupported On Fundamentals
Summary
- PBYI recently bounced from its November lows, rallying from $2 to $5.16 in a matter of weeks.
- It reported revenue growth of 23.5% YoY to $57.1mm, also a sequential decline of ~$2.4mm from Q2 FY22.
- PBYI management also increased FY22 guidance from the top to bottom lines.
- Despite this, growth percentages are still flat on a long-term basis, and look to remain this way down the line as well.
- Technicals are supportive, but this isn't carried through to valuation, hence, we rate PBYI a hold.
Investment summary
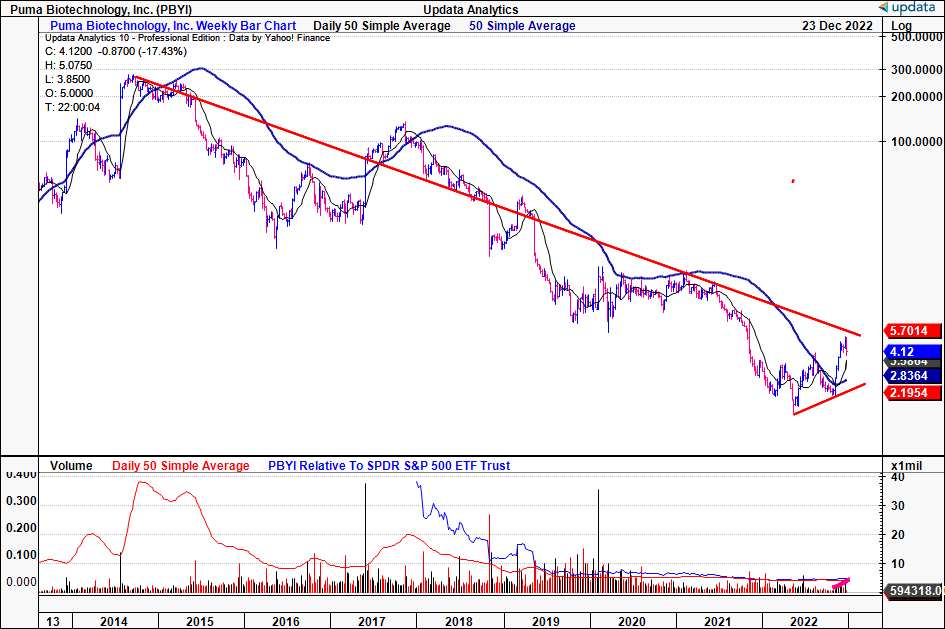
In the last two months of the year, plenty of med-tech and biotech stocks have caught a strong bid, seeing substantial re-rating on the charts. There's been plenty of underlying drivers, ranging from sector beta to underlying company fundamentals. We noted that Puma Biotechnology ( PBYI ) fit this mould and had bounced from its November lows, rallying from $2 to $5.16 in a matter of weeks. However, price acceleration has since stalled, and we wanted to observe the likelihood of another breakout to the upside for PBYI. I think it's also important to note that, since 2014, a bulk of the equity value in PBYI has been wiped out, with the stock continuing in a steep erosion of value to the current date.
PBYI price history since 2014 - not an ideal picture for healthcare longs
Here, I'll cover our examination findings for the company, and analyze its forward-looking growth potential. Net-net, we rate PBYI a hold and believe the market may have overshot its reward for the company after its Q3 FY22 financial results. Rate hold, suggested price target range of $3.05-$5.
Exhibit 1. Investors have bid up the PBYI share price since November, whilst it has reduced equity market beta
Data: Updata
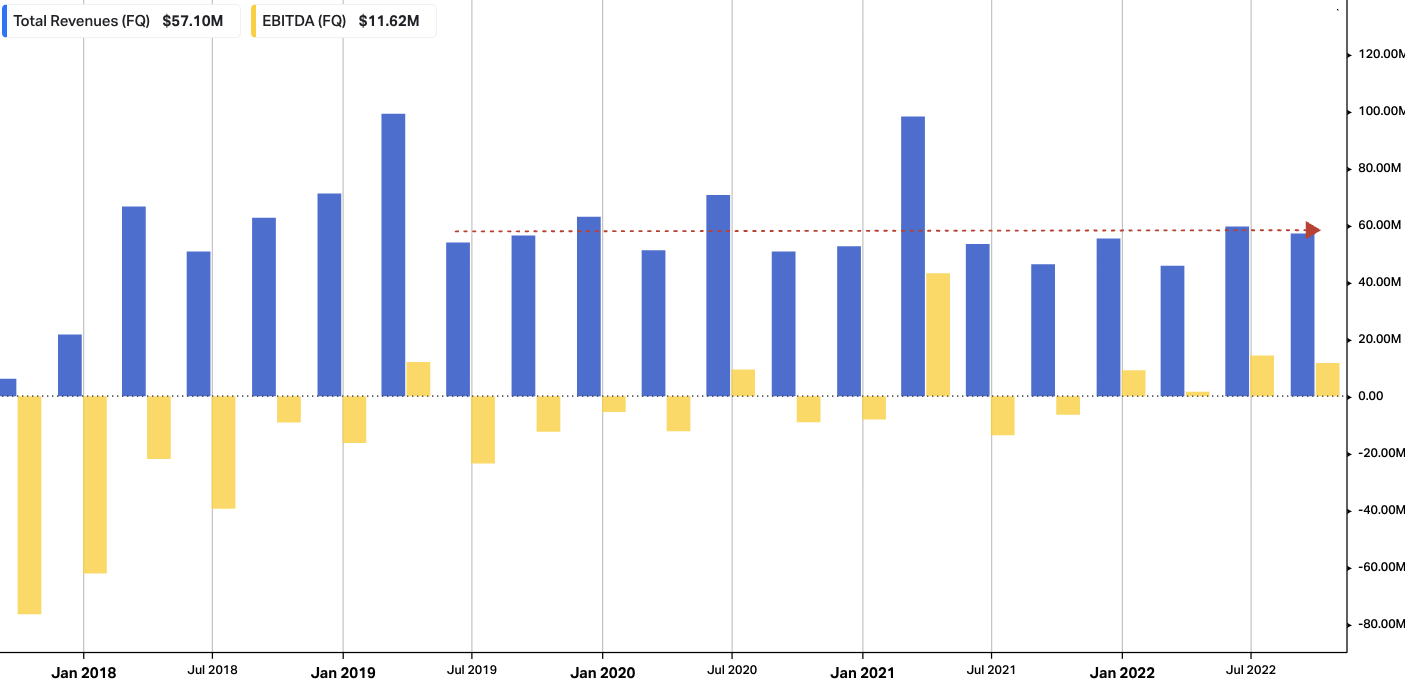
Q3 results in tandem with long-term growth averages
Whilst it was a reasonable period of growth for PBYI last quarter, we believe it still falls short of justifying further upside down the line. We saw it reported revenue growth of 23.5% YoY to $57.1mm, also a sequential decline of ~$2.4mm from Q2 FY22. This breakdown of this figure includes product revenue net, comprised entirely of NERLYNX sales, as well as license fees and royalties from sub-licensees.
Speaking of product revenue, we saw PBYI clipped $54.3mm at the top line, representing an increase from the $51.3mm reported in the previous quarter and the $43.4mm recorded in Q3 2021. In Q3 2022, the company incurred cash burn of ~$17.5mm, above the quarterly burn of $14mm in Q2 2022. We'd advise this figure does not include the $7mm upfront licensing fee made to Takeda for the development of alisertib, which was made in October.
It's also worth highlighting that PBYI's royalty revenue for Q3 2022 was $2.8mm, in-line on a YoY basis, but a sequential decline from $8.2mm in Q2 FY22. Moreover, there was no license revenue booked during the quarter. It did however clip sales of 3,197 bottles of NERLYNX in Q3, compared to the 3,200 bottles sold in Q2 2022. On the earnings call , management said that Q3 inventory build pulled in to ~31 bottles.
New prescriptions ("NRx") increased ~17% on a sequential basis, whereas total prescriptions ("TRX") rose ~5%. Enrollments grew 7% quarter-over-quarter and 12% YoY. We'd note this marks the first time since the NERLYNX launch that the company has recorded positive growth in the trio of enrollments, NRx, and TRx on a quarter-over-quarter and YoY basis.
Despite the growth percentages exhibited in its Q3 numbers, we'd note the company's revenue ramp is still flat and hasn't demonstrated an accelerated uptake of NERLYNX in the market. It is still printing average revenues in line with FY19/20' ranges, more so with flat sequential growth. Moving down the P&L, the picture is basically the same. It printed Q3 EPS of negative $0.01, well below the $0.21 in Q2 FY22. In our opinion, the flat sequential growth pattern at the bottom line, that's been in situ since 2020 at least, doesn't imply the PBYI share price will catch another strong bid.
Exhibit 2. PBYI long-term revenue, core EBITDA look-back (quarterly). Sequential revenue growth has been flat from FY19 at least
Data: HBI, Refinitiv Eikon, Koyfin
With its performance during the quarter, PBYI management increased FY22 guidance from the top to bottom lines. It now expects that turnover from NERLYNX sales will fall between $194mm-$196mm. We should note this forecast also includes an expectation for gross to net adjustments to be between 18% and 19% (20-21% previously).
With respect to royalty income, the company projects royalties from its international partners in the range of $25mm-$27mm, with no anticipated license revenue for the year. It also narrowed its previous guidance for net income to a range of $7mm-$9mm from $6mm-$10mm.
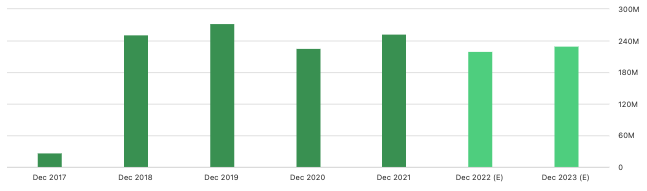
Whilst the revisions are well received, they are still not enough to justify further upside in PBYI's stock price. You'll see below that consensus revenue estimates for PBYI indicate flat annual revenue growth into FY23. Moreover, the company forecasts FY22 EPS of $0.19 at the upper end of range, behind trailing 12-month EPS of $0.23. The lack of forward-looking revenue, EPS upside confirms our neutral thesis.
Exhibit 3. Consensus revenue estimates paint a meagre outlook for PBYI's top-line growth into FY23
Data: Seeking Alpha PBYI, see: "Earnings Estimates".
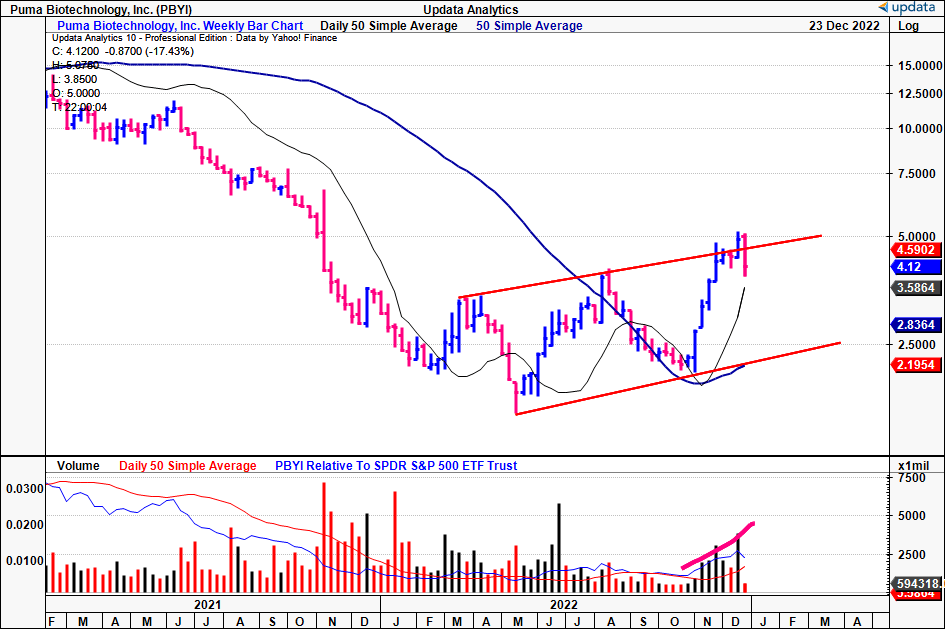
PBYI technicals balance the risk/reward calculus
With the stock's latest rally, we decided to observe what technical studies are demonstrating to help gauge price visibility. You can see below that PBYI bounced from its prior low on the back of its Q3 FY22 earnings announcement. It poked its head above the previous resistance line but reversed course sharply afterwards back to the range.
It currently trades above the 50DMA and 250DMA, having held a sideways channel for the last 4 weeks. At the same time, you can see the weekly volume trend has been ascending along with the price distribution to the upside. Prior to this, the volume trend was evaporating.
To us, this suggests that buyers were heavily active in the latest rally and that large or institutional accounts were possibly accumulating at volume. To this point, PBYI is ~45% owned by institutions, with another 15.2% owned by hedge funds. The stock now needs to break above the current resistance level shown to continue the recent upside.
Exhibit 4. PBYI price action showing promise, having cracked the previous level of resistance
Question then turns to how likely the trend is to continue at its current pace. To gauge this, we looked at how the stock is trading with an overlay of ichimoku indicators (cloud chart) combined with on-balance volume ("OBV") and momentum (Exhibit 5).
We see that the stock is trading well above cloud support, with the lag line in the same position. Despite a heavy selloff to close out the previous week, the cloud is bullish and widening at the mouth. OBV also reversed out of a longer-term downtrend and aligns with the volume trends noted in Exhibit 4, pointing to the fact that shares have been accumulated at pace over the past month or so. Despite this, price acceleration has slowed, with the rate of change or momentum slowing back to baseline (seen in the bottom frame in Exhibit 5).
To us, this setup suggests that the trend is still bullish, however, has lost some steam in the growth engine. We'd need to see shares breaking beneath the cloud (lag line included) with OBV flatlining or decreasing in order to suggest a turn to a bearish trend.
Exhibit 5. Shares are trading well above cloud support, with OBV supportive of further upside. Rate of change slowing, however, and could stall price acceleration without additional catalysts
Data: Updata
Valuation
To assign price objectives for PBYI we went about checking market positioning, technical price targets, and its bottom-line fundamentals.
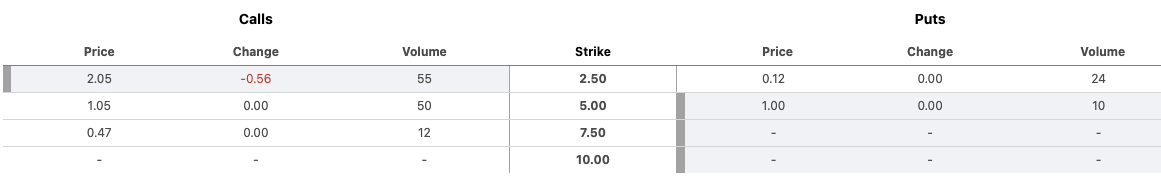
First, you'll see in the PBYI options chai n for contracts maturing in March 2023 that the bulk of the distribution is centred around calls at the $2.50-$5 strike points. Whilst there's some interest at $7.50, looking at the price ladder for puts, there's similar volume at the lower levels.
This tells us one of two things. Investors are hoping for a rise above $5, and will seek to profit from entering at a lower price differential by exercising the $2.50 of $5 calls. Or, if taking the put distribution, are projecting a decrease below these marks and are hedging the downside risk. Nevertheless, market positioning seems confident around a $5 price objective.
Exhibit 6. PBYI options chain for March 2023 expiry (note, all contracts shown are currently in the money)
Data: Seeking Alpha, PBYI, see: "Options"
Next, we looked at the technically derived price targets using point and figure studies. You can see there's upside targets to $5.45, in alignment with the market positioning described above. This gives more confidence on the c.$5 price level.
Exhibit 7. Upside targets to $5.45
Data: Updata
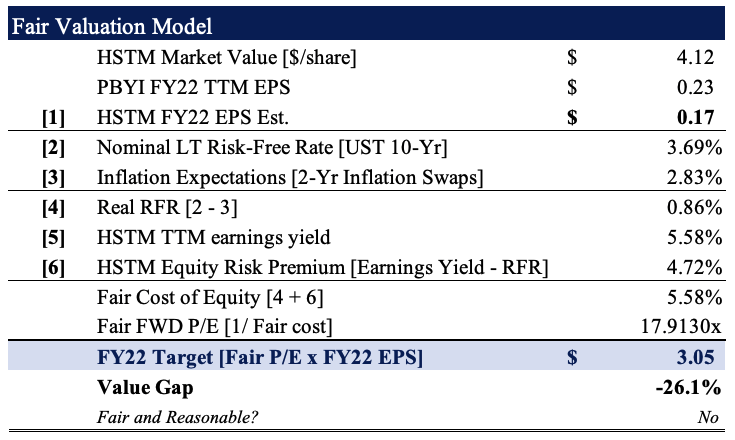
Finally, you'll see that, using consensus FY22 EPS estimates of $0.17, we estimate that PBYI should trade at 17.9x forward P/E. Assigning this multiple to the consensus EPS number derives a price target of $3.05, otherwise 26% downside potential. Hence, the valuation composite we completed here confirms our neutral thesis on PBYI.
Exhibit 8. Fair forward P/E 17.9x $0.17 = $3.05
Note: Fair forward price-earnings multiple calculated as 1/fair cost of equity. This is known as the 'steady state' P/E. For more and literature see: (M. Mauboussin, D. Callahan, (2014): What Does a Price-Earnings Multiple Mean?; An Analytical Bridge between P/Es and Solid Economics, Credit Suisse Global Financial Strategies, January 29 2014). (Data: HBI Estimates)
In short
Despite a strong finish to the Q3 FY22, and corresponding price action, we believe the market has overshot the latest PBYI rally. There is some support for the trend to remain in situ from technical studies, but digging deeper into the fundamental drivers of PBYI's medium-term growth potential, we believe that further upside is unwarranted at this stage. Net-net, we rate PBYI a hold with a suggested price range of $3.05-$5.
For further details see:
Puma Biotechnology: Recent Rally Above $5 Unsupported On Fundamentals