QYLD - Pushing The Limits Of Fixed Income In Retirement
2024-01-01 23:53:46 ET
Summary
- Year 8 sees more changes for dividend income, while Total Return Continues to Outperform.
- In 2016, I deployed a new DGI portfolio alongside an ETF portfolio for retirement income going forward.
- In 2023 the DGI10 income was improved by another 26%.
- The DGI10 has now become a portfolio of 5 stocks and 3 ETFs with a much higher income.
Year eight of this venture saw the market rise by more than 25% as indicated by the S&P 500 ( VOO ), in the face of interest rates which are still higher than the Federal Reserve target. The income of both portfolios was set in January of 2023. How last year’s income was determined was described in my article from 2023 . The calculation for this year’s income will be shown below and is based on the December 31st ending totals of 2023.
My wish is to point out that both approaches, income and total return, can work when combined with a structured variable withdrawal program.
Background
In a previous article, which you can find here , I laid out the starting positions of my two portfolios. One is a dividend income portfolio I call the DGI10 (started with 10 dividend stocks) and the other is a total return portfolio which I call the TR7 (7 ETF’s where shares are sold to fund the income). Both of these started at the end of 2015 with about $100,000 each. The income drawn from both is based on the 2019 IRS Required Minimum Distribution table III, from IRS publication 590b, appendix B, starting at age 73 in the table. This approach has the potential to provide more retirement income from the fact that the income drawn each year is based on the portfolio’s last year ending value divided by the current year IRS table distribution factor. Its purpose is also to slowly draw more and more from your IRA each year as you get older so as to maximize your spendable income and keep up with inflation. An added bonus of this method is after years where your account totals were down such as in 2018, 2020, & 2022, the next year withdrawals were trimmed based on the RMD formula, allowing the account to rebuild. Some other background information can be found here that relates why these methods might be useful to you and how taxes may affect you during this journey.
So far prior to this year I had made 10 stock sales, over the first 7 years. In 2023 I decided to sell out of SO in May and WPC in August. Weeding out two more stocks and reinvesting the proceeds into the remaining 5 stocks and three ETFs ( QYLD ) ( PTY ) and a small position in OXLC, which was opened this year. These transactions used up some of the positive cash balance which has now been trimmed to $2 and added shares to QYLD, O, PTY, CIM and the new position OXLC.
Pushing the limits of Fixed Income
In the last couple of years, I have been trying to push the limits of high yield investing by relying less on stock dividends and more on other high yield products for which I have settled on three:
PIMCO ETF Fund ( PTY )
Global X NASDAQ Covered Call ETF ( QYLD )
Oxford Lane Capital ( OXLC )
My plan in 2024 will be to continue to increase cash flow by using the excess cash from the above to pick up more shares when the price is such to create a yield on cost of 10% or better.
If positions OHI, CIM, & MAC don’t improve in 2024, I may look to trim one or more of these as well. None of those three has increased their dividend in at least two years.
As I have mentioned on other occasions if your goal is to not sell shares then you want your investment to pay out most of its gains in the form of dividends or capital gains with at least a fairly stable price that doesn’t decline. That would mean that the total return of the investment is at least as big as the dividend. The DGI10 has done a very good job, with some help from me to achieve an efficiency of maximum cash flow with a minimum of capital erosion.
2023 - Recap – DGI10
Below is a table showing where these investments have gone after 8 years.
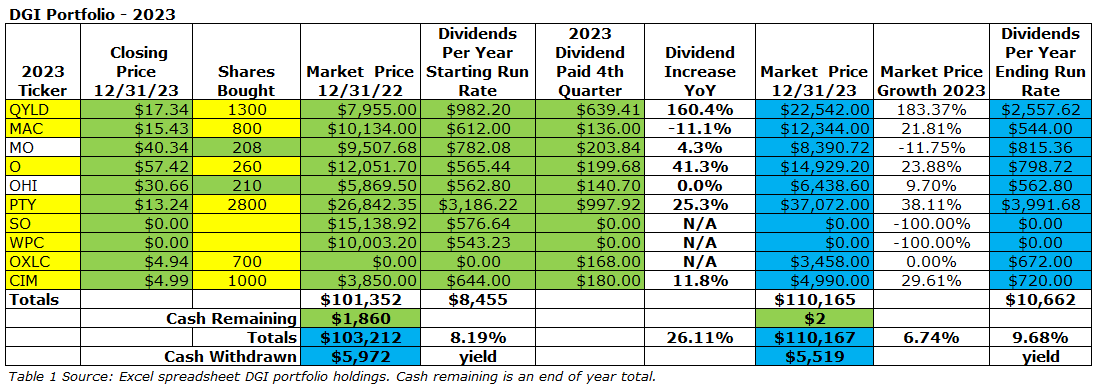
What can be seen from the above table is an initial starting dividend run rate at the end of 2022 of $8455, which increased by the end of 2023 to $10,662 for an increase of 26%. Most of that increase came from added shares of the NASDAQ COVERED CALL ETF ( QYLD ).
Also of important note is that the DGI10 now is going to be delivering a lot more income than is required by the RMD formula so I will continue to manually reinvest the cash as I did last year, which becomes important to not selling any shares for as long as possible as the income continues to be driven by last year’s balance and the IRS RMD tables. This year’s income will be driven by the age 81 divisor in the table. As many may know who follow me, I have a number of years to go to age 81, but that is what makes this method adaptable to anyone, as long as you take whatever minimum distributions are required from the sum total of your necessary tax-deferred accounts. It could in fact even be used on a taxable account or Roth account to manage the cash flow in an efficient manner.
2022 - Recap – TR7
Below is a table showing where these investments have gone after 8 years.
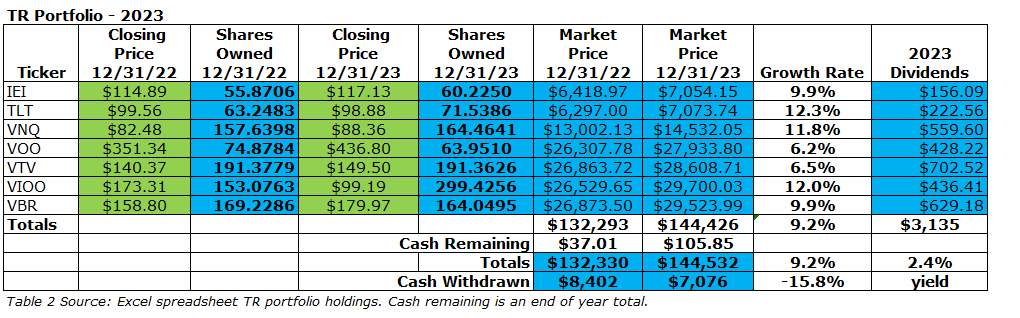
2023 was a good year for the TR7 portfolio. By withdrawing cash on a quarterly basis and rebalancing, this portfolio regained a good portion of the losses from 2022 and is still up over 44% from its starting value. As can be seen from the above tables, the DGI10 portfolio balance increased 7% while the TR7 increased by 9%. Though not as important for the TR7 portfolio it also had internal dividends of $3135 that were reinvested during the year.
Tracking the Total Results
To make it easier to follow along on a year-by-year basis here are the combined results of these two portfolios.
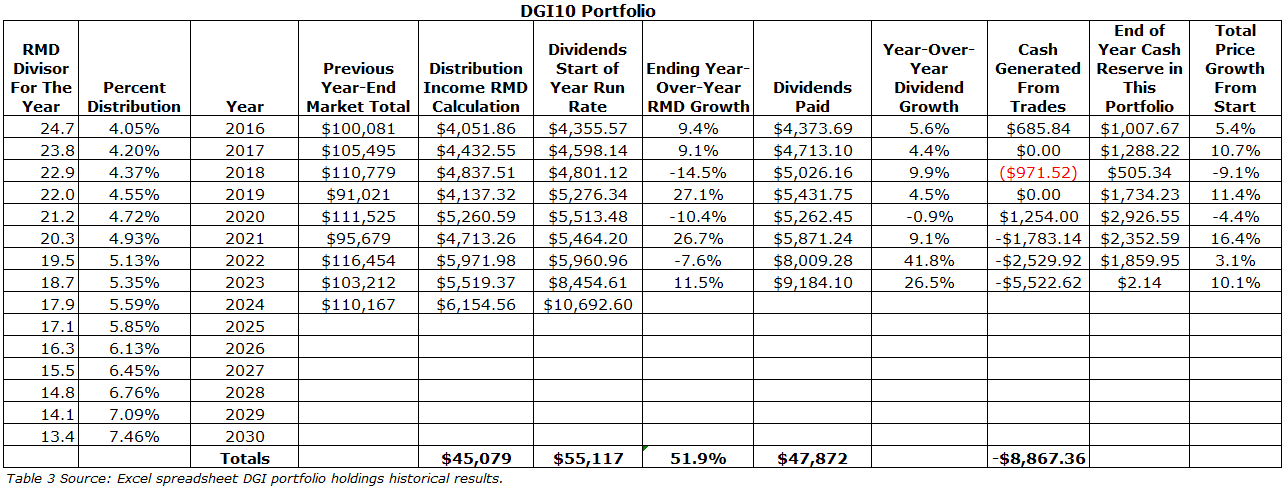
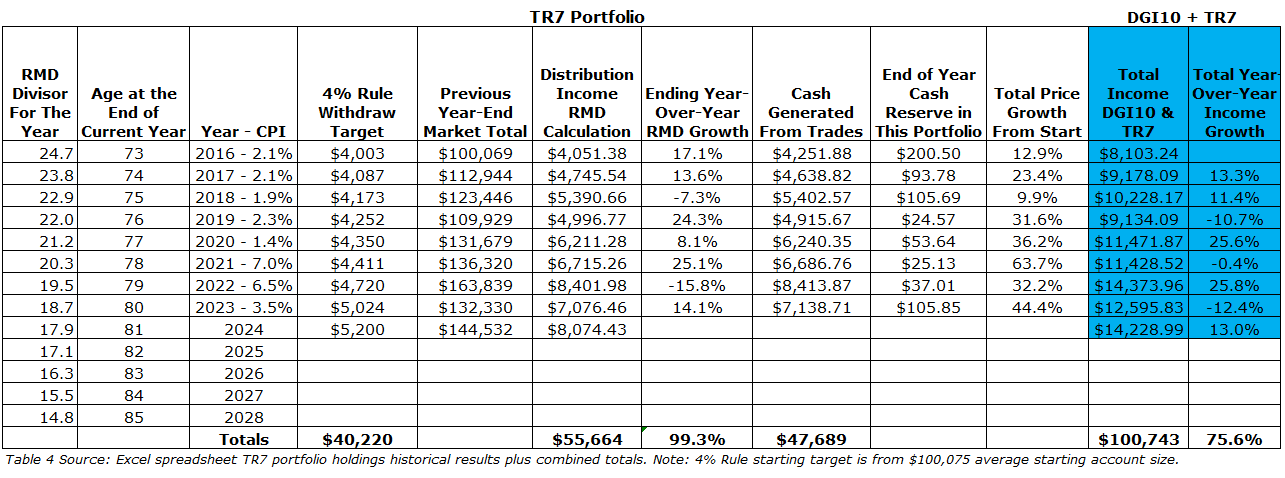
In the above table 4, column four shows what would have been your income totals had you decided to use the 4% rule [ explained here ]. In simple terms the 4% rule starts in year 1 by withdrawing 4% of the previous year’s balance and from then on increases the withdraw amount by the consumer price index. In my example above I use the more common CPI-U data obtained from the Bureau of Labor Statistics.
One obvious conclusion from the above is that both the DGI10 and the TR7 have provided me with more spendable income over using just the 4% rule. In fact, over the 8 years ending in 2023 the DGI10 has provided an extra $3905, while the TR7 provided an extra $12,570 for a total extra income of $16,475 from the combination. In 2024 this excess will continue to climb based on the new RMD income levels described below.
The Year Going Forward
I will continue to monitor my holdings for income and price stability. One of the sell triggers looks for stocks underperforming the S&P 500 by more than 10% for both the 3 year and 5-year time frames. As of this writing in 2024, I am still giving a little leeway to CIM, which is the only single stock failing both the 3 year and 5-year test. If you don’t understand how important total return is to your income generation long term, then read this article titled “ Is There Magic in Dividends .”
Summary
Unlike some income portfolios which rely totally on the corporate board actions of companies to continue their dividends, these two RMD rule-based portfolios have their income defined for the full year from the previous year-end totals and that will not change during the year. For these portfolios the total income I will receive in 2024 is $6,154.56 for the DGI10, plus $8,074.43 for the TR7, which will be $14,373.96 or $3,148.96 withdrawn per quarter. This is up 13% from last year, and up 76% from the start in 2016.
Conclusion
What this journey offers is a real-life comparison of a concentrated dividend growth portfolio earning greater than 4% income to an ETF portfolio with a similar value slant to it and its dividends reinvested. As time goes forward my hope is that you can compare and contrast these two portfolios and take away what is appropriate for your own situation.
Once again as I pointed out in the article, I certainly would not want to imply that someone who wants to do DGI for retirement do it with 10 stocks invested in 100% of their retirement savings. As I have mentioned many times, I have other buckets that I can draw from, and these two accounts are not my only source of income. With the addition of three ETFs in the last couple of years and dropping 5 of the stocks I now feel that my income is becoming more diversified in what is now the DGI08.
This study is only as good as the data presented from the sources mentioned in the article, my own calculations, and my ability to apply them. While I have checked results multiple times, I make no further claims and apologize to all if I have mis-represented any of the facts or made any calculation errors.
You also must realize that past performance is no guarantee of the future, and in that regard all the information presented here is past performance up to this point. The information provided here is for educational purposes only. It is not intended to replace your own due diligence or professional financial advice.
For further details see:
Pushing The Limits Of Fixed Income In Retirement