QQQ - QQQ: Underlying Breadth Stinks Screaming Sell
2023-05-22 09:00:00 ET
Summary
- The unweighted Nasdaq 100 chart has collapsed during February-May, signaling the bear market will resume any day now.
- The Nasdaq advance/decline line and new high-low setups are horrifically weak, historically indicative of an immediate selloff.
- A developing recession and the unknowns of our current U.S. debt ceiling fight argue for investor caution and the selling of positions in QQQ for prudent traders.
Just like nobody wants to be a friend, coworker, or family member with truly bad breath, investing in stocks during periods of bad "breadth" have historically led to poor outcomes and hurt feelings.
So, here is my logic for running away from the Nasdaq 100 ( NDX ) generally, and the Invesco Nasdaq 100 ETF ( QQQ ) specifically - the turn in breadth participation by the vast majority of individual names inside the index since February is a very bearish development for summer trading. Outside of substantial price gains by just 6 stocks, which are the most heavily owned in the capitalization-weighted design of QQQ, the other 94 entities have actually declined in value since early February!
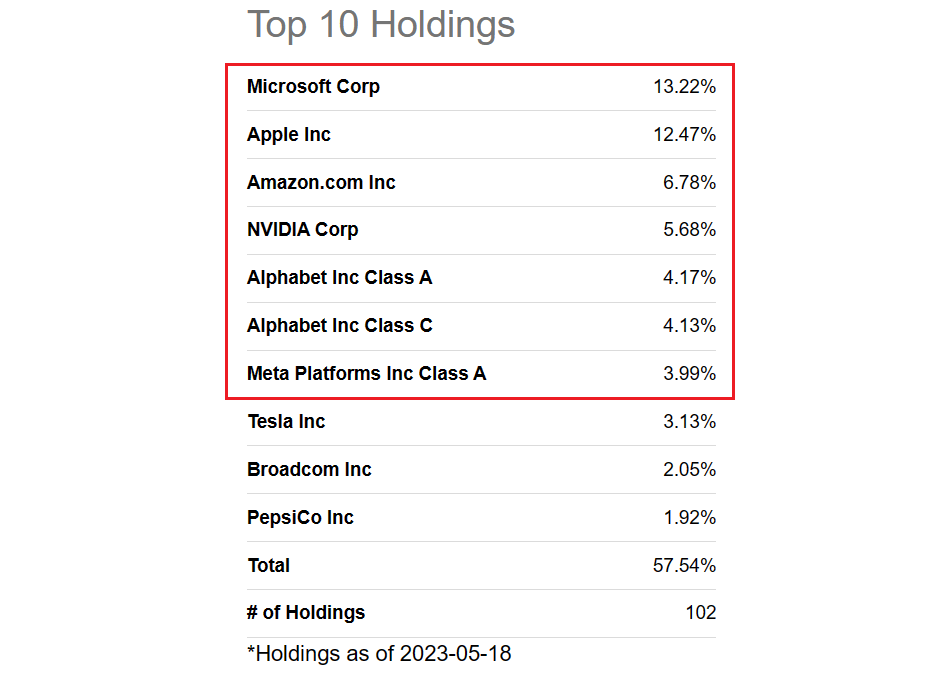
Concentration of 2023 Winners
You heard me correctly. Microsoft ( MSFT ), Apple ( AAPL ), Amazon ( AMZN ) NVIDIA ( NVDA ), Alphabet-Google ( GOOG ) ( GOOGL ), and Meta Platforms ( META ) have carried the day for investors. Believe it or not, these 6 stocks now account for 50% (fully half) of the value of this popular Big-Tech Nasdaq ETF today.
Seeking Alpha Table - QQQ, Top 10 Holdings, May 18th, 2023
The super-select group of winners has masked the declining price trend in the vast majority of individual names in both the Nasdaq 100 and S&P 500 since early February (with the S&P 500 running a similar overweight design based on company size).
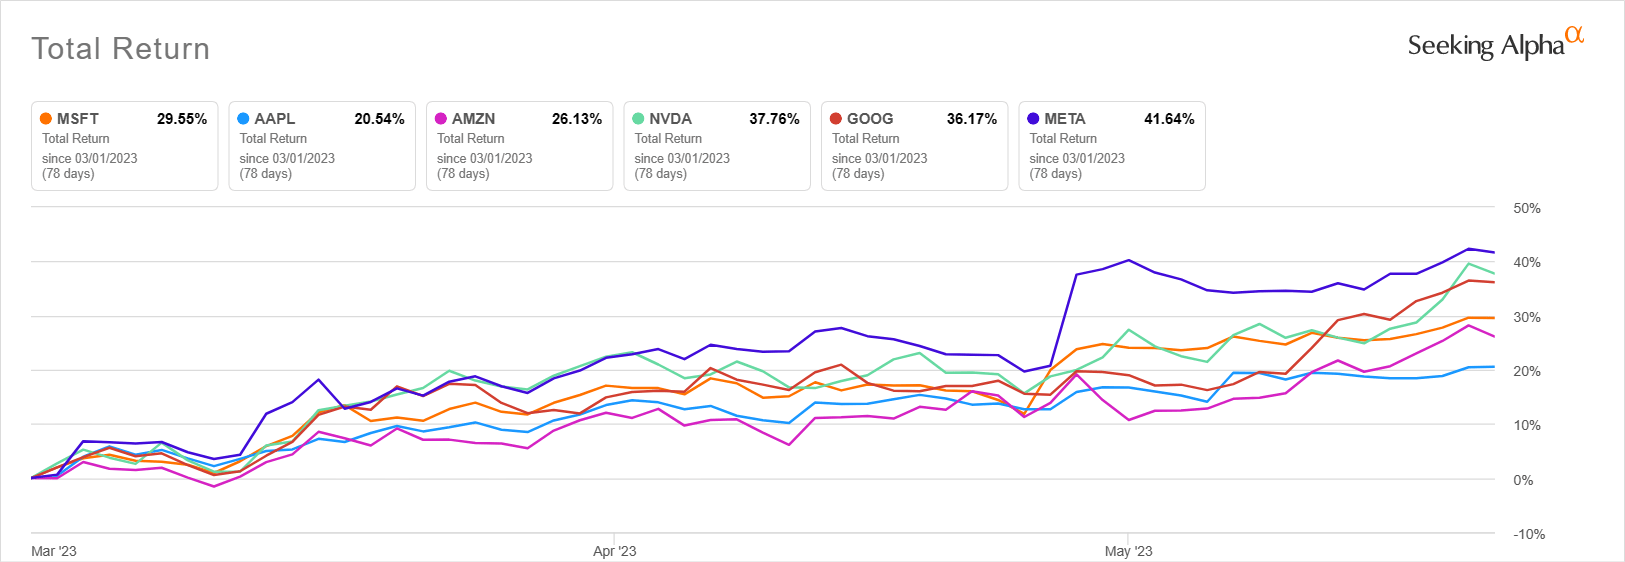
Amazingly, with only a slight gain in the Wilshire 5000's total capitalization for the entire U.S. market since March 1st, these 6 have delivered incredible total returns of +20% to +42% over seven weeks flat.
Seeking Alpha, Top 6 Weightings in QQQ, Total Returns, Since March 1st, 2023
Unfortunately, this type of concentrated trading action helps to pinpoint important tops in the stock market more often than not, time and again, over my 36 years of trading experience. The only question to ask is: will 2023 prove different or the same as past bad breadth scenarios?
Equally Weighted vs. Cap-Weighted History
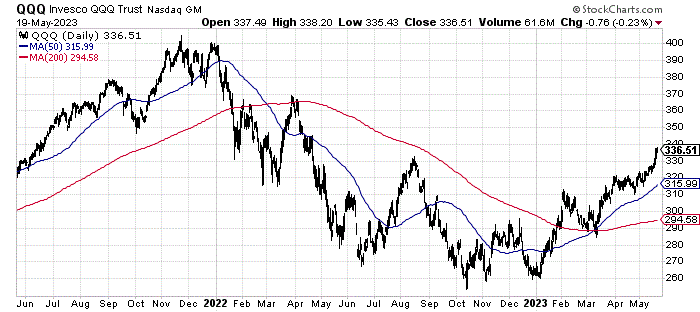
So, let's take a look at performance of QQQ vs. the unweighted performance of all 100 names, if you invested the same amount of capital into each. Below I have drawn a 2-year chart of daily price action for QQQ. You can clearly see our bubble-esq top formed in late 2021, followed by a -35% decline into October 2022. Then, the market overall had an excellent rebound during January 2023, where the vast majority of individual stocks participated. The up-move basically ended for the whole U.S. equity market shortly thereafter, outside of the leading mega-cap technology group. And, the last 10% of QQQ advance since early February has been fueled by essentially our handful of Big Tech names.
StockCharts.com - QQQ, Price Change Adjusted for Dividends, 24 Months
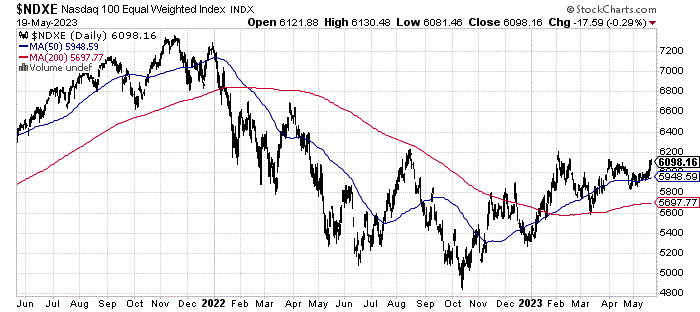
When we review the Nasdaq 100 with an equal weighting, the picture since August 2022 is a little different. In fact, an equal investment in all Big Tech names is still lower in value than early February.
StockCharts.com - Nasdaq 100 Equal Weight Index, 24 Months
Combining the two charts, we get a relative performance graph. The wicked, -10% underperformance stretch since March by all names vs. the QQQ cap-weighted design is materially rare (and magnitude of misdirection somewhat unprecedented). So rare, I don't believe any dramatic rise in the U.S. equity market has happened with a 3-month or less period of amazingly weak breadth preceding the move, during my decades of trading. With near certainty (nothing is 100% guaranteed in the stock market, mind you), a major bear market has ensued directly after each weak breadth implosion. I have circled in green Thursday's new QQQ price high not being confirmed by strong breadth participation, alongside the similar late 2021 experience.
StockCharts.com - Equal-Weight Nasdaq 100 vs. QQQ, Author Reference Points, 24 Months
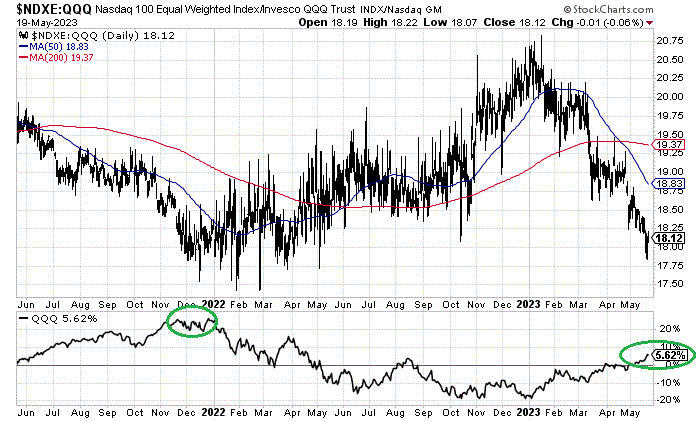
Similar Collapses in Breadth Participation
Historically speaking, we can draw some past unweighted, weak breadth situations for some analysis. The conclusion is rather eye-opening. The kind of divergence in unweighted movements vs. the capitalization-weighted QQQ design is typically what you see at important tops, right before a sharp decline in market price direction.
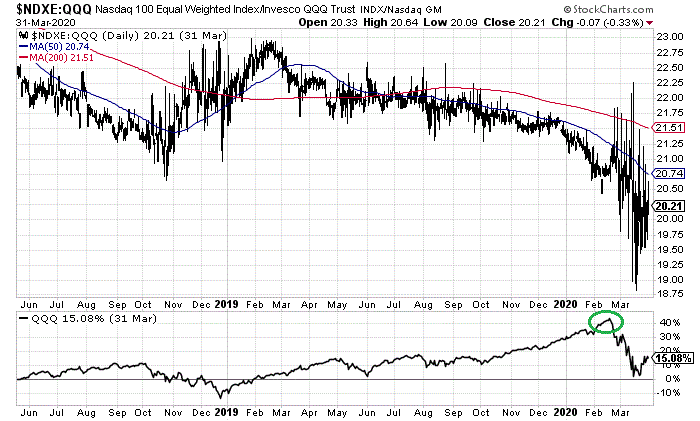
2020 Pandemic
The 2020 COVID pandemic setup was the last time weak breadth appeared at a 6-month price high in QQQ (before the late 2021 occurrence). I have again circled in green how QQQ was able to continue rising for a number of weeks, in the face of most stocks turning lower in price. The Nasdaq 100 index declined better than -30% over the next six weeks. [Note: Similarly weak breadth occurred in the autumn of 2018 pictured, but to a lesser degree. The Nasdaq 100 index fell -20% thereafter.]
StockCharts.com - Equal-Weight Nasdaq 100 vs. QQQ, Author Reference Points, May 2018 - March 2020
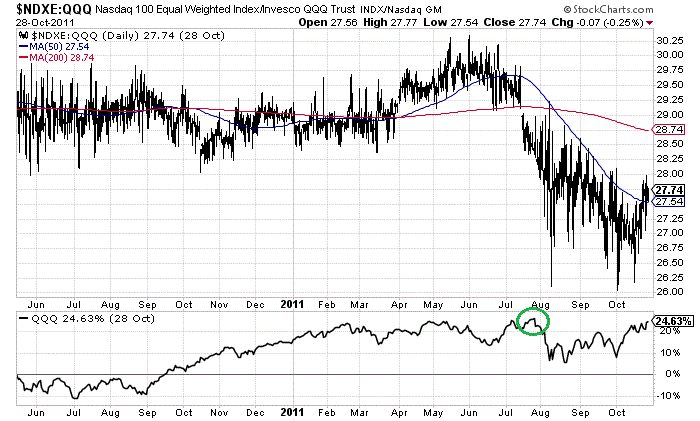
2011 Debt Ceiling Fight
The 2011 first-ever Treasury debt downgrade by Standard & Poor's came at the tail end of another partisan fight about federal government spending levels. But before stuff hit the fan, Wall Street breadth turned completely rotten as QQQ made a new high in July. Over the next seven weeks, the Nasdaq 100 index fell -20%.
StockCharts.com - Equal-Weight Nasdaq 100 vs. QQQ, Author Reference Points, May 2010 - October 2011
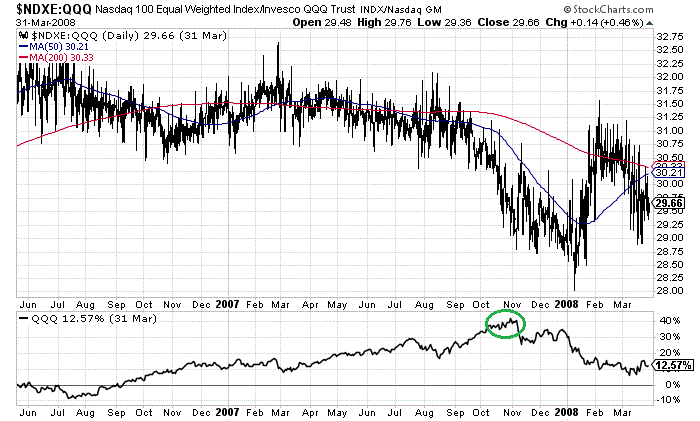
2007 Great Recession Peak
Again, going back to the Great Recession 's beginnings, weak breadth participation signaled a peak in QQQ during October-November 2007. The Nasdaq 100 index fell almost -15% over the following four weeks, and -30% in total over five months. By late 2008, the banking industry was in crisis, home prices had plunged, and QQQ was -40% lower in price vs. the bad breadth top.
StockCharts.com - Equal-Weight Nasdaq 100 vs. QQQ, Author Reference Points, May 2006 - Mar 2008
Other Indications of Weak Breadth
The selective advance of February-May 2023, with the market carried by just 6 stocks, is just one data point of weakening breadth (highlighting large selling interest underneath the simple press headlines).
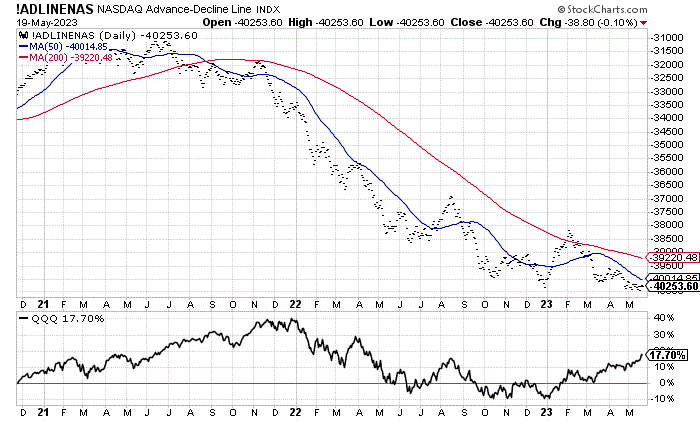
First, the overall Nasdaq marketplace of thousands of companies has been stuck in a momentum downtrend since the summer of 2021. As measured by the daily advance/decline line (subtracting the number of daily decliners from advancers, using individual issues at the close), you can see the bearish trend remains. And, believe it or not, the net A/D Line reached new LOWS last week, at the same time as QQQ was pushing for new price highs. This is incredibly uncommon. The only way to read this breadth signal is Wall Street generally could be in serious trouble in terms of price this summer.
StockCharts.com - Nasdaq Exchange, Net Advance/Decline Line Daily, 30 Months
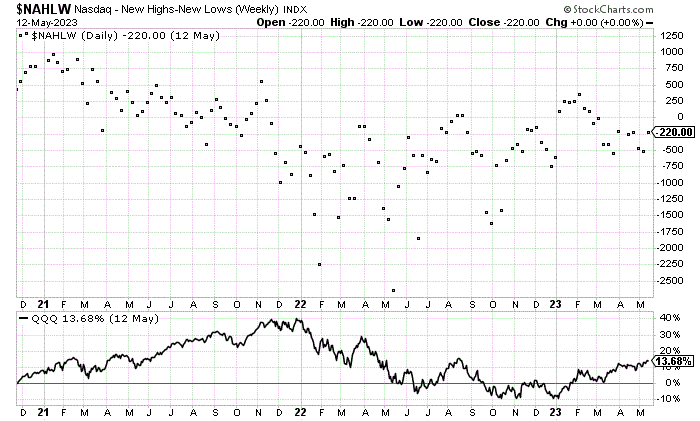
Second, we can review the difference between new 52-week highs and lows for price action. The below graph takes every week of trading into account. We subtract new lows from new highs to get a net number. Basically, new lows have won each week since November 2021, except for January-February 2023. March-May trends have returned to a bearish experience. In comparison, during late 2020 and most of 2021, new highs outnumbered new lows weekly by a wide margin. That's a bull market by definition, not what we have today.
StockCharts.com - Nasdaq Exchange, New Highs vs. Lows Weekly, 30 Months
Final Thoughts
The weak breadth signals in the marketplace during May are truly bearish developments. You don't get the massive relative weakness in participation stats like we have seen since February in a bull market or near a lasting bottom in pricing. I have written on the rotten performance in small caps and banks/financials in the U.S. since March as forecasting an eventual -10% to -20% selloff in the market averages like the Nasdaq 100 and S&P 500. Today's breadth action in QQQ could easily be predicting a greater than -20% decline is approaching during the summer-autumn months.
Honestly, the unweighted performance in QQQ is among the worst I can remember for any rising price trend market. Not to completely scare readers, but months of horrible breadth participation not only precede typical bear market declines over many months, but the 1987 stock market crash over several weeks held many similarities to the current setup, with a clear concentration of winners from a minor group of blue chips during the middle of that year.
I personally doubt an all-out -40% or -50% crash is next with plenty of traders and investors prepared for such, but a sharp -20% or -25% drop over 6-8 weeks cannot be ruled out. The appearance of recession (as forecasted by the steepest spread inversion for the Treasury bond yield curve since 1982) and spiking unemployment (which happens "after" a recession begins), alongside the unresolved political debt ceiling fight in Washington could be triggers for heightened investor fear and mass equity market liquidations.
I am personally holding excessive levels of cash and gold/silver hedges, waiting for a recession to play out and Wall Street to re-rate equity values closer to the reality of significantly lower corporate profits in the second half of 2023. Over the past several weeks, I have also purchased some SPDR S&P 500 ETF ( SPY ) put options as insurance against a stock market decline greater than -10% over the summer. I am now contemplating adding QQQ puts.
My working assumption, the same as I have explained the last 10 months, is gold should "lead" the U.S. equity market higher once a durable price bottom is in place. When exaggerated investor fear is commonplace and the Federal Reserve freaks out, shifting to massive new rounds of money printing, we can debate an eventual and honest rebound in stocks. Until then, the Fed and U.S. markets may be trapped into a flat to lower price scenario for financial securities (including bonds).
Thanks for reading. Please consider this article a first step in your due diligence process. Consulting with a registered and experienced investment advisor is recommended before making any trade.
For further details see:
QQQ: Underlying Breadth Stinks, Screaming Sell