QQQE - QQQE: Equal Weighted Nasdaq Is An Equally Large Bubble
2023-07-24 05:59:04 ET
Summary
- The equal weighted Nasdaq 100 has underperformed the capitalisation weighted index over recent years, but this has reflected the former's weak fundamental performance.
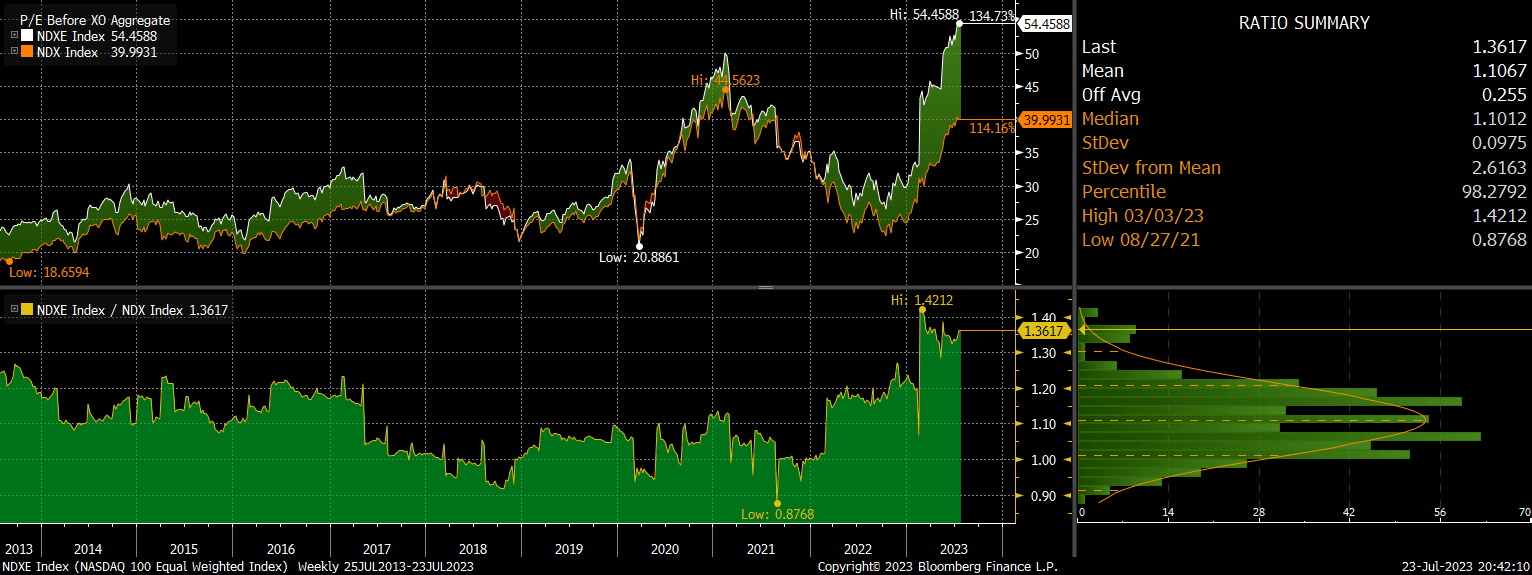
- With a PE ratio of 54x, the median Nasdaq 100 stock is trading at higher valuations than the Nasdaq 100 itself after a 40% drop in earnings.
- The Direxion Nasdaq-100 Equal Weighted Index Shares ETF faces the risk of negative free cash flows in a recession and may continue its long-term underperformance versus the Nasdaq 100.
While the rally in mega cap tech stocks have stolen the headlines over recent months, the average Nasdaq 100 stock is actually trading at more extreme valuations after earnings have fallen by 40% from their 2022 peak. The PE ratio excluding extraordinary items sits at 54x, which is even more expensive than the Nasdaq 100 itself despite a decade of underperformance. Profit margins have halved from their peak even as sales have continued to rise, highlighting the cost pressures facing the tech sector. The Direxion Nasdaq-100 Equal Weighted Index Shares ETF ( QQQE ) faces the prospect of negative free cash flows in the event of a recession, which could see the ETF continue its long-term underperformance versus the Nasdaq 100.
The QQQE ETF
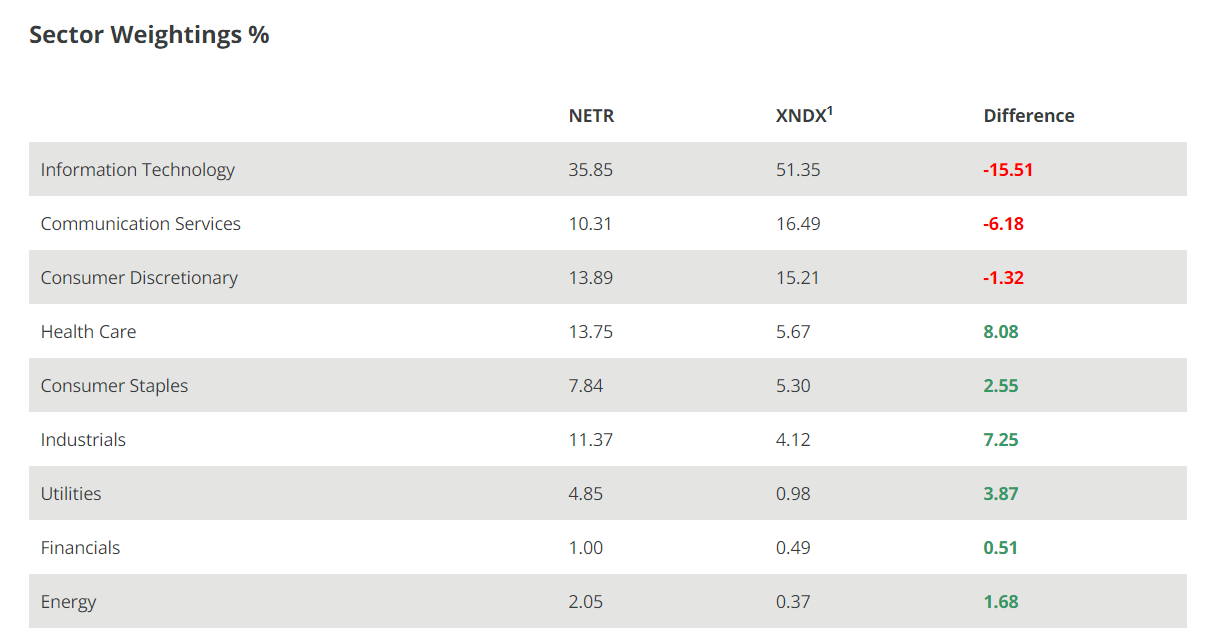
The Direxion NASDAQ-100 Equal Weighted Index seeks investment results, before fees and expenses, that track the Nasdaq-100 Equal Weighted Index, and has been successful in this pursuit over the last decade, with almost zero tracking error. The ETF rebalances on a quarterly basis and allows greater diversification across market segments and individual stocks, making the QQQE much less dependent on the mega-cap names that have driven the rally. While the ETF is still heavily weighted towards the technology sector, its weighting is far below that of the capitalization weighted index as the table below shows. The ETF charges an annal expense fee of 0.35% and pays a dividend yield of 0.8%.
Earnings Crash Continues As Costs Surge
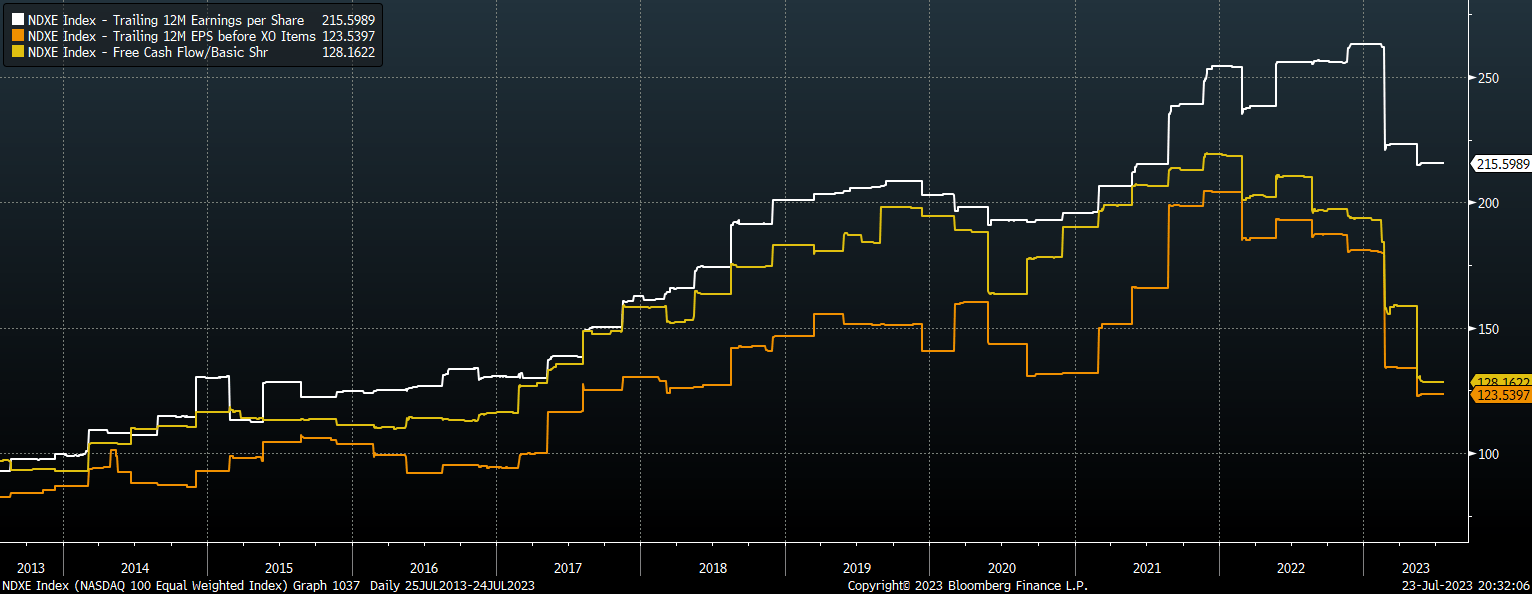
Having correctly predicted the downturn in tech sector earnings over the past year, the market's resilience has been surprising. The median Nasdaq 100 stock has seen earnings per share completely erase the post-Covid surge, falling back to 2017 levels. The reason I focus on earnings excluding extraordinary items is that these are the actual earnings that the company has made and are much more closely correlated with free cash flows, which have also plunged.
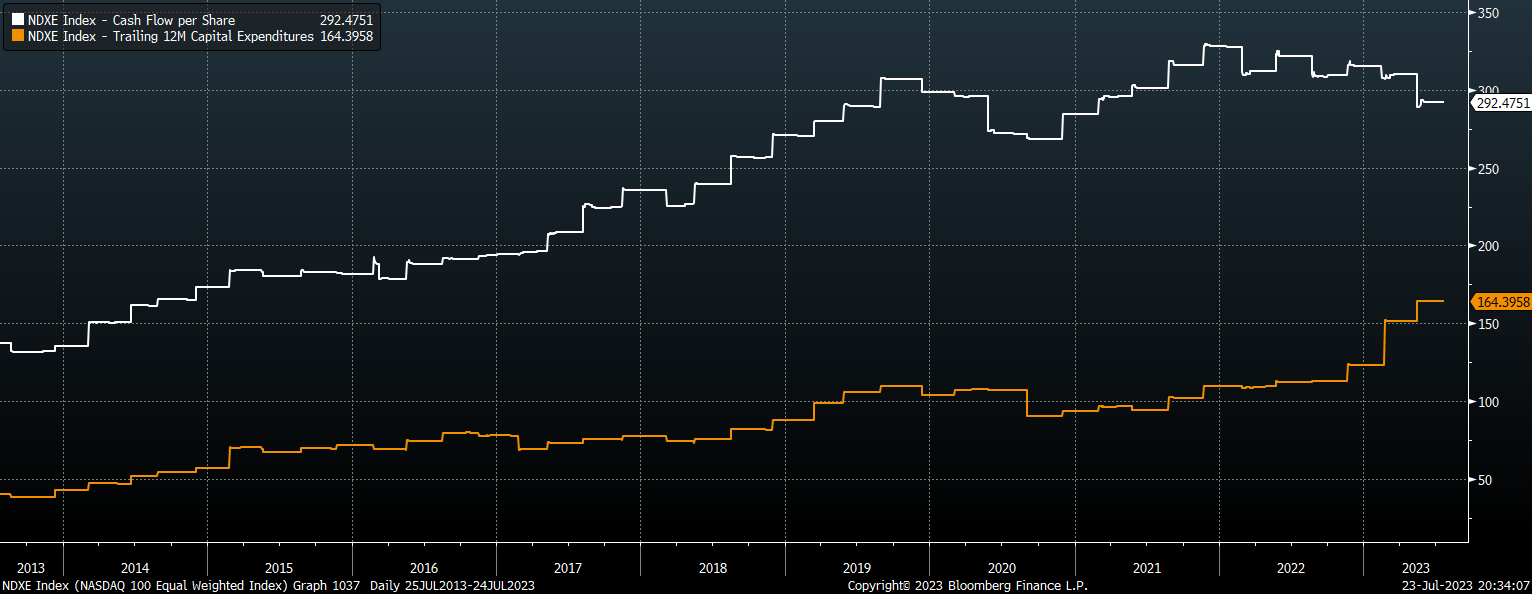
For profits to fall so much even as sales continue to rise is quite astonishing. The reason being that costs have risen by a staggering 25% over the past year and show no sign of slowing down. In terms of free cash flow, capex spending has risen by over 50% over the past year and is now up eats up almost 60% of operating cash flows.
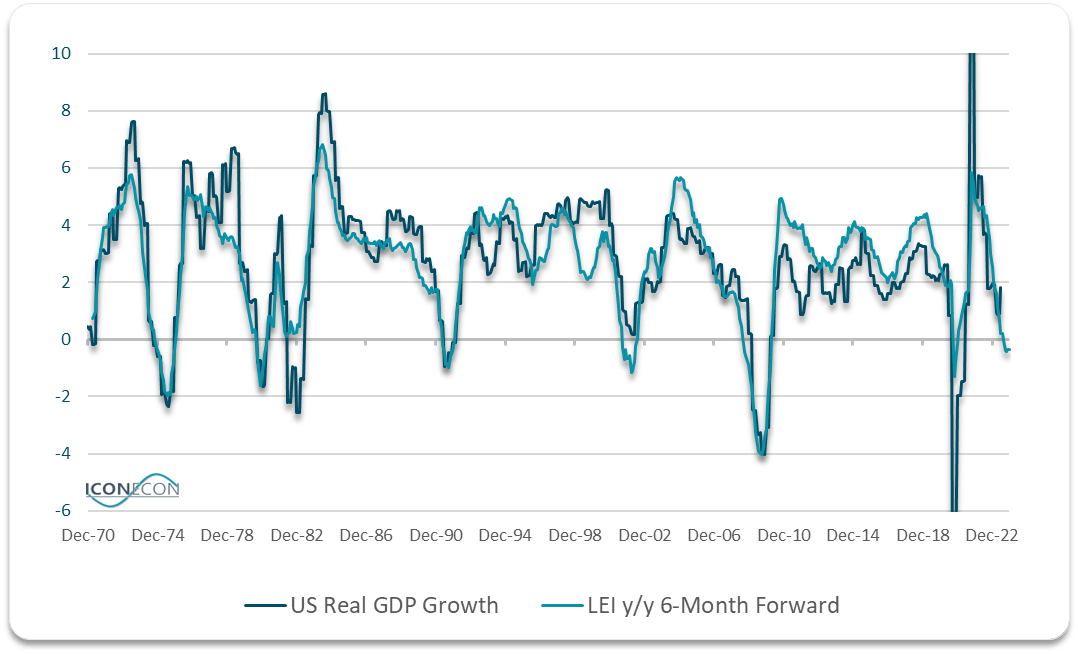
Even a small fall in revenues could see free cash flows turn negative. With free cash flow margins now at just 6%, this means it would take just a 6% fall in sales to see the average Nasdaq 100 stock become free cash flow negative, even if costs were to remain unchanged. Such a drop could easily occur in the event of a deep US recession, which remains highly. The Conference Board's Leading Indicator Index continues to point to a contraction in real GDP by end-2023.
A History Of Underperforming During Downturns
The underperformance of the median stock over the past decade reflects underperformance in fundamentals. Even if we ignore the collapse in profit margins by focusing on the price-to-sales ratio, the NDX 100 has seen sales rise by around 2pp faster over the past decade, leaving QQQE's price-to-sales discount no higher than it was in 2013.
NDXE Vs NDX (Bloomberg)
Lower profit margins for the median NDX 100 stock are a key reason why the QQQE has tended to underperform the QQQ during periods of economic weakness. This was seen during the 2008 crisis and again in the covid recession, and despite the underperformance seen in recent years, now is not the time to for a reversal.
Market Internals Are Hollowing Out As A Peak Approaches
While the QQQE remains in an uptrend for now, the market's internal dynamics warn of a potential reversal. The following chart shows periods where the QQQE is trading within 2% of its 52-week highs, while at the same time the majority of Nasdaq Composite Index stocks are below their own 200-dma and there are more 52-week lows than highs.
QQQE Vs Market Internals (Bloomberg)
This paints a picture of a market that is being driven by a small number of stocks while the majority are already in bear markets. While not a perfect timing indicator, such activity has acted as a decent warning signal of market tops over the past decade.
For further details see:
QQQE: Equal Weighted Nasdaq Is An Equally Large Bubble