QYLG - QQQX Vs. QYLG: Which ETF Is Better?
2023-07-21 16:06:17 ET
Summary
- The Nuveen Nasdaq 100 Dynamic Overwrite Fund (QQQX) and Global X Nasdaq 100 Covered Call & Growth ETF (QYLG) both overwrite approximately 50% of their portfolios, but QQQX has lagged behind QYLG in total returns.
- QQQX has a higher expense ratio (0.92%) compared to QYLG (0.6%) and its 'dynamic' overwriting strategy appears to add 'negative alpha' compared to Global X's mechanical overwriting strategy.
- The author recommends investors currently holding QQQX to consider switching to QYLG.
Recently, I wrote an initiating article on the Global X Nasdaq 100 Covered Call & Growth ETF ( QYLG ), noting that I preferred the QYLG compared to its larger sibling, the Global X Nasdaq 100 Covered Call ETF ( QYLD ) as it retains some capital appreciation upside while delivering attractive distribution yields.
This article covers the Nuveen Nasdaq 100 Dynamic Overwrite Fund ( QQQX ), a fund that looks very similar to QYLG on paper. Out of the two, QYLG and QQQX, which fund do I think is better?
Fund Overview
The Nuveen Nasdaq 100 Dynamic Overwrite Fund ((QQQX)) is designed to offer investors attractive distributions combined with capital appreciation potential. It invests in a portfolio that substantially replicates the Nasdaq 100 Index, while writing call options on 35-75% of the notional value of the fund, with a 55% long-term target.
The QQQX is a fairly popular fund, with $1.2 billion in assets and charges a 0.92% total expense ratio (Figure 1).
Figure 1 - QQQX capital structure and management fees (QQQX factsheet)
Portfolio Holdings
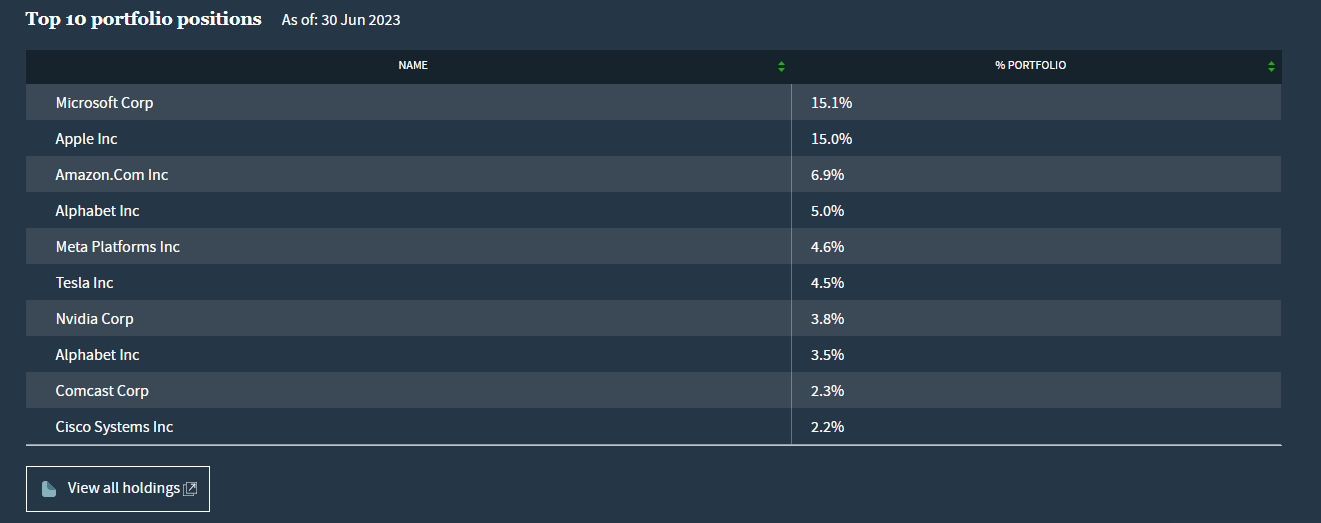
The QQQX ETF's strategy is to replicate the returns of the Nasdaq 100 Index combined with a call-writing overlay. Hence, the fund's equity holdings are essentially that of the Nasdaq 100 Index, with the top 10 holdings shown in Figure 2 below.
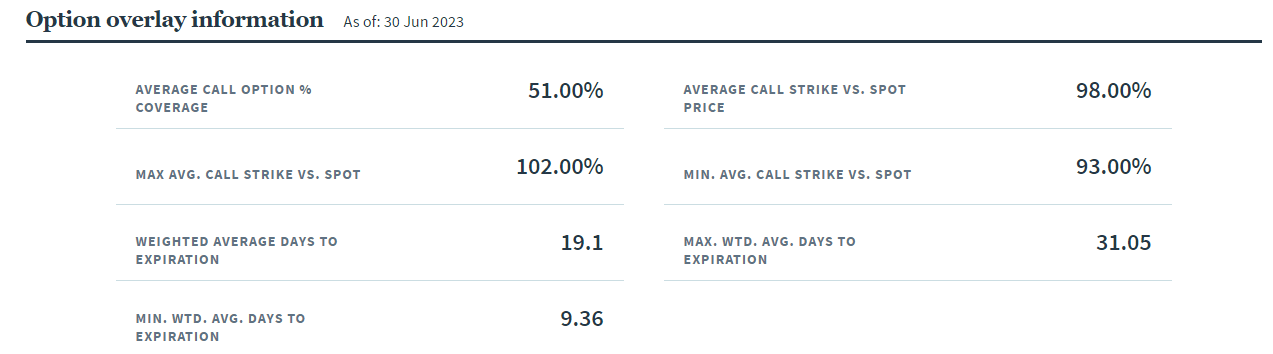
Figure 3 details the call options written by the QQQX fund. As of June 30, 2023, the QQQX ETF has written call options on 51% of the notional of the fund, with average call strike 98% of spot price with expiration of 19 days on average.
Distribution & Yield
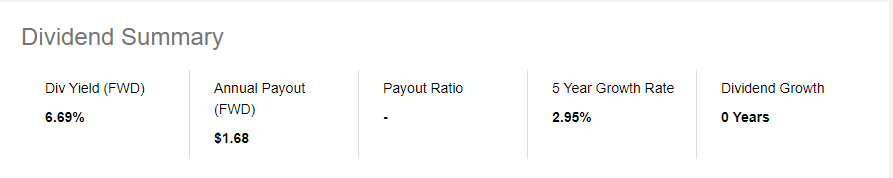
QQQX's option overlay strategy has allowed the ETF to pay a handsome distribution, currently set at $0.42 / quarter or a forward yield of 6.7% (Figure 4).
Returns
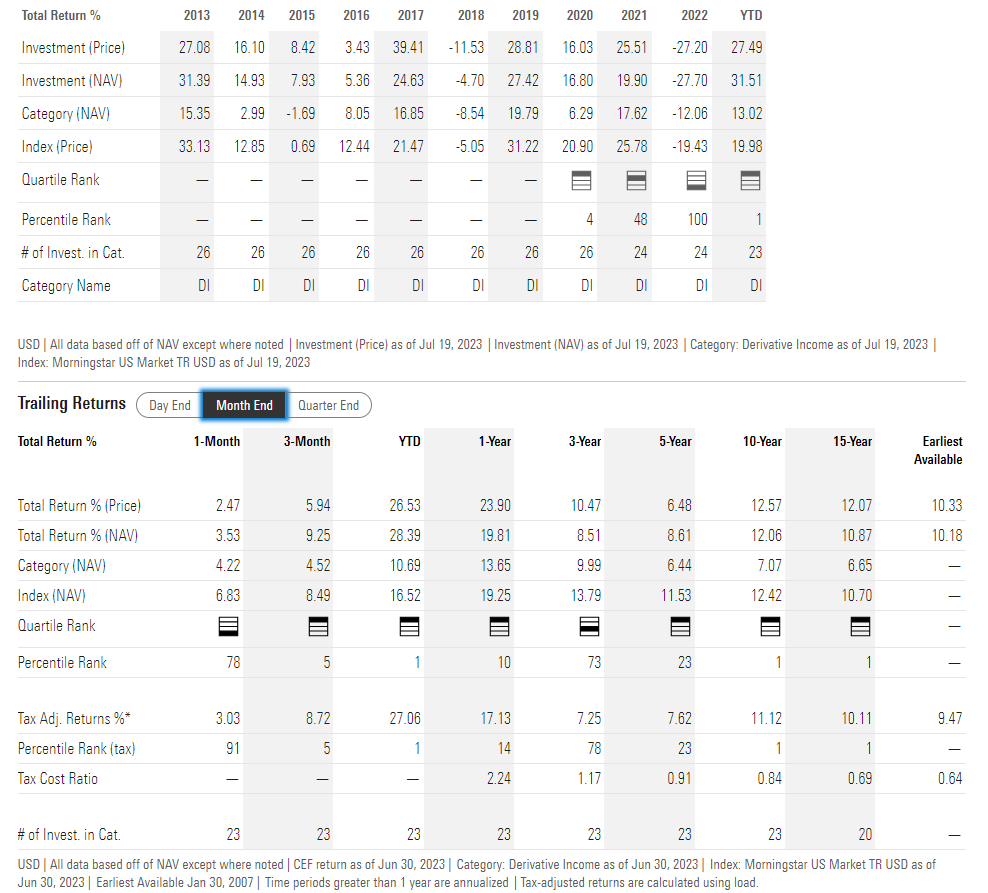
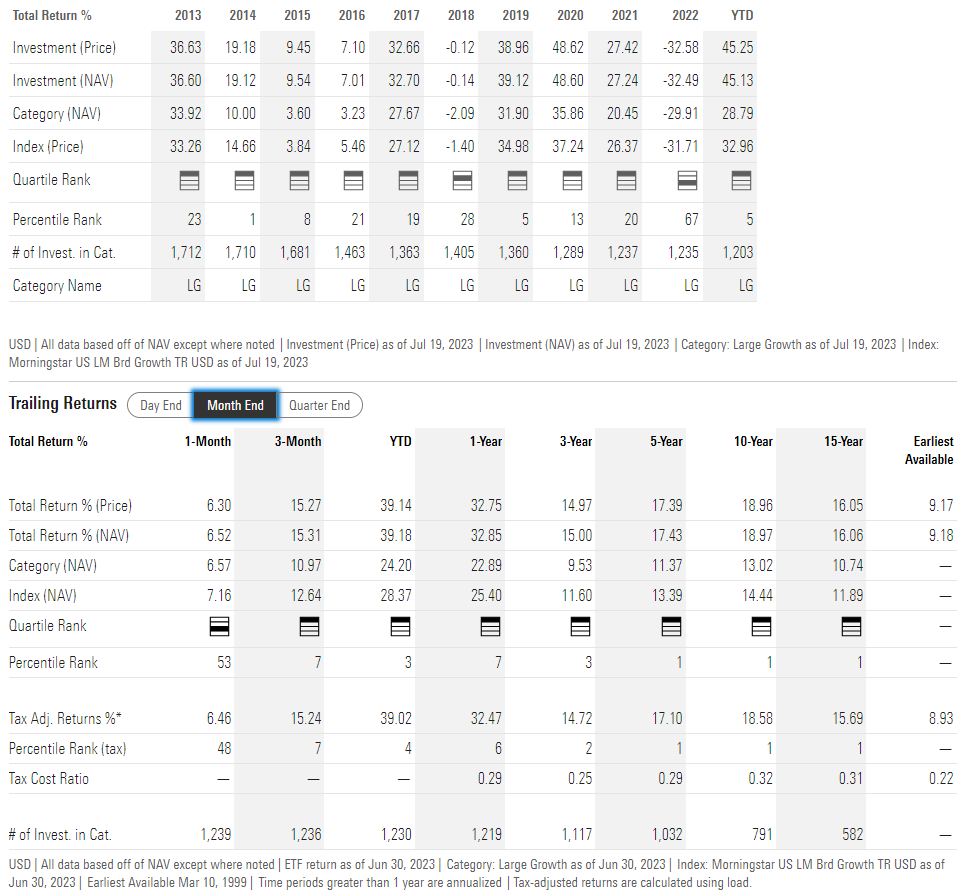
Figure 5 shows QQQX's historical returns. The QQQX ETF has been in operation for a very long time and has delivered respectable 3/5/10/15Yr average annual returns of 8.5%/8.6%/12.1%/10.9% respectively to June 30, 2023.
Figure 6 shows the historical returns of the Nasdaq 100 Index, as modeled by the Invesco QQQ Trust ETF ( QQQ ), for comparison.
Investors should note that by writing call options on roughly half of its portfolio, the QQQX is bound to underperform the QQQ. Essentially, investors in the QQQX ETF are trading part of their upside for a high current distribution yield. This is one of the main weaknesses I see of call-writing strategies that I have written about in several prior articles .
Distribution Yield Vs. Total Returns: Different Strokes For Different Folks
While I personally believe the best metric to use to compare investment funds is total returns, I can see the appeal of a high distribution yield for income-oriented investors. For example, if I am a retiree near the end of my investment horizon, a $100,000 investment in a product like the QQQX ETF can provide me with a monthly income of ~$550 to supplement my retirement pension whereas the QQQ ETF yields close to nothing. A bird in the hand is worth two in the bush .
QQQX Vs. Peers
Assuming readers are comfortable making the current income vs. total return tradeoff, is the QQQX ETF the best product to use?
Figure 7 compares the QQQX ETF vs. the QYLG ETF, the QYLD ETF, the QQQ ETF, and the SPDR S&P 500 ETF Trust ( SPY ). In terms of fund structure, the QQQX ETF is the most expensive of the 5, charging a 0.92% expense ratio (author's note, Seeking Alpha's expense ratio appears to be outdated, as the latest fact sheet noted QQQX's expense ratio is 0.92% and not 0.89%).
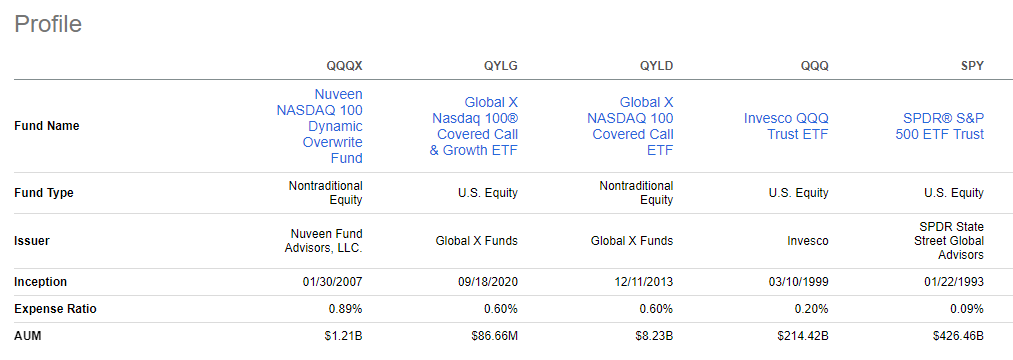
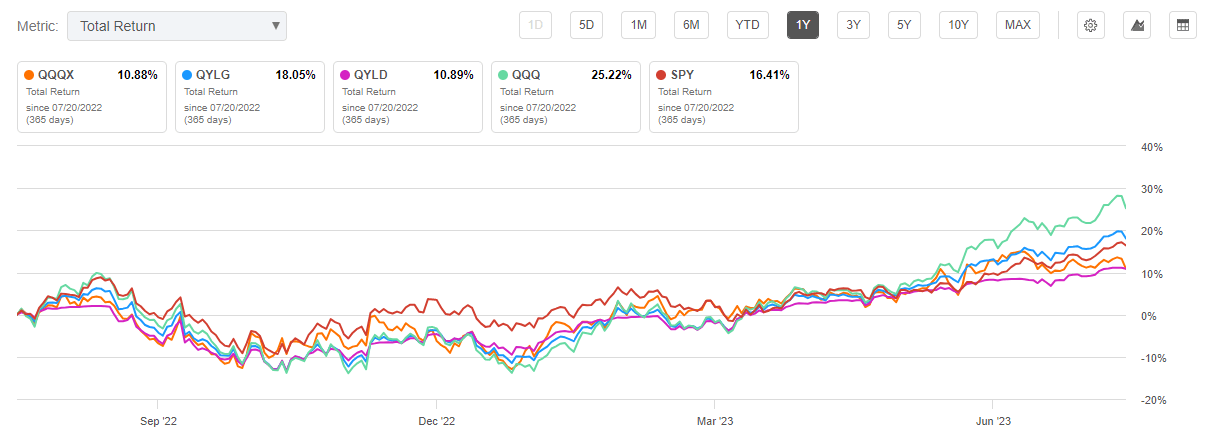
Comparing returns, we can see that the QQQX ETF has the lowest 1Yr performance of the 5 peer funds, on par with the QYLD ETF at 10.9%. This is unusual, as the QYLD ETF overwrites 100% of its portfolio and hence should have the lowest return during the bull market we have experienced. The QYLG ETF, with 50% upside capture, was able to deliver 18.1% returns, less than QQQ, but better than SPY.
Figure 1 - QQQX vs. Peers, 1Yr total returns (Seeking Alpha)
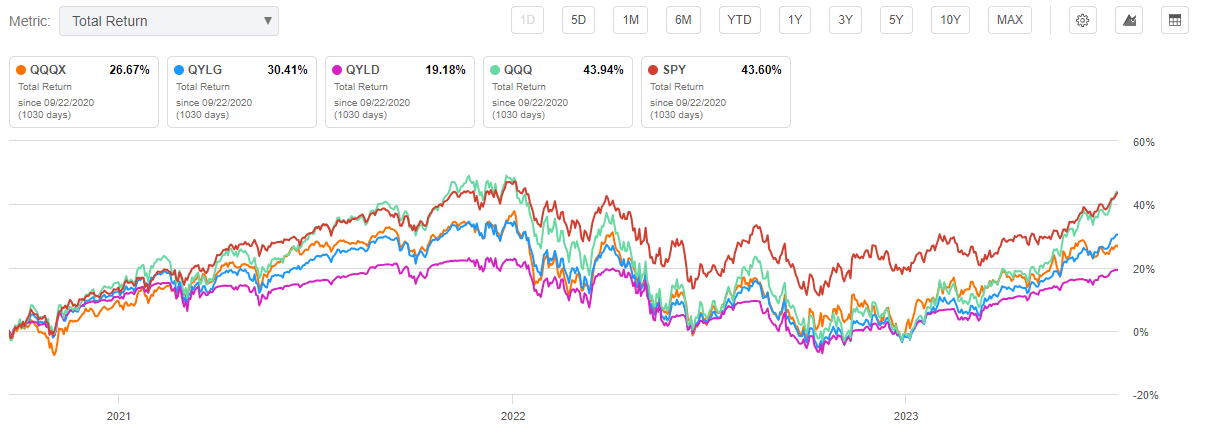
Similarly, when we stretch our comparison to a longer-period, from September 22, 2020 (the inception date of the QYLG ETF), we can see a significant performance gap between the QQQX ETF (26.7%) and the QYLG ETF (30.4%). Note that both QQQX and QYLG have outperformed the QYLD, but have underperformed the QQQ and SPY ETFs respectively. This is to be expected, as over longer-term horizons, call-write strategies tend to underperform.
Figure 8 - QQQX vs. Peers, Total returns since September 22, 2020 (Seeking Alpha)
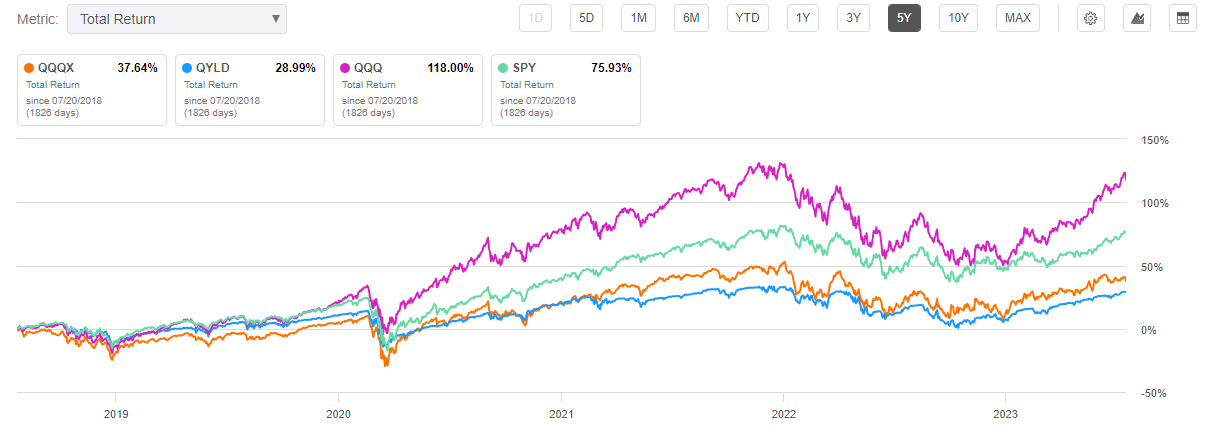
Next, if we stretch the performance history back further, we can see that over 5 years, the QQQX ETF has delivered roughly half the total returns of the SPY, and 1/3 the total returns of the QQQ ETF. The longer your investment horizon, the more unappealing call-write strategies become.
Figure 9 - QQQX vs. Peers, 5Yr total returns (Seeking Alpha)
Finally, if we compare distribution yields, the QQQX ETF is currently yielding 6.7% while the QYLG ETF is paying a forward monthly distribution yield of 5.7% and the QYLD ETF is paying a forward monthly distribution yield of 11.6%. QQQ's distribution yield is a negligible 0.6% while the SPY pays a 1.4% yield.
Overall, I believe the QYLG ETF is superior to the QQQX. First, QQQX is a more expensive fund, with a 0.92% expense ratio compared to 0.6% for QYLG. Furthermore, although both strategies aim to overwrite ~50% of its portfolio, based upon the historical performance results noted above, the QYLG ETF has been able to deliver higher total returns by sticking to a mechanical 50% overwriting compared to Nuveen's 'dynamic' overwriting. Put another way, the QQQX appears to be adding 'negative alpha' by varying the amount of its portfolio overwritten.
Conclusion
The Nuveen Nasdaq 100 Dynamic Overwrite Fund delivers respectable total returns by replicating the Nasdaq 100 Index and overwriting on average 55% of its portfolio.
While the QQQX and QYLG ETF looks very similar on paper, both overwriting approximately 50% of their portfolios, the QQQX ETF has significantly lagged the QYLG ETF in terms of total returns in the time since QYLG has been in operation. This suggests Nuveen's 'dynamic' overwriting strategy is actually adding 'negative alpha' compared to Global X's mechanical overwriting strategy.
For investors currently holding the QQQX ETF, I recommend they switch to the QYLG ETF, since it is both cheaper and has delivered a higher total return historically.
For further details see:
QQQX Vs. QYLG: Which ETF Is Better?