IYW - QTEC: How To Slot This Equal-Weight Tech ETF Into Your Portfolio
2023-08-08 17:09:10 ET
Summary
- QTEC provides equal-weight exposure to Technology companies in the Nasdaq-100 Index. A key drawback is its 0.57% expense ratio, but QTEC's long-term track record is solid.
- This article evaluates QTEC's annual returns alongside 17 other Technology ETFs, including popular plain vanilla funds like XLK and VGT.
- I determined that QTEC has a higher growth profile than these low-fee funds. For investors looking for diversified exposure to the sector beyond Apple and Microsoft, it's a decent choice.
- QTEC trades at a rich 33x forward earnings, but also offers 16.10% estimated earnings growth, 5.10% more than VGT. These figures indicate that future growth will likely come from small- and mid-caps.
- I like QTEC's fundamentals but I am concerned about its high valuation and the potential for a market decline. QTEC's high fees are an additional headwind, so I've rated the ETF a solid "hold".
Investment Thesis
Today, I will initiate coverage on the First Trust NASDAQ-100-Technology Sector Index ETF ( QTEC ), an equal-weight solution for Technology investors looking for exposure across all size segments. QTEC's 0.57% expense ratio is high, as with many First Trust ETFs. However, QTEC is well-established, with a track record dating to May 2006, and its lower exposure to mega-cap stocks may be attractive based on relatively weak earnings results from stocks like Apple ( AAPL ) and Microsoft ( MSFT ). I look forward to taking you through QTEC's strategy, fundamentals, and long-term results, and I hope it will help you determine whether it's the right fit for your portfolio.
QTEC Overview
Strategy and Top Ten Holdings
QTEC tracks the Nasdaq-100 Technology Sector Index, selecting securities of the Nasdaq-100 Index classified as Technology according to the Industry Classification Benchmark system. Approximately 91% of QTEC's weight is assigned to the Technology sector under Global Industry Classification Standards. However, the ICB system also includes Meta Platforms ( META ) , Alphabet ( GOOGL , GOOG ), and PDD Holdings ( PDD ) , the Chinese online retailer. The Index is equal-weighted and rebalanced quarterly using closing prices as of the third Friday in March, June, September, and December, and readers can find the complete methodology at this link .
QTEC holds 38 securities, including Alphabet's two share classes, so each company receives a 2.70% initial weight at each rebalancing. The top ten holdings below merely represent the best performers since the last rebalancing and include ON Semiconductor ( ON ) , Lam Research ( LRCX ) , and Datadog ( DDOG ) . These companies are trading 5-9% above their 50-day moving average prices, and they're also up substantially this year. ON and LRCX gained over 64% YTD.
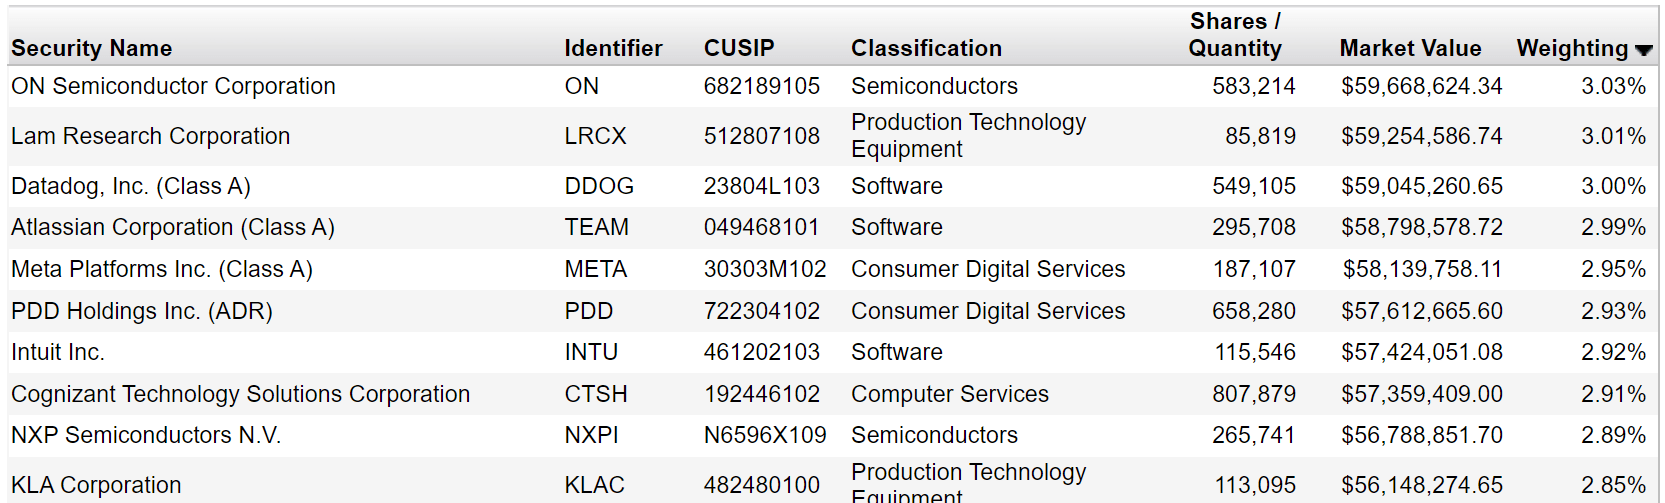
First Trust
Names at the bottom of the list include Fortinet ( FTNT ) , trading 22.58% below its 50-day moving average price. Palo Alto Networks ( PANW ) and ANSYS ( ANSS ) are 8.21% and 7.38% below, so take QTEC's top holdings list with a grain of salt. The Index rebalances quarterly, and later, I'll analyze QTEC's fundamentals "as is" and at a true equal weight to see if there are any material differences.
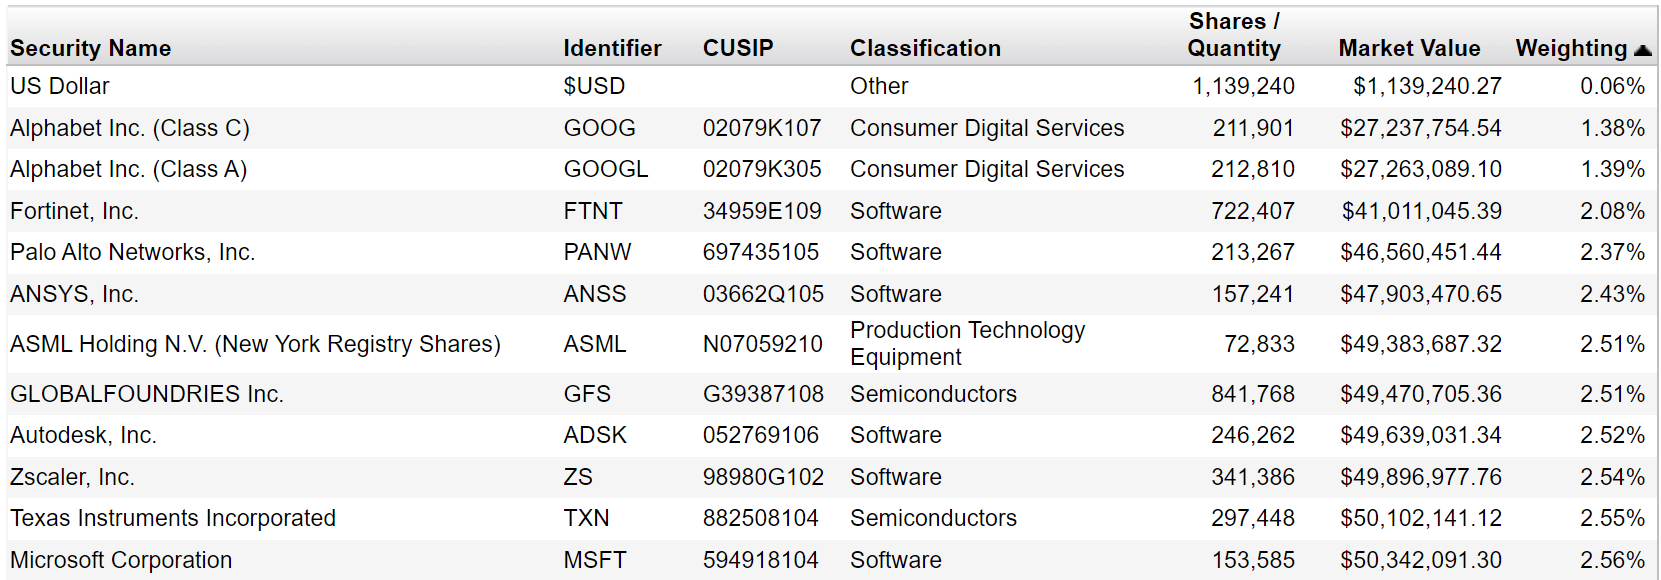
First Trust
Performance Analysis
The following table highlights QTEC's long-term returns since December 2006 compared with three other well-established alternatives. Given its equal-weighting scheme, the Invesco S&P 500 Equal Weight Technology ETF ( RSPT ) is an obvious alternative. The iShares U.S. Technology ETF ( IYW ) tracks Russell 1000 Index Technology stocks and is market-cap-weighted. Finally, the Technology Select Sector SPDR ETF ( XLK ) is the most concentrated of the four, offering market-cap-weighted exposure to large-cap Technology stocks only.
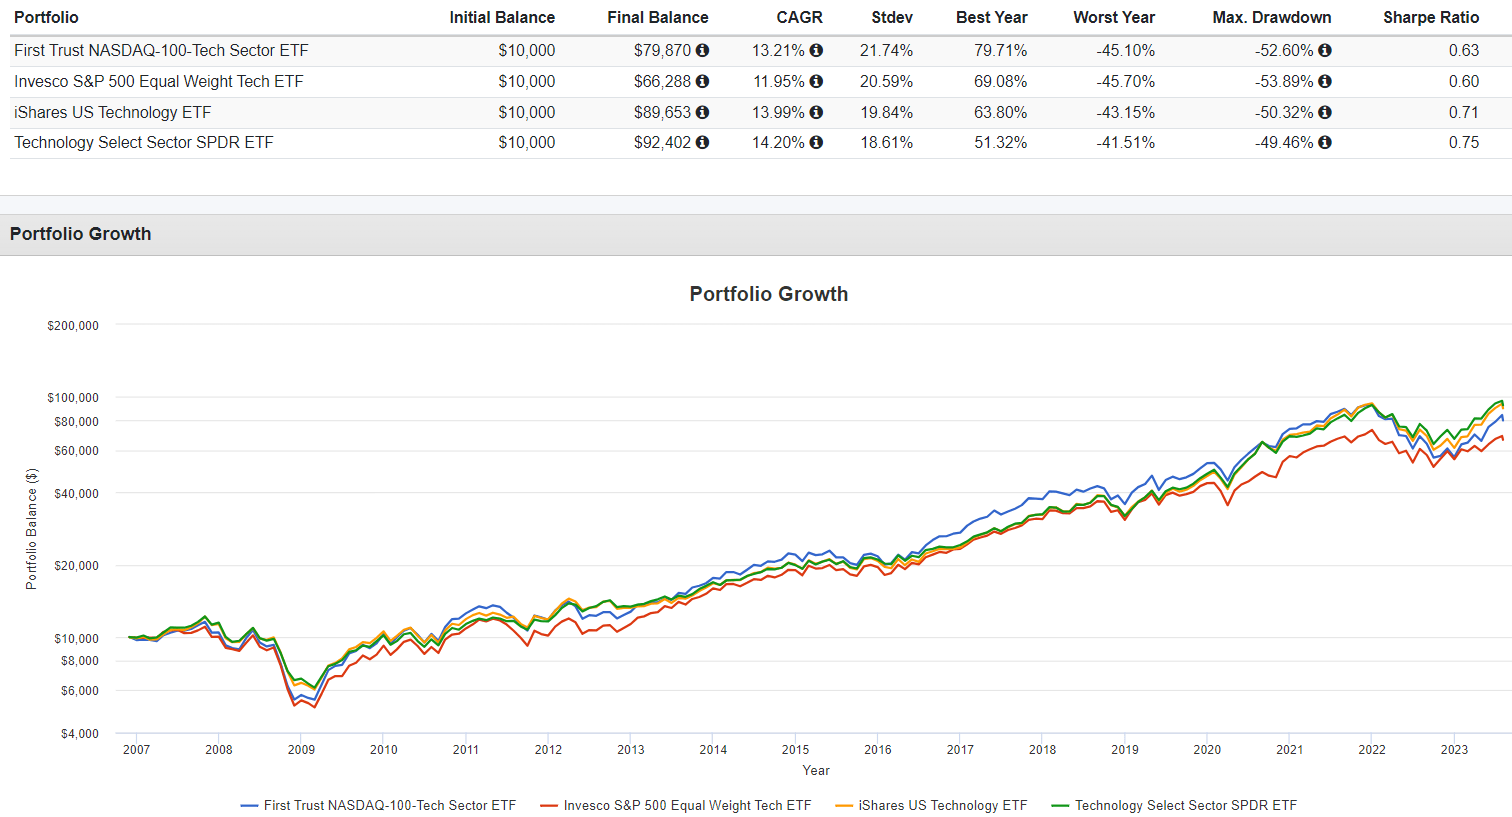
Portfolio Visualizer
QTEC delivered an annualized 13.21% gain compared to 11.95%, 13.99%, and 14.20% for RSPT, IYW, and XLK, respectively. Of note is that in the 17 years from 2007-2023, QTEC outperformed RSPT 11 times, so it appears to be the better equal-weight option. Although QTEC is surpassing RSPT by 21.69% YTD, it lagged by 15.33% in 2022.
I've compiled a more comprehensive list of ETFs in the table below. There are 18 broad-based options, and eight have a track record dating to 2007. To account for additions throughout the years, I've included quartile rankings for QTEC in the bottom rows, with additional commentary to follow.
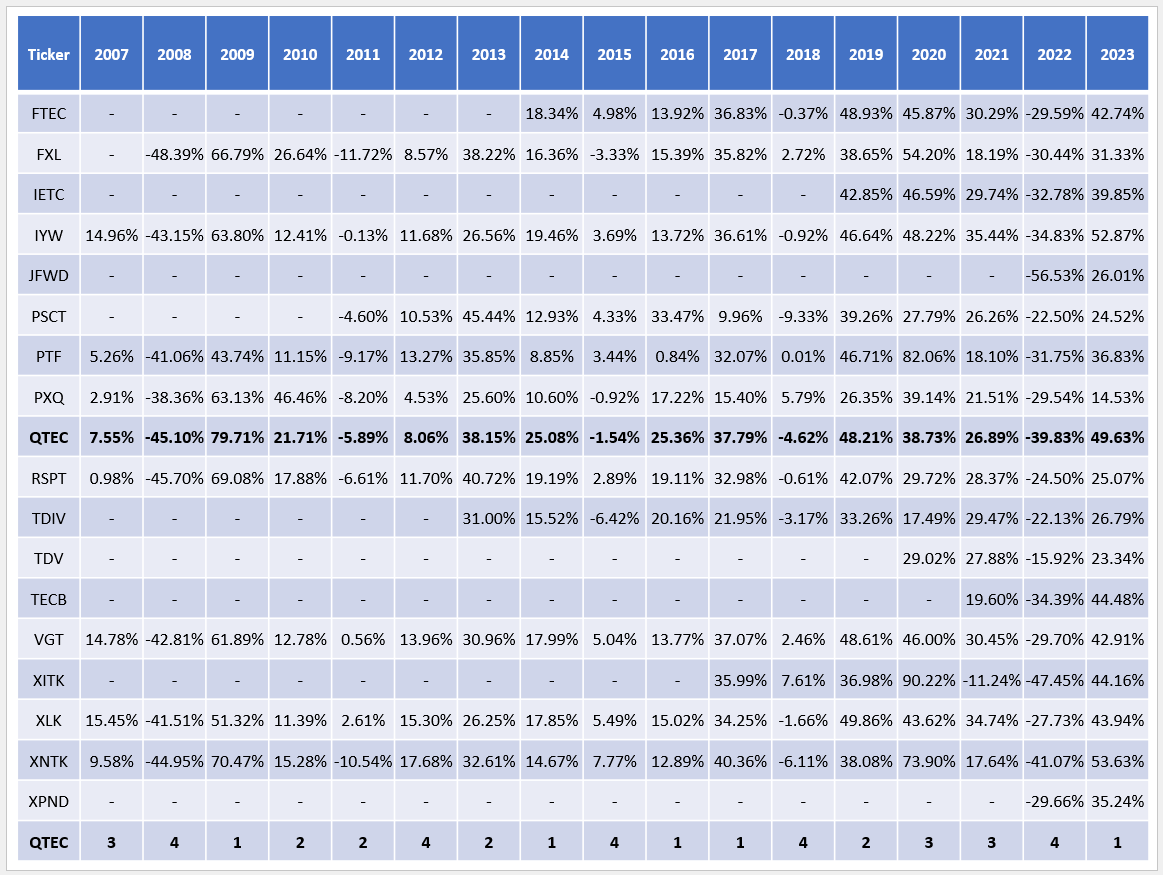
The Sunday Investor
As shown, QTEC is a first-quartile performer in 2023, with a 49.63% gain through July. Other top performers include IYW, the iShares U.S. Technology Breakthrough Multisector ETF ( TECB ), and the SPDR NYSE Technology ETF ( XNTK ). TECB follows a tiered weighting scheme and selects stocks based on fundamentals, while XNTK is another equal-weight ETF. Given these results, there is an appetite for small- and mid-cap Technology companies this year, as they have more impact on non-market-cap-weighted funds. However, it's also worth noting how QTEC, IYW, and XNTK were fourth-quartile performers when markets declined last year, while TECB ranked in the third quartile.
Finally, QTEC ranked in the top two quartiles in 9/17 years between 2007-2023. Of the eight ETFs trading in 2007, IYW matched that record, but the Vanguard Information Technology ETF ( VGT ) was the real standout with 13/17 years of above-average returns. For those not familiar, VGT is market-cap-weighted but selects stocks across all size segments like QTEC. In a way, it's a compromise between QTEC and XLK, and with a low 0.10% expense ratio, it's an excellent fund to compare with fundamentally.
QTEC Analysis
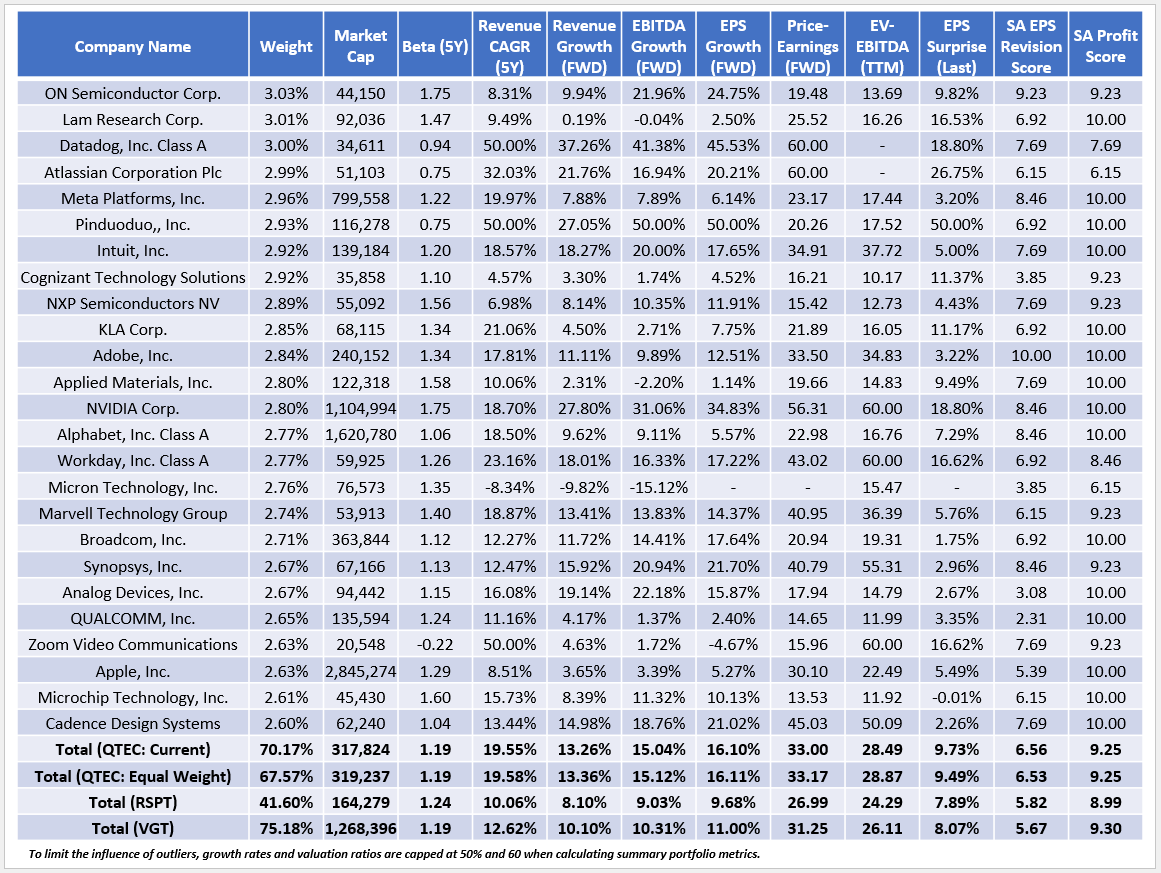
The following table highlights selected fundamentals for QTEC's top 25 holdings, totaling 70.17% of the portfolio. I ran the same calculations for QTEC as a true equal-weight fund and also for RSPT and VGT.
The Sunday Investor
After reweighting QTEC, there doesn't appear to be any significant rebalancing risk, as all metrics remained similar. Currently, QTEC features a 13.26% estimated sales growth rate, substantially above RSPT (8.10%) and VGT (10.10%), so I like it for its growth potential. We see an even wider gap in estimated EBITDA and EPS growth, so it makes sense that QTEC has outperformed this year. It's well-known that growth stocks are doing well again after struggling in 2022.
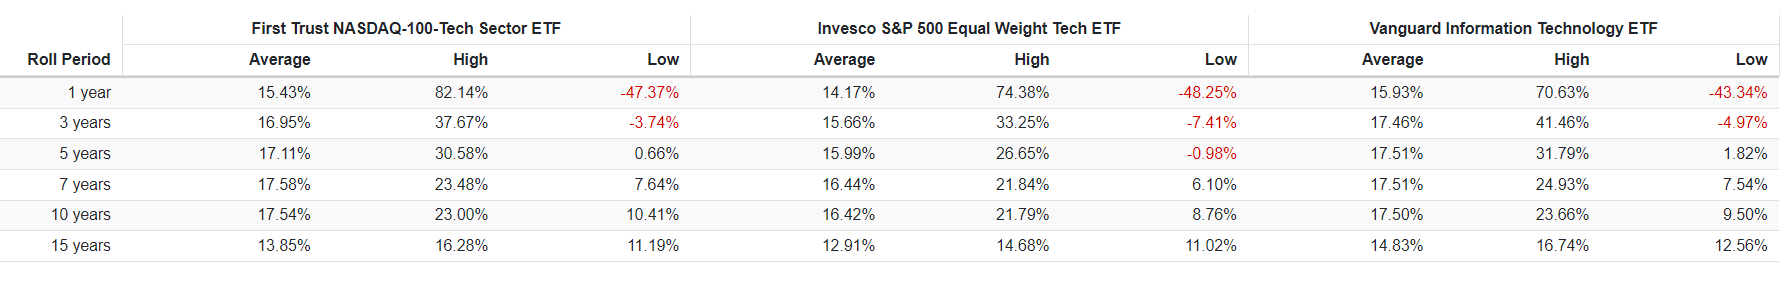
QTEC trades at 33.00x forward earnings and 28.49 trailing EV-EBITDA, 6.01 and 4.29 points above RSPT. Again, this suggests a higher risk profile. Historical returns support this concept, too. The table below shows that QTEC delivered higher highs than RSPT over every rolling period measured. QTEC had higher lows, too, though the gap is more narrow. Either way, I believe QTEC is a superior fund, not just because of its better track record but because its constituents have more substantial growth rates. After all, growth is a key reason investors turn to dedicated Technology ETFs.
Portfolio Visualizer
It's less clear if QTEC is better positioned than VGT. VGT offers a cheaper valuation and 5.10% less estimated EPS growth, but it's dominated by Apple and Microsoft with a combined 44% allocation. Historically, betting against these mega-caps has yet to work, but owning them individually while supplementing with a more diversified ETF like QTEC makes sense too. Given how they'll both be prominent holdings in any market-cap-weighted Technology ETF for the foreseeable future, this approach would allow you to customize your small-, mid-, and large-cap exposure.
Not surprisingly, it's these stocks that weigh down VGT's fundamentals. Analysts expect Apple and Microsoft to grow earnings per share by just 5.27% and 9.17% over the next twelve months. Each trade at approximately 30x forward earnings and delivered a mere 5.5% earnings surprise last quarter, hardly enough to get excited about. In contrast, QTEC's EPS Revision Score is a solid 6.56/10 vs. VGT's 5.67/10, indicating that the small- and mid-cap stocks are the ones Wall Street is most optimistic about.
Investment Recommendation
QTEC has a solid track record and has demonstrated it's superior to RSPT, the S&P 500 equal-weighted Technology ETF. Historically, market-cap-weighted ETFs like XLK and VGT outperformed, but that's primarily due to the success of Apple and Microsoft, which may not be great near-term buys. Instead, I recommend holding one or both of these stocks individually and then supplementing with an alternatively-weighted ETF like QTEC, as it offers excellent growth rates across the board. Still, its 0.57% expense ratio is disappointing, and I'm cautious about recommending readers buy into a high-fee fund at a time when growth stocks may be overvalued. Therefore, I've set my rating on QTEC to "hold," but I look forward to covering it regularly as market dynamics change. Thank you for reading.
For further details see:
QTEC: How To Slot This Equal-Weight Tech ETF Into Your Portfolio