KWR - Quaker Chemical: Specialty Chemicals Today's Best Near Cap-Gain Stock Buy
2023-04-24 05:40:36 ET
Summary
- A 3-5 month prospect from here of KWR share prices could reasonably range from a low of $186 to a high of $213 from its present $188 price, up 13.5%.
- Our last similar value in September reached its +10% upside sell target of $175 from $158 in 35 market days.
- 37 positions like today’s in the past 5 years of 1261 market days each averaged 9.1 net gains during 31 market days (6 weeks) a 103% CAGR annual rate.
- Those holding periods had worst price draw-downs of only -6.4%.
- These odds-on, triple-digit investment-rate rewards are far above market average experiences.
Investment Portfolio Discipline Summary
Blockdesk's Standard Performance Comparison fund invests in equities whenever Market-Maker hedging activity forecasts that 80% or more of the near-coming price range is expected to be to the upside and 10% or less may be to the downside. This is a guide to the balance of expectations, since coming price change directions tend to be led by prior extremes, issue by issue.
Holding periods are limited to achieving forecast price range maximums by, if not before, 3 months. Active reinvestment in more promising investment alternatives at that time is called for in any loss-forecast holding."
Blockdesk.com
This article's primary focus is on Quaker Chemical Corporation ( KWR ).
Description of Primary Investment Candidate
Quaker Chemical Corporation develops, produces, and markets various formulated chemical specialty products for a range of heavy industrial and manufacturing applications. The company operates through four segments: Americas; Europe, Middle East, and Africa; Asia/Pacific; and Global Specialty Businesses. It offers metal removal fluids, cleaning fluids, corrosion inhibitors, metal drawing and forming fluids, and surface treatment chemicals. It serves steel, aluminum, automotive, aerospace, offshore, container, mining, and metalworking companies. The company was formerly known as Quaker Chemical Products Corporation and changed its name to Quaker Chemical Corporation in August 1962. Quaker Chemical Corporation was founded in 1918 and is headquartered in Conshohocken, Pennsylvania."
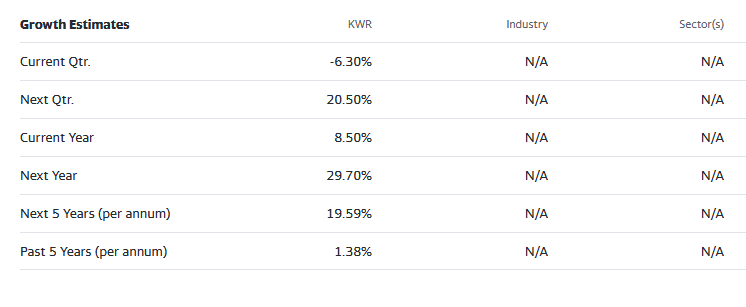
These growth estimates have been made by and are collected from Wall Street analysts to suggest what conventional methodology currently produces. The typical variations across forecast horizons of different time periods illustrate the difficulty of making value comparisons when the forecast horizon is not clearly defined.
Risk and Reward Balances Among KWR Competitors
Here are several healthcare equipment industry services like KWR. Following the same analysis as with KWR, historic sampling of their prior Risk-Reward balances like those of today were taken, and are mapped out in Figure 1.
Figure 1
blockdesk.com
Expected rewards for these securities are the average gains from current closing market price seen worth protecting short positions. Their measure is on the horizontal green scale.
The risk dimension is of actual price drawdowns at their most extreme point while being held in previous pursuit of upside rewards similar to the ones currently being seen. They are measured on the red vertical scale.
Both scales are of percent change from zero to 25%. Any stock or ETF whose present risk exposure exceeds its reward prospect will be above the dotted diagonal line. Capital-gain attractive to-buy issues are in the directions down and to the right.
Our principal interest is in KWR at location [1], at the lower-right edge of the symbols cluster. A "market index" norm of reward~risk tradeoffs is offered by SPY at [7], not currently competitive. Most appealing (to own) by this Figure 1 view is KWR.
Comparing features of Alternative Investment Stocks
The Figure 1 map provides a good visual comparison of the two most important aspects of every equity investment in the short term. There are other aspects of comparison which this map sometimes does not communicate well, particularly when general market perspectives like those of SPY are involved. Where questions of "how likely' are present other comparative tables, like Figure 2, may be useful.
Yellow highlighting of the table's cells emphasize factors important to securities valuations and the security KWR, most promising of near capital gain as ranked in column [R].
Figure 2
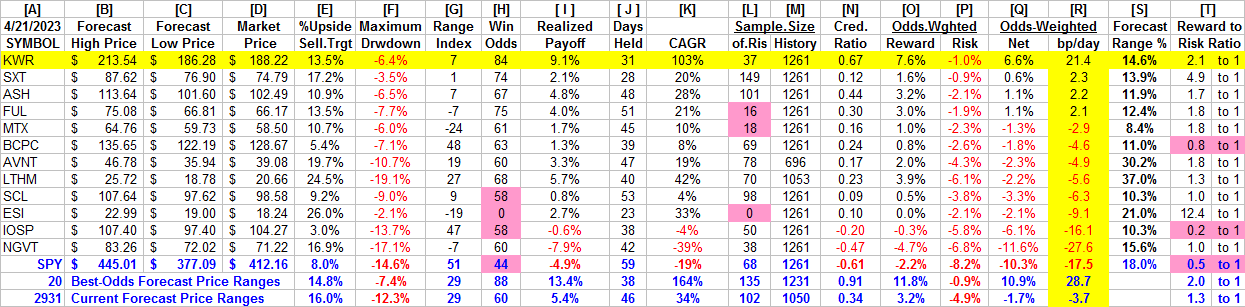
Why do all this math?
Figure 2's purpose is to attempt universally comparable answers, stock by stock, of a) How BIG the prospective price gain payoff may be, b) how LIKELY the payoff will be a profitable experience, c) how SOON it may happen, and d) what price drawdown RISK may be encountered during its holding period.
Readers familiar with our analysis methods after quick examination of Figure 2 may wish to skip to the next section viewing Price range forecast trends for KWR.
Column headers for Figure 2 define investment-choice preference elements for each row stock whose symbol appears at the left in column [A]. The elements are derived or calculated separately for each stock, based on the specifics of its situation and current-day MM price-range forecasts. Data in red numerals are negative, usually undesirable to "long" holding positions.
Table cells with yellow fills are of data for the stocks of principal interest and of all issues at the ranking column, [R].
The price-range forecast limits of columns [B] and [C] get defined by MM hedging actions to protect firm capital required to be put at risk of price changes from volume trade orders placed by big-$ "institutional" clients.
[E] measures potential upside risks for MM short positions created to fill such orders, and reward potentials for the buy-side positions so created. Prior forecasts like the present provide a history of relevant price draw-down risks for buyers. The most severe ones actually encountered are in [F], during holding periods in effort to reach [E] gains. Those are where buyers are emotionally most likely to accept losses.
The Range Index [G] tells where today's price lies relative to the MM community's forecast of upper and lower limits of coming prices. Its numeric is the percentage proportion to the downside of the full low to high forecast seen below the current market price.
The use of prior market actions subsequent to RIs like today make it necessary that those priors be representative of experiences in the just-past 5 year period of 1261 market days. Any RI sample of less than 20 market days could have occurred in one month of 21 market days. Out of the 5 years of 60 months such performance might well be not representative of the whole period.
[H] tells what proportion of the [L] sample of prior like-balance forecasts have earned gains by either having price reach its [B] target or be above its [D] entry cost at the end of a 3-month max-patience holding period limit. [ I ] gives the net gains-losses of those [L] experiences.
What makes KWR most attractive in the group at this point in time is its basic strength of reward to risk ratio of 2.1 to 1 in [T].
Further Reward~Risk tradeoffs involve using the [H] odds for gains with the 100 - H loss odds as weights for N-conditioned [E] and for [F], for a combined-return score [Q]. The typical position holding period [J] on [Q] provides a figure of merit [ fom ] ranking measure [R] useful in portfolio position preferencing. Figure 2 is row-ranked on [R] among alternative candidate securities, with KWR in top rank.
Along with the candidate-specific stocks these selection considerations are provided for the averages of some 3000+ stocks for which MM price-range forecasts are available today, and 20 of the best-ranked (by fom ) of those forecasts, as well as the forecast for S&P500 Index ETF ( SPY ) as an equity-market proxy.
Current-market index SPY is not competitive as an investment alternative with its Range Index of 51 indicating more than half of its forecast range is to the upside, with only 44/100ths of previous SPY forecasts at this range index produced profitable outcomes, with enough losers to put its average in below breakeven result in column [ I ].
As shown in column [N] of figure 2, those levels in comparison to their row forecasts [E] vary significantly between stocks. What matters is the net profit between investment gains and losses actually achieved following the forecasts, shown in column [I]. The Win Odds of [H] tells what proportion of the Sample RIs of each stock were profitable. Odds below 80% often have proven to lack reliability.
Price range forecast trends for KWR
Figure 3
blockdesk.com
No, this is not a "technical analysis chart" showing only historical data. It is a Behavioral Analysis picture of the Market-Making community's actions in hedging investments of the subject. Those actions define expected price change limits shown as vertical bars with a heavy dot at the closing price on the date of the forecast.
It is an actual picture of experienced market professionals expected future prices, not a simple hope of a recurrence of the past. These expectations are backed up by significant bets of investment capital made to protect market-makers or to earn a proprietary profit from risk-taking.
The special value of such pictures is their ability to immediately communicate the balance of expectation attitudes between optimism and pessimism. We quantify that balance by calculating what proportion of the price-range uncertainty lies to the downside, between the current market price and the lower expected limit, labeled the Range Index [RI].
In this structure a RI at zero indicates no further price decline is likely, but not guaranteed. The odds of 3 months passing without either reaching or exceeding the upper forecast limit or being at that time below the expected lower price (today's) are quite slight.
The measure of that balance is the Range Index (RI), now it is 7, where upsides are 13x the likely downside interim experience.
The market's actions of prior forecasts became accomplishments of +9.1% gains in 31 market days. So history's advantage could be repeated eight times or more in a 252 market-day year, which compounds into a CAGR of +103%. Its closest competitor's CAGRS are 40+% with much higher risk exposures.
The smaller low picture in Figure 3 shows the past 5 year distribution of Range Indexes with the current level visually marked. For KWR most of recent past forecasts have been of higher prices and Range Indexes, numerically in line with size of performance measures.
Conclusion
The multi-path valuations explored by the analysis covered in Figure 2 of prior Realized Payoffs [I], month and a half holding periods [J], Win Odds [H], and Odds-Weighted basis-points per day (21.4) [R] is rich testimony to the near-future value prospect advantage of a current investment in Quaker Chemical Corporation over and is far above the other compared alternative investment candidates.
For further details see:
Quaker Chemical: Specialty Chemicals, Today's Best Near Cap-Gain Stock Buy