VONE - Quality Check: Analyzing QDF's Dividend Strategy
Summary
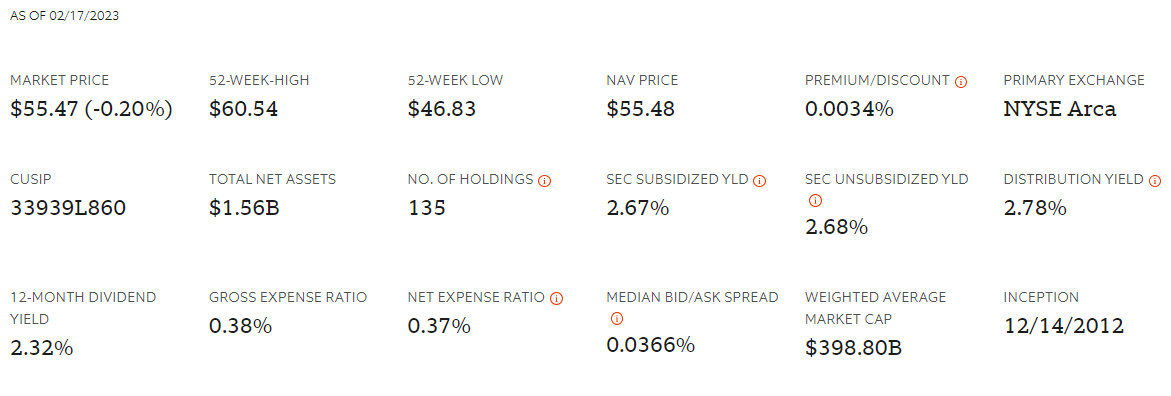
- QDF is a large-cap dividend ETF with a 2.31% dividend yield, 0.37% expense ratio, and $1.56 billion in assets under management.
- Delivering a sustainable yield is the primary investment objective. However, most peers deliver the same thing for less cost and risk. QDF was a poor performer over the last year.
- This article discusses QDF's strategy and compares its performance and fundamentals with other leading dividend ETFs, including VIG, DLN, and SCHD. In my view, these are better choices.
- Ultimately, I don't recommend buying QDF. It's costly, has a relatively low yield and low growth prospects, and hasn't demonstrated its strategy works well in over ten years.
Investment Thesis
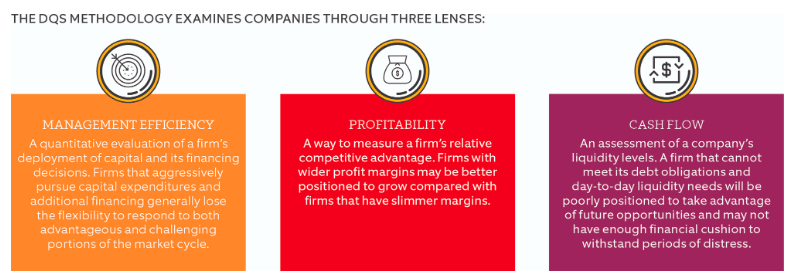
Today's article initiates coverage of the FlexShares Quality Dividend Index Fund (QDF). QDF seeks to provide a diversified portfolio of high-quality dividend-paying U.S. securities based on management efficiency, profitability, and cash flow. Over the last ten years, QDF has gained approximately 175%, underperforming peers like the WisdomTree U.S. LargeCap Dividend ETF (DLN). Based on this track record and my evaluation of its current fundamentals, it's not a compelling opportunity, and I recommend investors consider the other dividend ETF choices provided below.
QDF Overview
Strategy Discussion
FlexShares tracks the Northern Trust Quality Dividend Index, selecting from the Northern Trust 1250 Index, representing large- and mid-cap U.S. companies. After screening out non-dividend-paying stocks, each company is assigned a Dividend Quality Score based on management efficiency, profitability, and cash flow.
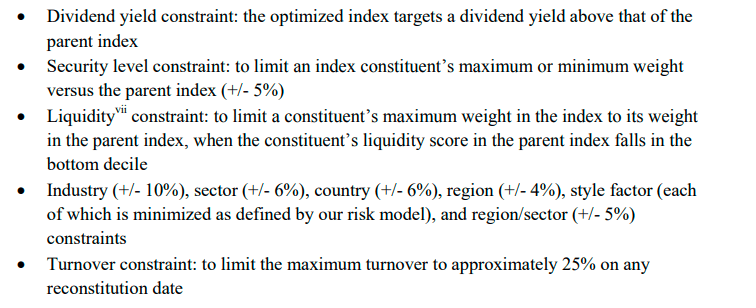
The methodology evaluates companies relative to their sector peers, ensuring an "apples-to-apples" comparison with no sector bias. After eliminating the bottom quintile in each sector based on Dividend Quality Scores, the Index diversifies to limit exposure to individual securities, industries, and sectors. The Index is also optimized based on the following constraints:
The Index aims for a "market-like" beta. Using the Russell 1000 as a benchmark, that means a five-year beta of around 1.02. That's unusual since large-cap dividend stocks are known for their risk-reducing features. However, FlexShares takes a sustainable yield, total returns approach instead of a yield-focused one. As noted, the target is a dividend yield above the parent Index, easily achieved after the first screen excluding non-dividend-payers.
QDF's expense ratio is 0.37%, which includes a 0.01% fee reimbursement effective until at least March 1, 2023. The following are some additional fund statistics listed on QDF's fund page. Highlights include 135 holdings, including cash and equivalents, a weighted-average $399 billion market capitalization, and a 2.32% trailing dividend yield. The 2.78% distribution yield listed is forward-looking and assumes the most recent quarterly payment will continue. The 2.32% figure is more relevant and supported by my analysis of QDF's current holdings.
Performance Analysis
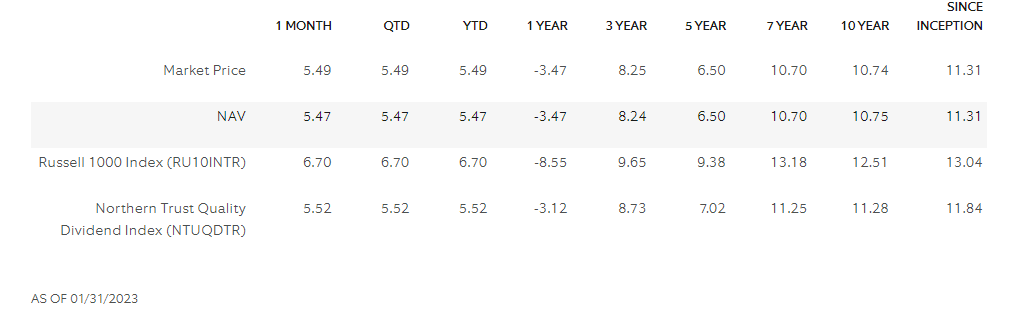
As of January 31, 2023, QDF gained an annualized 11.31% since its December 14, 2012, launch date. By comparison, the Russell 1000 Index gained 13.04%, 1.73% per year lower. Investors can track this benchmark Index with IWB and VONE , two funds with lower expense ratios.
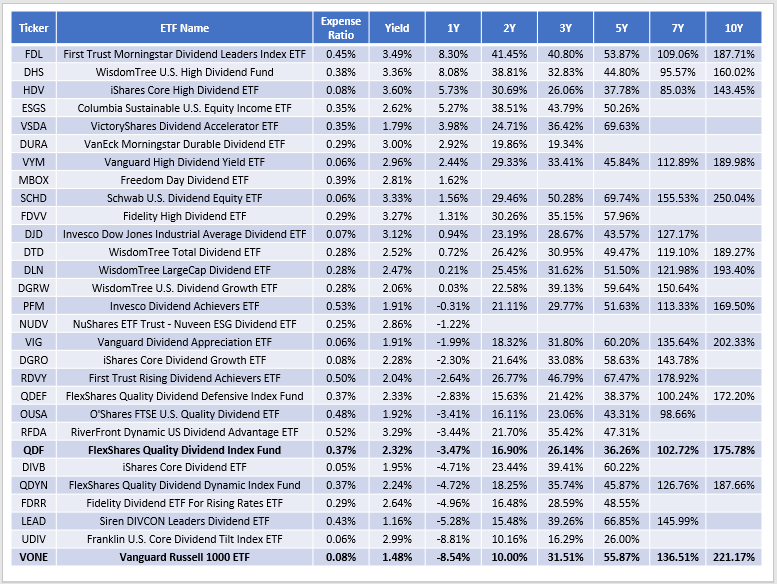
Dividend ETFs outperformed benchmarks like the Russell 1000 Index over the last year. The following table summarizes historical returns for 28 dividend ETFs, including QDF and VONE. All ETFs have a minimum $100 billion weight-average market capitalization.
In this sample, 20 ETFs outperformed QDF over the last year. QDF's 36.26% gain in the previous five years ranked #24/25, and its ten-year 175.78% return ranked #8/12. These results suggest the strategy isn't optimal.
I've witnessed this before with other quality-focused funds. Screening for quality is important, but not crucial and works best when applied to small-cap securities. Remember that most large-cap stocks are highly-profitable. Using Seeking Alpha Profitability Grades adjusted on a ten-point scale, scores range from 9.22/10 to 9.81/10 for the sample above. QDF's is 9.39/10, so it's average at best. It's something other funds achieve by simply using dividend consistency as the primary screen.
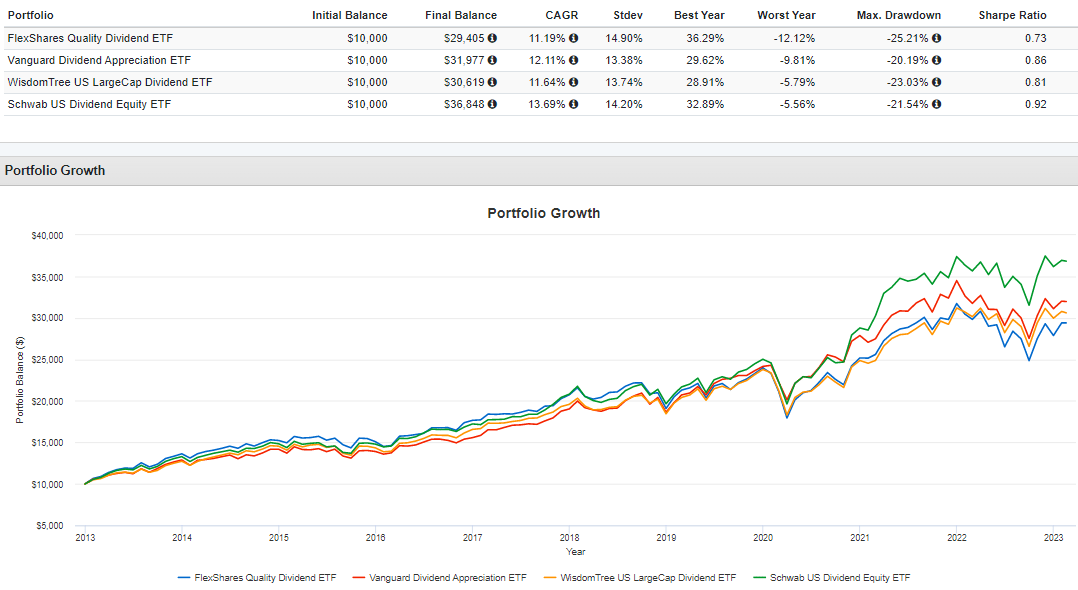
Another possible reason is QDF's "market-like" beta feature. As mentioned, this isn't necessarily a positive feature. Dividend ETFs often have lower volatility and lesser drawdowns. However, QDF's figures have been worse than VIG , DLN , and SCHD since its inception.
Finally, QDF's sector constraints may demonstrate a misconception about what investors want from the ETF. Investors desiring market-like exposure will first turn to low-cost funds like VONE. To satisfy other investment objectives, like earning a sustainable dividend yield, they'll consider dividend ETFs materially different from VONE. That's not the case here, as the Index optimization limits active sector exposure to 6%. As a result, the fund is structurally similar, with a relatively high 0.37% expense ratio.
QDF Analysis
Sector Exposures and Top Ten Holdings
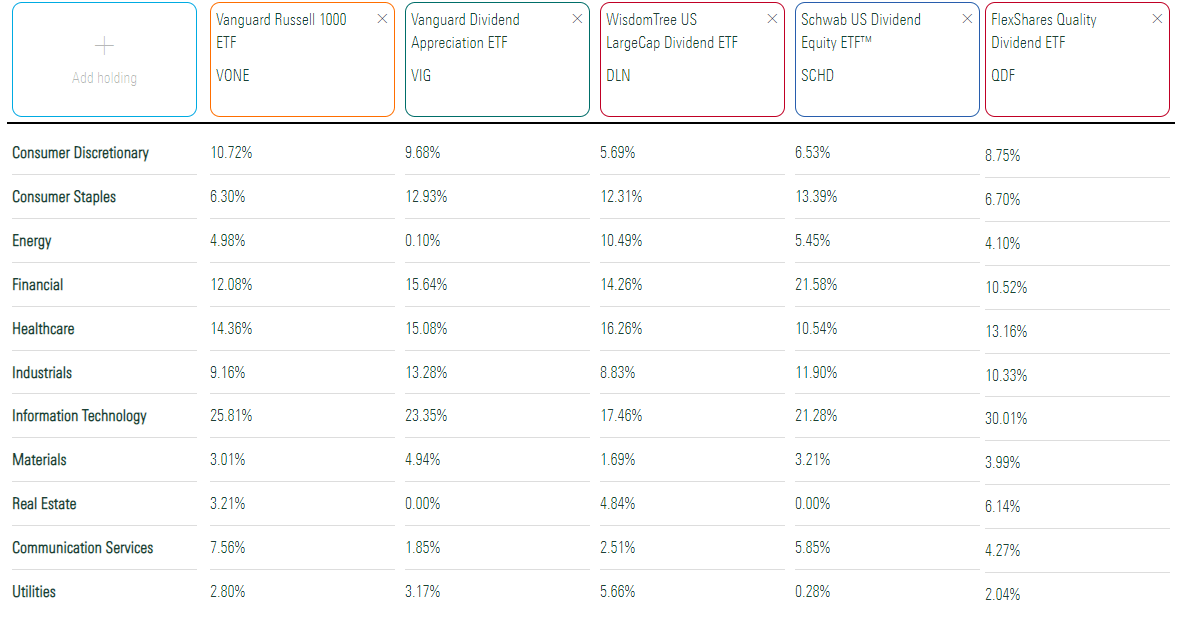
The following table highlights QDF's sector exposures alongside VONE, VIG, DLN, and SCHD. DLN is a close peer because its Index also calculates composite scores for dividend-paying securities. The critical difference is that it's better balanced across sectors. QDF's 30.01% exposure to Technology stocks is significant but drives down the portfolio's dividend yield.
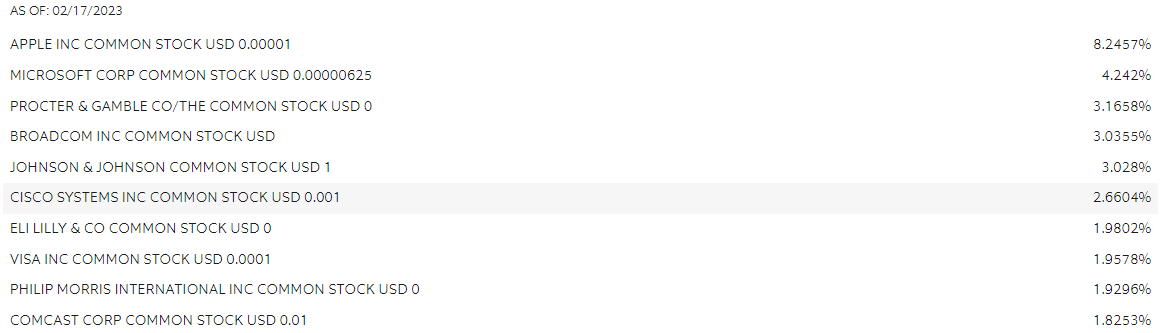
Apple ( AAPL ) and Microsoft ( MSFT ) contribute 12.5% of this Technology exposure and yield 0.60% and 1.05%, respectively. Others pay closer to 3%, including Broadcom ( AVGO ), Cisco Systems ( CSCO ), and Comcast ( CMCSA ). The following top ten holdings total 32.43%.
Fundamental Analysis By Industry
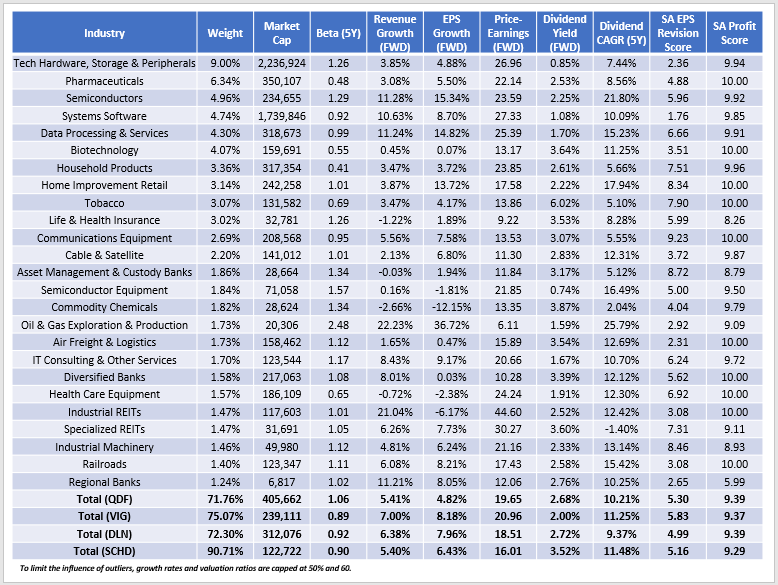
The following table highlights selected fundamental metrics for QDF's top 25 industries, totaling 71.76% of the portfolio. That's excellent diversification for a fund with 131 holdings. VIG and DLN have about 300, yet have lower industry diversification.
1. The Technology Hardware, Storage & Peripherals industry drives up the portfolio's volatility, suggesting that Apple's high weighting was applied primarily to achieve the market beta objective. Besides high profitability, the industry has few redeeming features for dividend investors. Components trade at a high 26.96x forward earnings, have a 0.85% forward dividend yield and have single-digit sales and earnings growth rates. Notice how VIG, DLN, and SCHD have five-year betas around 0.90. This figure is about average for the category and is one of the key draws.
2. As discussed, QDF's 9.39/10 profitability score isn't unique. DLN's is the same, and VIG and SCHD are close. Notice the correlation between size and profitability scores in the table. Generally, anything over $100 billion earns a high score.
3. QDF's estimated sales and earnings growth rates are approximately 5%, which is low based on these three comparators. High Technology exposure helps, but less than you'd think. QDF's 18 holdings in this sector have an 8.79% earnings growth rate, marginally better than VIG and DLN.
4. QDF trades at 19.65x forward earnings, not enough discount to justify the low growth rates. I recently expressed optimism about VIG based on its comparatively higher growth rates and solid earnings momentum, expressed through its 5.83/10 EPS Revision Grade. QDF doesn't stand out in this regard.
5. QDF's gross dividend yield is 2.68% or 2.31% after fees. DLN's expected net dividend yield is 2.44%, and SCHD's is 3.44%. There are also numerous other high-dividend ETFs to choose from, which I listed earlier in the performance analysis section. Furthermore, given the weaker sales and earnings growth rates, its constituents' 10.21% five-year dividend growth rate is unsustainable. It's not unique to QDF, but it's something to remember if making dividend income projections. Higher-yielding ETFs like SCHD give you an edge that could pay off five or ten years later.
Investment Recommendation
QDF's performance history is long enough to suggest its strategy has flaws. Its quality screens may be unnecessary for large-cap stocks, and its sector constraints and market-like beta mean QDF is too similar to simple, low-cost ETFs like those tracking the Russell 1000 Index. We've witnessed this recently, as QDF was one of the worst performers in its peer group over the last year.
QDF's expected 2.31% dividend yield is easy to find, and poor sales and earnings growth prospects suggest future dividend growth will be limited. I don't see many reasons to buy this relatively expensive ETF, and I believe most will find VIG, DLN, and SCHD as better alternatives. Thank you for reading, and I look forward to the discussion below.
For further details see:
Quality Check: Analyzing QDF's Dividend Strategy