VTV - QVAL: A Close Look At The Methodology
Summary
- Value investing is one of the oldest investment styles, and the original idea remains unchanged: cheap stocks tend to outperform expensive stocks on average.
- Despite weak performance from 2018 until recently, the underlying drivers of the value premium remain still valid and the factor enjoyed a comeback since late 2020.
- The Alpha Architect U.S. Quantitative Value ETF couldn't detach itself from the difficult value-period and has massively underperformed the S&P 500 benchmark since its inception in October 2014.
- QVAL also had problems within the value world. The ETF underperformed two simple academic value benchmarks from Kenneth French's website, and 7 other well-known value peers.
- Some of the underperformance could come from the fact that Alpha Architect does not consider more recent academic insights on value investing in some parts of their process.
After several articles about momentum and exchange-traded funds ("ETFs") to implement it, I will now take on the next big factor: value. As most of you probably know, value investing is one of the oldest investment styles available and, due to its long history, there are nowadays many different nuances of the original idea.
The Alpha Architect U.S. Quantitative Value ETF ( QVAL ) again offers a very active and differentiated implementation of value. Given that I started my series of momentum articles with Alpha Architect, I thought I would do the same with value. Obviously, I cannot compare the ETF to all other value funds simply because there are so many. So, if you think an important value-peer is missing, please comment the ticker so that I can incorporate it in future articles.
Value Investing - Idea and Evidence
Despite different nuances, the underlying idea of value investing has not changed over the years. Securities that look cheap tend to outperform securities that look expensive (versus some fundamental metric). Some value investors also talk about undervalued and overvalued securities, but the idea remains the same - value investing means buying cheap things and avoiding/shorting expensive things. Actually quite intuitive.
Historically (but not over the last 10-15 years), a portfolio that was long the cheapest-looking stocks and short the most expensive-looking ones earned significant returns in the U.S. and many other international equity markets. This well-researched phenomenon is known as the value-premium or the value-factor. Probably the most important study on the value premium comes from Fama & French (1992) , who not only document a significant value premium in the U.S. stock market, but also add it to their now well-known three factor model.
Because of the Fama-French methodology, the value factor became somewhat synonymous with the Book-to-Market ratio (B/M). In their paper, Fama and French simply defined stocks with a high B/M ratio (or if you take the inverse, low Price-to-Book multiples) as "value stocks." This is obviously just one rough proxy, and especially over the last years, using just the B/M ratio for value strategies has been strongly criticized in practice. Within large and diversified portfolios, however, the variable still captures a surprisingly large fraction of the value phenomenon.
At this point, it is important to understand that there are two general approaches to value investing. You can do it systematically (sorting stocks by fundamental valuation ratios and buy a diversified portfolio of the cheapest ones), or discretionary (studying companies in great detail and use as much information as possible to decide if it is undervalued). Executed properly, both approaches deserve their spot in the investment world. However, it shouldn’t come as surprise that I will exclusively focus on the systematic approach in this article.
How do Fama and French construct their value factor and what can we learn from it? Essentially, they just rank stocks by their B/M ratios and go long the cheapest 30% and short the most expensive 30% with monthly rebalancing and value-weighting. This long-short portfolio gives you the well-known value factor, also known as HML because you go long stocks with high B/M ratios and short those with low B/M ratios ("High Minus Low").
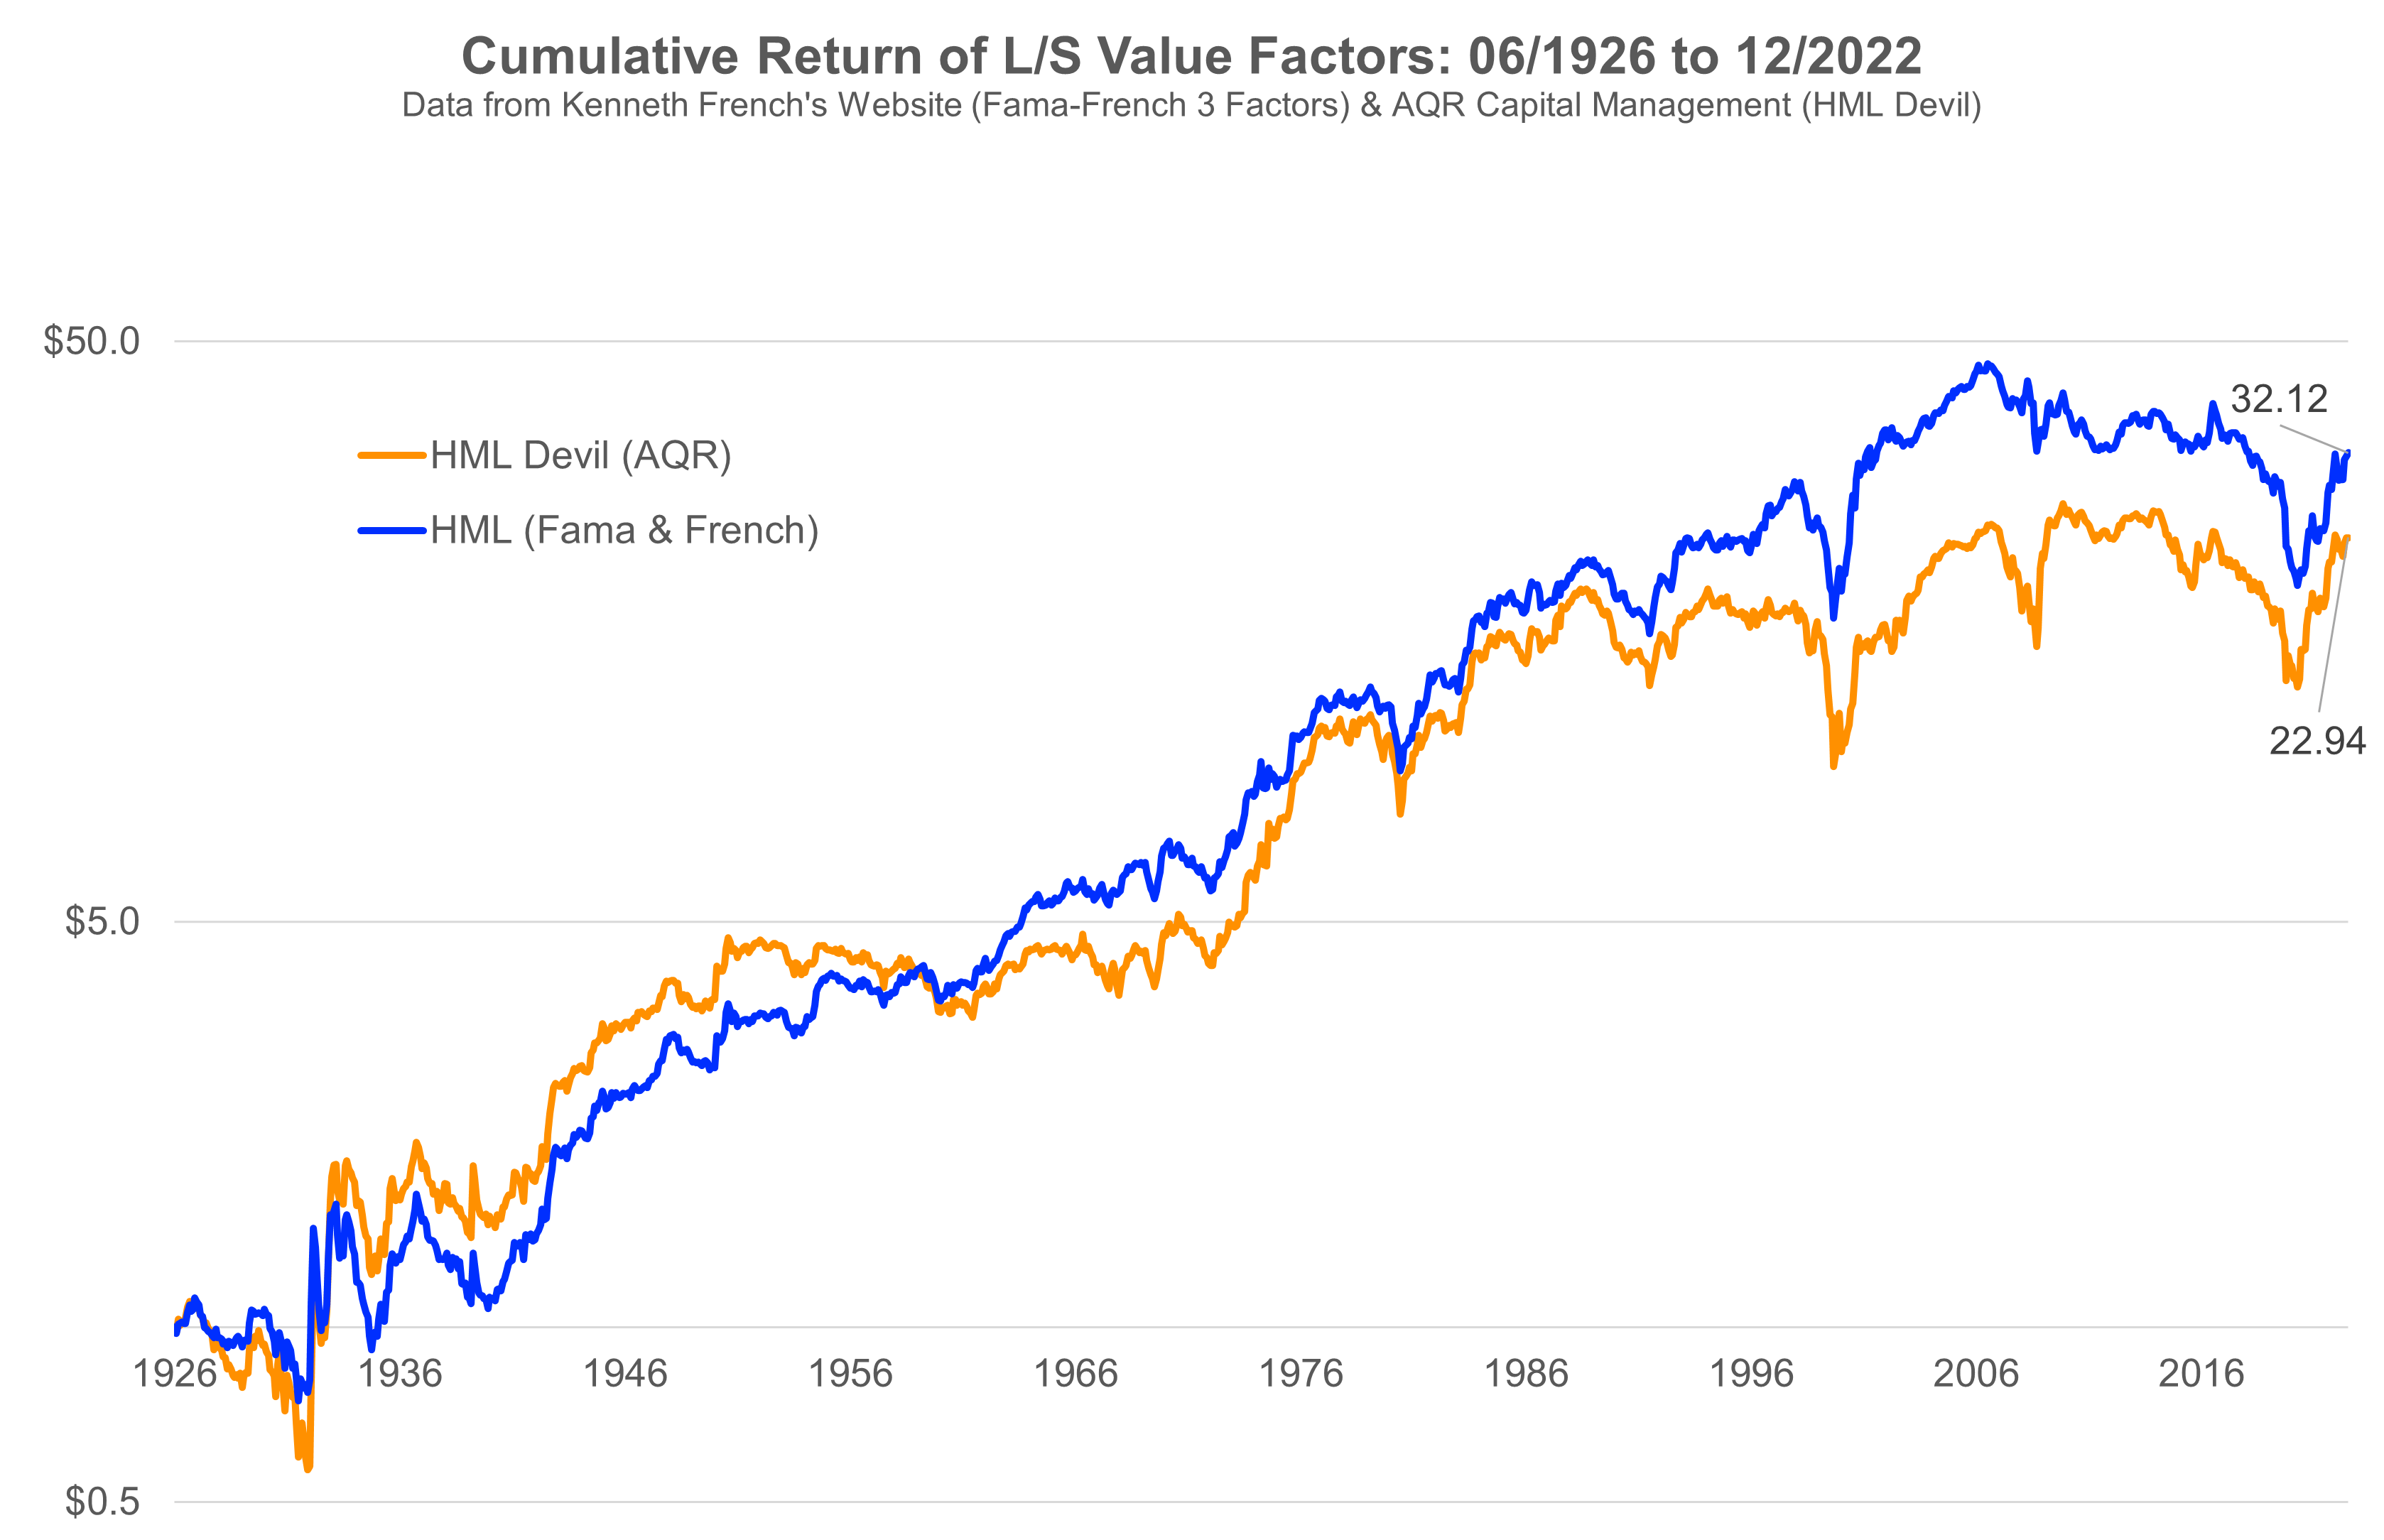
The following chart shows the long-term performance of the factor from July 1926 to December 22 for the U.S. stock market. I also included the AQR HML Devil factor, which follows the same methodology except that it calculates B/M ratios with a shorter and more realistic time-lag. The full methodological differences are summarized in an excellent research paper . For the moment, just think about the AQR factor as a more timely and, therefore, more practical implementation of the value factor. I mostly included it to show that the overall results are quite robust with respect to methodology.
Own illustration of data from Kenneth French's website and AQR Capital Management's data library. (Tuck School of Business and AQR Capital Management)
The chart clearly shows a significant value premium regardless of the methodology (also note that neither of the two is consistently better than the other). Over the last 90+ years, one dollar invested in the Fama-French HML and the AQR HML Devil factor turned into about $32 and $23, respectively. This corresponds to annualized returns of about 3.6% and 3.2%, respectively.
Although this sounds not very attractive compared to the U.S. stock market over the same period, please note that these are long-short portfolios which are mostly uncorrelated to the market. From this perspective, 3.6% per year are actually not that bad (we will come to long-only value later). Having said that, it is true that value is a much weaker factor than momentum. In my first momentum article , I have the same chart for the momentum-premium which stands at about 6% per year.
In addition to that, the out-of-sample performance of the value factor after the important Fama-French paper in 1992 is quite disappointing. You can also see it in the chart, but over the last 30 years since December 1992, the value premium for both methodologies was in the range of just 1.5 to 1.7% per year. While still uncorrelated to the overall market, this is really not too much and, more importantly, weaker than in the in-sample period of Fama and French.
As a consequence, systematic value investing has come under severe attack and has been questioned altogether. Especially the years 2018-2020 were very difficult as systematic value suffered its worst drawdown since 2001. However, there are still plausible reasons why systematic value investing is not a bad strategy and those with the guts to stick with it got rewarded over the last two years when the factor rebounded strongly. So let's see what’s behind it.
Note: The full details about value investing, the recent period, the current attractiveness of the factor, different methodologies, etc. are unfortunately beyond the scope of this article. I refer readers who are more interested to the outstanding blog and papers of Cliff Asness and his AQR-colleagues, other quantitative asset managers like Robeco , and (obviously!) to my own website .
Why did value “work” (and hopefully continues to do so)?
As with all other investment strategies, we should have an idea who is on the other side of the value trade. Even more important, we need plausible reasons why such a person should be willing to take a (long-term) losing bet. As for most other factors, researchers came up with various risk-based and behavioral theories. In the first case, the value premium is a compensation for some type of risk. In the second case, it arises from mistakes of non-value investors. The first paradigm is consistent with efficient markets, the second one is not. Asness et al. (2015) provide an excellent overview of the issue and the following paragraph is mostly based on this research. I also summarized the paper in a blog post on my website which might be interesting for readers who want more information.
The first risk-based theory for value is, quite unsurprisingly, the idea that cheap stocks are cheap for a reason and more likely to go through major distress. Holding such companies is thus more risky and the value premium is a compensation for that. Although plausible at first glance, the theory has two major problems. First , the value factor is much better after controlling for quality in the sense that "cheap quality" was historically better than "just cheap" or "just quality" ( Novy-Marx, 2015 ). So if you can hedge yourself against distress risk and still earn a value premium, it is unlikely that distress risk drives the premium in the first place. Second , out-of-sample tests also find value premiums among other asset classes like commodities ( Asness et al., 2013 ) and I think we all agree that it is quite difficult for a commodity to go bankrupt.
There is, however, one important risk-based theory remaining. While the idea of value seems surprisingly simple, it is fairly difficult to stick with the strategy. As the long-term chart above shows, value moved through prolonged periods of severe underperformance and until recently, value investors looked stupid over more than a decade in which the market heavily favored more expensive companies like the FAANGs (or whatever acronym you prefer). It is perfectly plausible that the value premium is a compensation for those investors who manage to live through such periods without giving up. Nobody likes to underperform for years and would do that without compensation.
Behavioral theories for value are largely centered around the well-documented pattern of investor overreaction ( De Bondt & Thaler, 1985 ). Through this mechanism, the idea is that some investors become too optimistic about expensive-looking stocks and too pessimistic about cheap-looking value stocks. Value stocks therefore become relatively underpriced and patient value investors profit from a delayed correction. Critics of such explanations (correctly) argue that they rely on the questionable assumption that investors don't learn from their own and previous generations’ mistakes. There is nothing to hold against that, however, I believe it is fair to doubt investors' ability to learn when comparing the period around 2000 with the meme-stock/crypto/NFT/non-profitable growth boom after the COVID crash in early 2020.
Bottom line: there is not only robust empirical evidence for a value premium but also plausible reasons why it exists. As long as you don't believe these reasons go away (value becomes a profitable strategy without any painful drawdowns and/or all investors suddenly become perfectly rational), the strategy deserves a spot in the investing tool-kit. Even if you don't want to invest in value directly, I think it makes at least sense to add a value component to the process. This is just common sense. If you buy a house, you also look at the price relative to houses with similar characteristics in the same area and all else equal, cheap is better than expensive.
After this long (but hopefully helpful) introduction to systematic value, I will now examine QVAL's implementation of the factor.
QVAL’s Implementation of Value
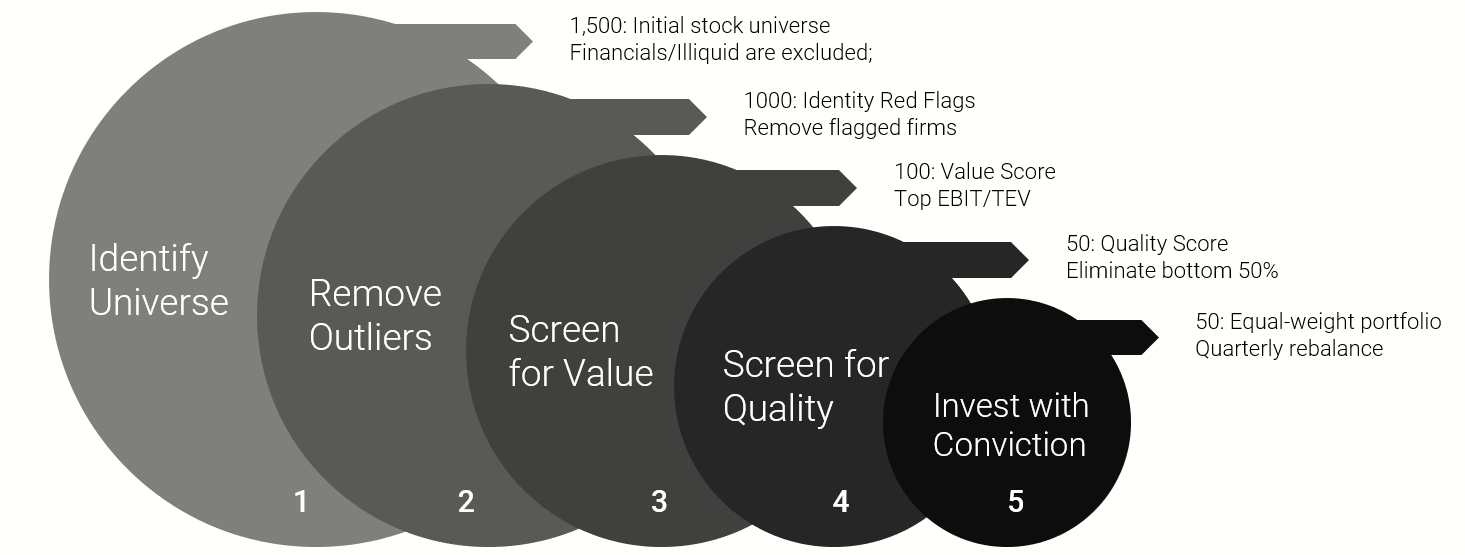
Similar as for their momentum strategies, Alpha Architect is extremely transparent with their value process. They outline their methodology in a comprehensive white paper/blog post , and I will summarize the most important points in the following section.
Alpha Architect Website "The Quantitative Value Investing Philosophy", 2014. All rights belong to Alpha Architect. (Alpha Architect)
The first step is quite self-explanatory. QVAL focuses on a broad universe of 1,500 U.S. stocks which meet certain criteria of liquidity. Importantly, the fund does not specifically target large or small caps. With respect to value, this is certainly helpful as value worked historically much better among small caps.
In the second step, they remove about 500 companies from the universe to, according to their website, "[...] eliminate those firms that risk causing permanent loss of capital." Specifically, they remove stocks with extremely high accruals and bad earnings quality, as well as those with low momentum, high betas, and extremely high valuations. I already mentioned my thoughts on such pre-filtering in the momentum methodology and my view has not changed. They certainly do it with good purpose and incorporating such a layer of risk management and data cleaning into a real-world process is definitely fine. However, I still don't know why you want to exclude stocks with low momentum and high beta from the universe of a value strategy because doing so essentially prioritizes the momentum and low-beta factor over value.
Step 3 is the heart of the process. In this step, Alpha Architect screens the pre-processed universe for the top 100 value stocks. Unlike Fama and French, they don't use the B/M ratio, but the EBIT/EV yield (the inverse of the EV/EBIT ratio). In their usual fashion, they cite a lot of research and plausible reasons for this particular choice. Nevertheless, I disagree with Alpha Architect at this point. EBIT/EV is certainly fine to capture a fraction of the value premium, but I doubt that something like "the best" value signal exists. There are so many choices (EV vs. market cap, trailing vs. forward, balance sheet vs. income statement vs. cashflow statement) and I am not aware of a thoroughly tested theory that prefers one multiple over all others. In such situations, it is therefore usually best-practice to use a composite of multiple signals to make the process as robust as possible. Again, Alpha Architect cites a lot of research for their choices and don't choose their multiple arbitrarily. But if I would have to do it, I would use a composite of multiple valuation ratios.
In theory, they could stop now as step 3 already yielded a selection of 100 cheap-looking value stocks. But Alpha Architect doesn't do that and further incorporate the important interaction between value and quality. Specifically, they use the well-known Piotroski (2000) F-Score to again rank their value-selection by fundamental quality metrics. The 50 value stocks with the highest fundamental quality are the final stock selection for the QVAL ETF.
Although again not arbitrary and backed by a lot of research, I also disagree with Alpha Architect at this point. Why? The sequential quality filter has one important drawback. It's absolutely possible that the value screen yields a list of cheap but crappy companies. Of course, it is then still better to again filter for the less-crappy companies. But from the perspective of the entire market, you may still be long “low-quality” and therefore bet against the quality premium while at the same time possibly diluting your value exposure. What to do about that? Fitzgibbons et al. (2017) show that it is better to first merge the signals and screen the universe thereafter. In English: don't screen for valuation and take the best quality among the cheap stocks, but look for the best overall combination of value and quality - don’t go to the scrapyard and look for the least crappy car, but look for a decently priced car that actually drives. On the other hand, by using such a methodology you already enter the more complicated multi-factor world and this may be the reason why Alpha Architect doesn’t do it in their pure value QVAL ETF.
In the final step, they combine their selection of 50 value stocks into an equal-weighted portfolio that gets rebalanced quarterly. There is not much right or wrong at this point because portfolio construction critically depends on how much active risk you want to take. Alpha Architect favors a very concentrated implementation with high active share. The rebalancing interval of 3 months is also fine as value is a much "slower" strategy and new fundamentals are only released quarterly anyway.
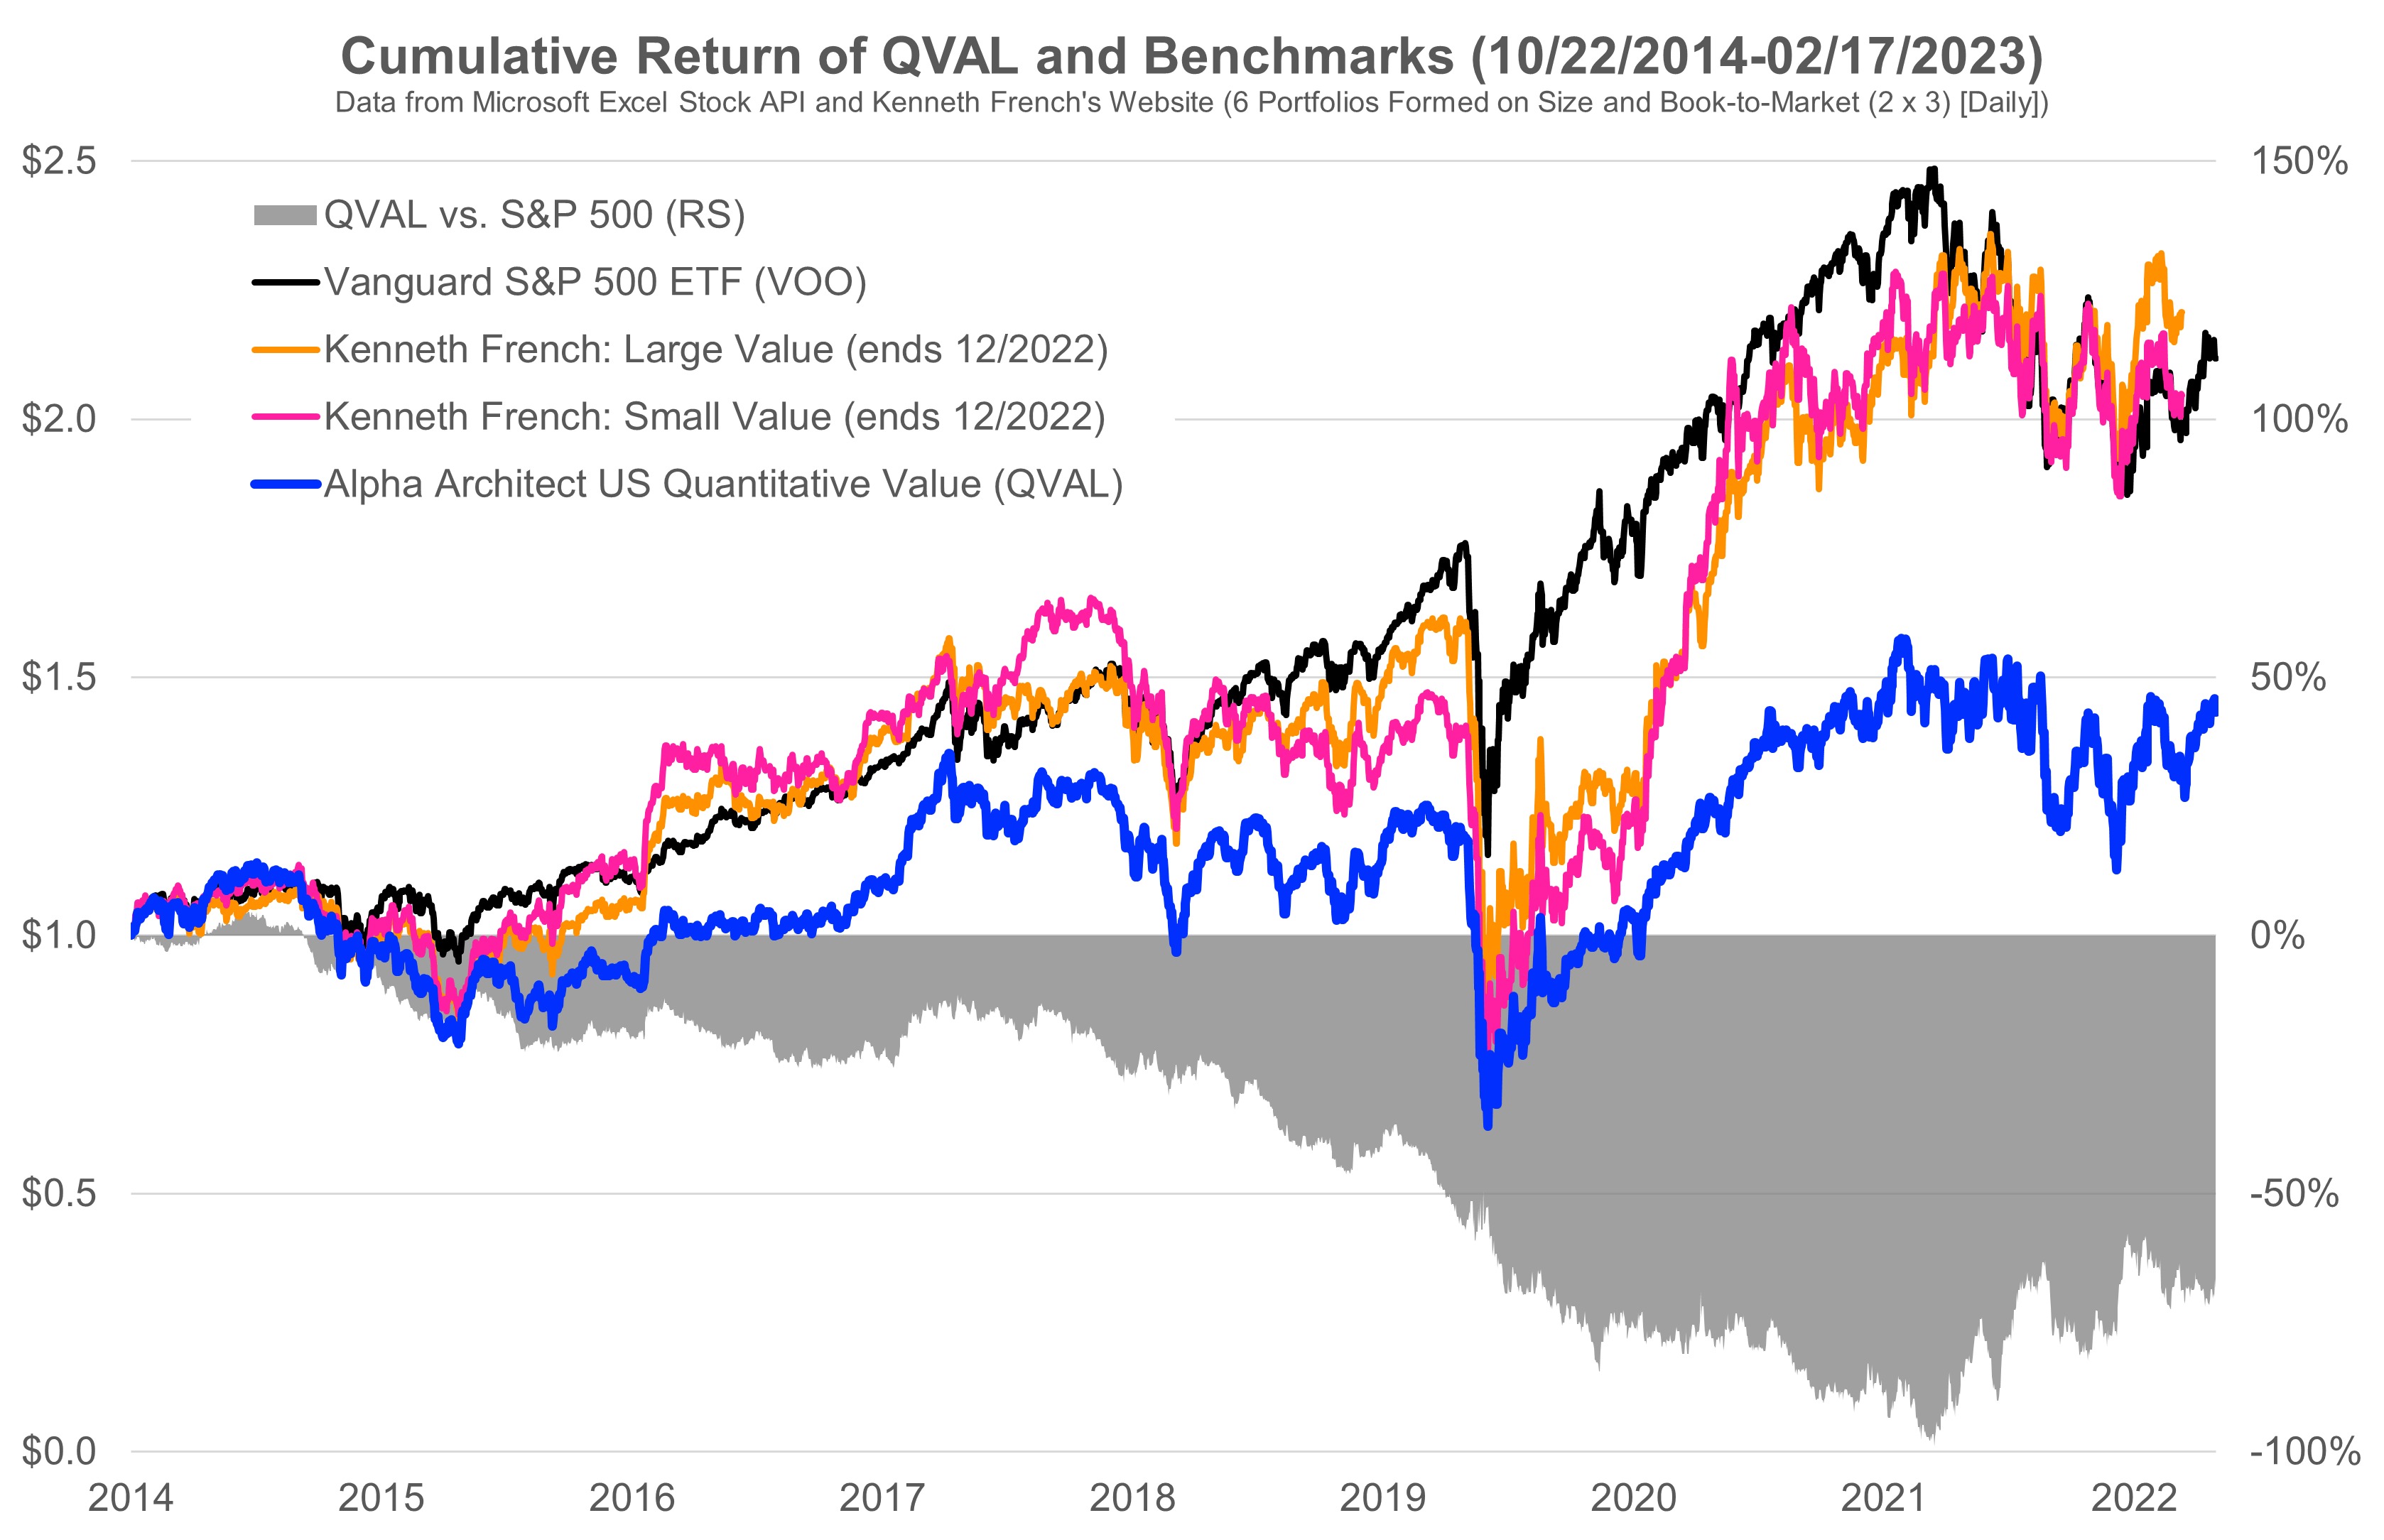
So far to the process, now let's look at the results in terms of performance. The following chart shows the cumulative return of QVAL, an investable S&P 500 benchmark and two long-only value portfolios (large and small) from Kenneth French's website.
Own illustration of data from Kenneth French's website and market data. (Tuck School of Business and Microsoft Excel Stock API)
First observation: QVAL massively underperformed the S&P 500 since inception in October 2014. The cumulative underperformance currently stands at about 70%-points and reached a trough at almost 100%-points in early 2021. This is very painful but not yet a reason to dismiss QVAL altogether. The ETF aims to deliver value exposure and for most of the last 3-5 years, systematic value was simply the wrong strategy. So let's turn to the academic benchmark from Kenneth French.
Unfortunately, the picture doesn't look much different. QVAL managed to hold pace with both portfolios up until 2018 but detached heavily since then. In particular, Kenneth French's value portfolios strongly rebounded in late 2020 and are now back on par with the S&P 500. While QVAL also reached its prior highs in the recovery, it didn't rebound nearly as strong and underperformed the simple and transparent value benchmarks massively. Arguably, some of the difference could be due to different rebalancing and weighting. The hypothetical value benchmarks are value-weighted and rebalance daily, which is of course unrealistic in practice. However, the cumulative returns of the value benchmarks are very similar with more realistic monthly rebalancing.
No matter how you look at it, the performance of QVAL was not satisfying. So let's see how it compares to other investable value funds or ETFs.
QVAL and Value-Peers
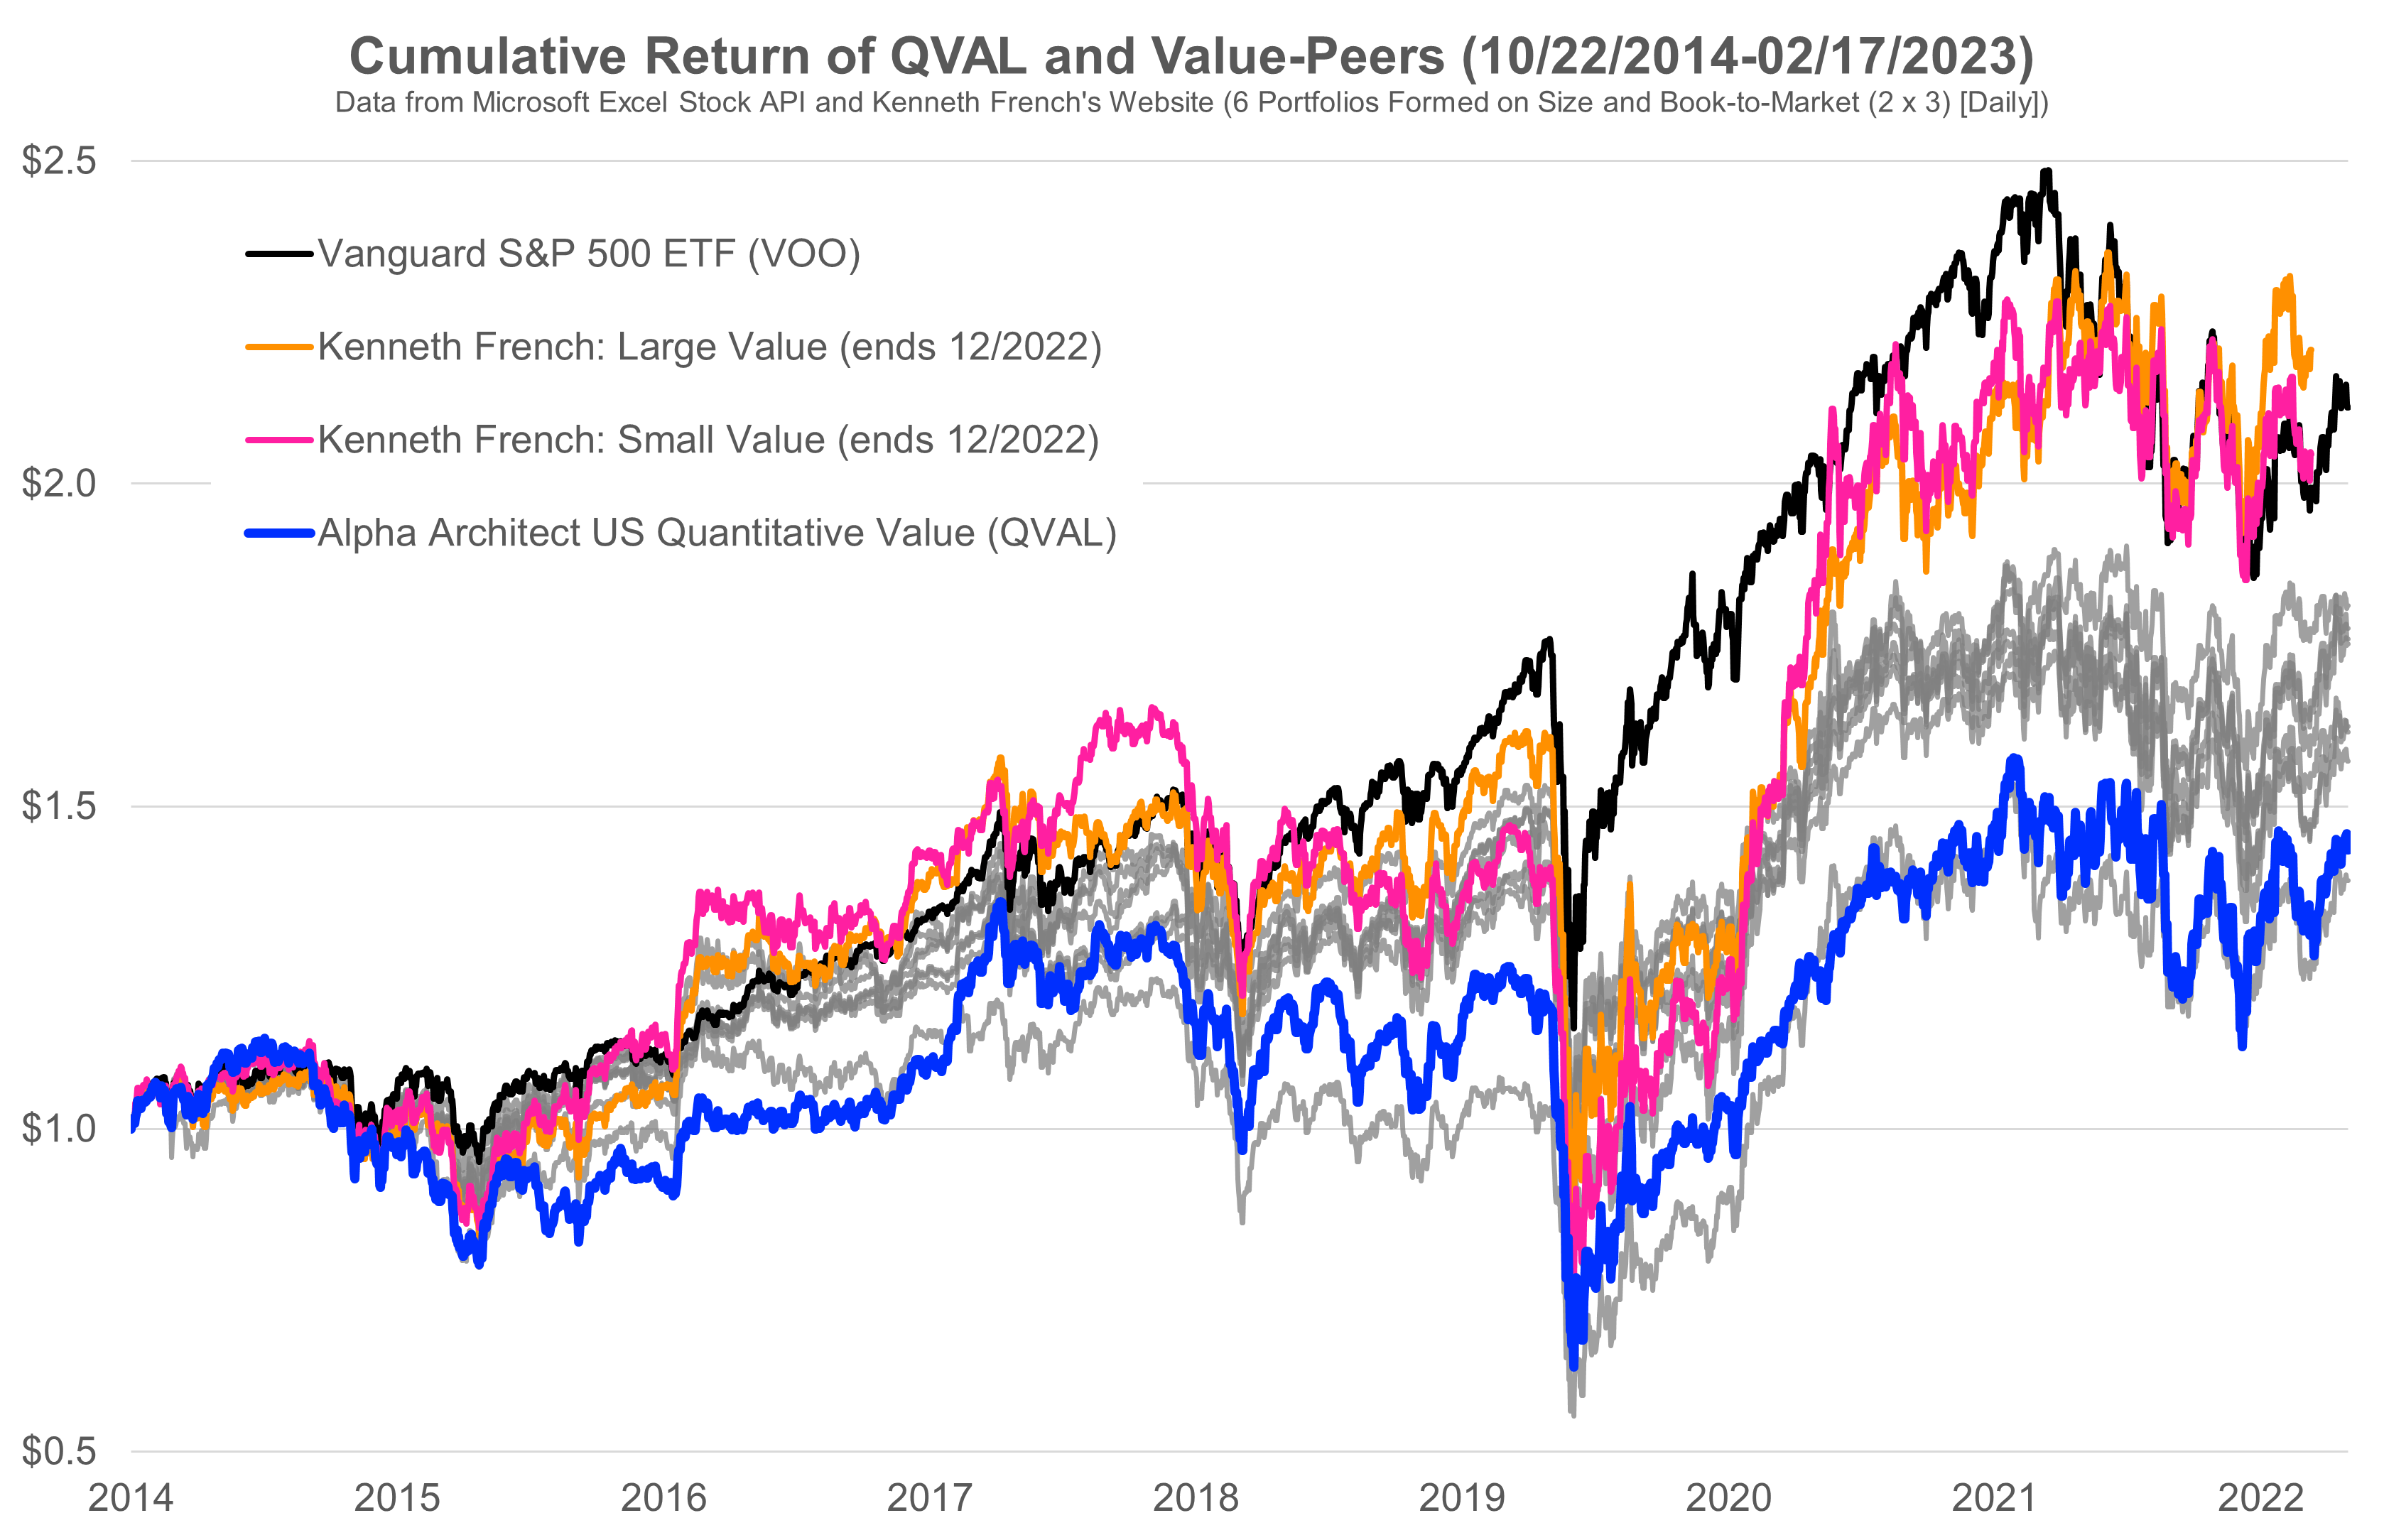
The following chart shows the same picture with a peer-group of eight different value funds ( VLUE , VTV , VBR , IVE , IWD , IWN , DFFVX , IUSV - as mentioned earlier: if you miss one, please comment). I haven't included them into the legend for brevity. The goal of this chart is to give you a broad overview where QVAL stands in terms of past performance, not a detailed comparison with one particular other fund.
Own illustration of data from Kenneth French's website and market data. Value-peers are VLUE, VTV, VBR, IVE, IWD, IWN, DFFVX, and IUSV. (Tuck School of Business and Microsoft Excel Stock API)
Similar to QVAL, none of the other value funds could detach itself from the underperformance of the factor and all of them thus lag the S&P 500 benchmark. More interestingly, and this was honestly not by intention, the entire value peer-group also underperformed the two academic value benchmarks. This is quite remarkable, given how simple and well-known Kenneth French's methodology is.
With respect to past performance, QVAL is the second-worst of the value peers (only the DFA US Targeted Value fund did worse), and this pattern is remarkably stable for the entire period since 2014. As you know from my articles on momentum, I have a lot of respect for Alpha Architect as a manager. For value, however, their methodology simply couldn't deliver the same performance as the simple academic benchmark, and a set of other investable value-peers.
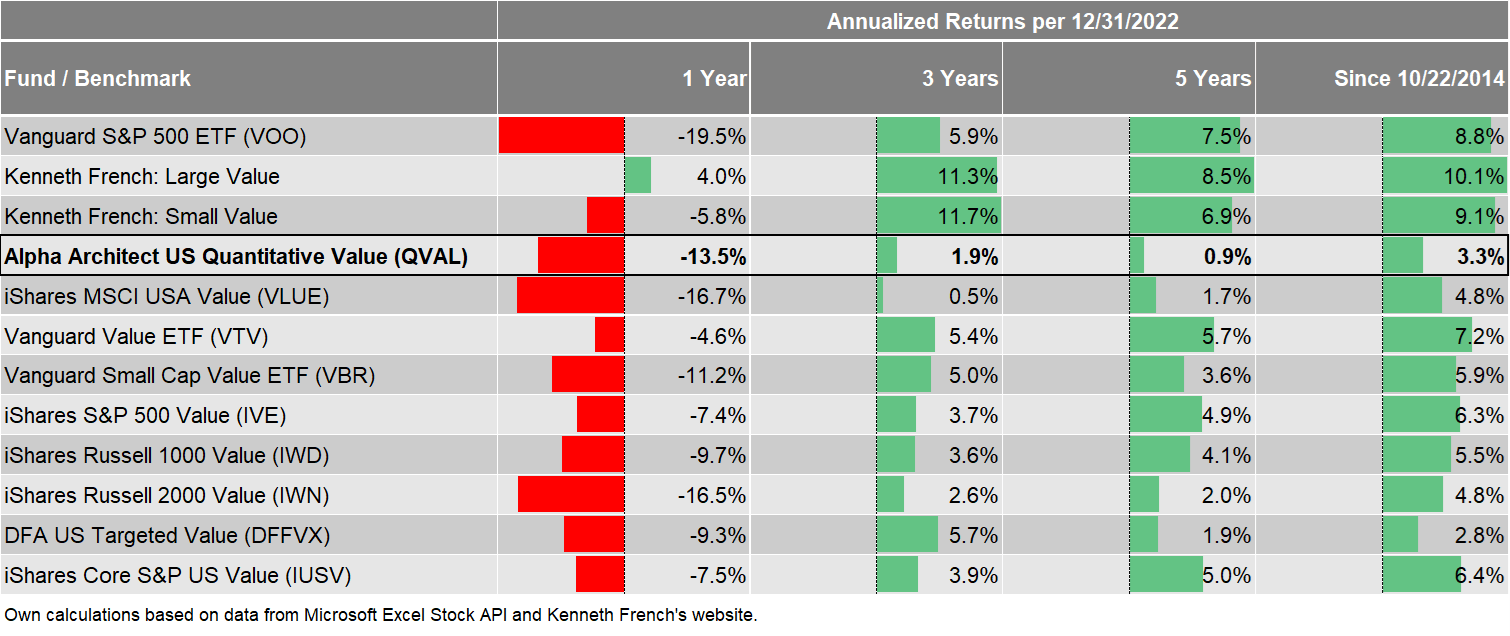
The table below summarizes this data again numerically and also includes returns for some other time frames. As you can see, the overall pattern doesn't change. QVAL performed consistently worse than the S&P 500, both academic value benchmarks, and also worse than most value-peers. Even within the generally underperforming value world, this is unlikely the performance investors have hoped for and there seem to be better alternatives for value than QVAL.
Data from Tuck School of Business and Microsoft Excel Stock API
Conclusion
For many of the last 3-5 years, value wasn't the place be, and the Alpha Architect U.S. Quantitative Value ETF is no exception from that. However, even within the underperforming value world, QVAL couldn't deliver. The ETF massively trails the S&P 500 index, the two simple academic value benchmarks from Kenneth French's website, and 7 of 8 investable value-peers.
A detailed analysis of this underperformance would require data on historical holdings which is beyond the scope of this article. However, there are several aspects in the investment process where I personally disagree with Alpha Architect.
- Removing stocks with extremely high betas and very low price momentum before the value ranking might be helpful risk management, but prioritizes the momentum and low-beta factor over value in a pure-value ETF.
- Using just one valuation ratio as value signal contradicts with more recent research which shows that composites of different signals are more robust.
- To the best of my knowledge, there is a consensus among practitioners that value rankings should be made intra-industry to foster apple-to-apple comparisons and avoid unintended industry bets. As far as I read it, Alpha Architect doesn't do that.
Based on these contradictions with the more recent insights from the literature on systematic value and the accompanying weak performance since inception, QVAL is currently not my favorite instrument to get exposure to the value factor. However, and this is important to me, disagreement is not an attack. Wes Gray and his team at Alpha Architect spent definitely more time researching value than I did. They also provide specific references and data for each of their choices in the QVAL process. Having said that, I just see too many deviations from the insights of more recent research and the processes of other, better performing, value managers. I still give the ETF a “Hold” rating because despite being not the best way to implement it, it could still benefit from a continuing value-recovery.
I don’t like to conclude with disclaimers, but there is an important one. The section on the QVAL process almost entirely comes from this blog post . It is dated on October 2014, however, according to a pinned tweet of Wes Gray, this is the most recent value investing philosophy. If there were any updates since then that addressed the issues above, I haven’t seen them and apologize accordingly.
For further details see:
QVAL: A Close Look At The Methodology