DFAT - QVAL: A Methodological Edge Over Most Value ETFs
2023-10-06 03:39:45 ET
Summary
- Alpha Architect U.S. Quantitative Value ETF is an actively managed fund excluding financials and uses TEV/EBIT as the main factor to identify undervalued stocks.
- The Fund is overweight in energy now, yet the sector breakdown may change along market cycles.
- QVAL has slightly outperformed the Russell 2000 Value Index since inception and has recently beaten other actively managed value funds.
QVAL strategy and portfolio
Alpha Architect U.S. Quantitative Value ETF ( QVAL ) is an actively managed fund launched on 10/21/2014. It has 50 holdings, an expense ratio of 0.39% and a trailing 12-month distribution yield of 2.28%. Dividends are paid quarterly. In the previous fiscal year, the portfolio had a high turnover of 89%.
The fund's strategy is inspired by the book Quantitative Value by Wesley R. Gray and Tobias E. Carlisle, published by Wiley in 2012. Dr. Gray is the chairman of the Trust managing the fund, and a founder of the fund's advisor Alpha Architect. The strategy is quantitative, rules-based, yet more flexible than for passively managed funds tracking value-style indexes.
As described in the prospectus, the fund " employs a multi-step, quantitative, rules-based methodology to identify a portfolio of approximately 50 to 100 undervalued U.S. equity securities with the potential for capital appreciation. "
Eligible stocks must trade in a U.S. exchange, have more than $1 billion in market capitalization, meet liquidity criteria and have at least 12 months of financial data. Financials, REITs and ADRs are excluded. Then, proprietary screens are used to eliminate companies with characteristics associated with financial distress and accounting manipulation. Cheap companies are identified based on a firm's total enterprise value divided by earnings before interest and taxes (TEV/EBIT). Secondary metrics like book-to-market, cash flow to price, and earnings to price may also be used. Finally, the cheapest stocks are filtered by screens focused on profitability, stability, and operational improvements. The portfolio is reconstituted on a periodic basis, at least quarterly.
Small cap companies represent about 64% of asset value per Fidelity classification. For this reason, I will use iShares Russell 2000 Value ETF ( IWN ) as a benchmark.
As reported in the next table, QVAL is cheaper than IWN regarding price/earnings, price/sales and price/cash flow. The difference in P/E is especially impressive.
| QVAL |
| IWN |
| Price/Earnings TTM |
| 5.33 |
| 9.33 |
| Price/Book |
| 1.6 |
| 1.23 |
| Price/Sales |
| 0.6 |
| 0.85 |
| Price/Cash Flow |
| 4.24 |
| 5.98 |
Source: Fidelity
It is a bit more expensive in price/book (P/B), which is not a concern. Despite being the original value metric of the Fama-French model, P/B adds some risk to value strategies. Historical data show that a large group of companies with low P/B has a higher volatility and deeper drawdowns than a same-size group with low price/earnings, price/sales or price/free cash flow. The next table shows the return and risk metrics of the cheapest quarter of the S&P 500 (i.e. 125 stocks) measured in price/book, price/earnings, price/sales and price/free cash flow. The sets are reconstituted annually between 1/1/2000 and 1/1/2023 with elements of equal weight.
| Annual Return |
| Drawdown |
| Sharpe ratio |
| Volatility |
| Cheapest quarter in P/B |
| 8.54% |
| -81.55% |
| 0.35 |
| 37.06% |
| Cheapest quarter in P/E |
| 10.71% |
| -73.62% |
| 0.48 |
| 25.01% |
| Cheapest quarter in P/S |
| 12.82% |
| -76.16% |
| 0.47 |
| 34.83% |
| Cheapest quarter in P/FCF |
| 15.32% |
| -74.77% |
| 0.61 |
| 27.03% |
Data calculated with Portfolio123
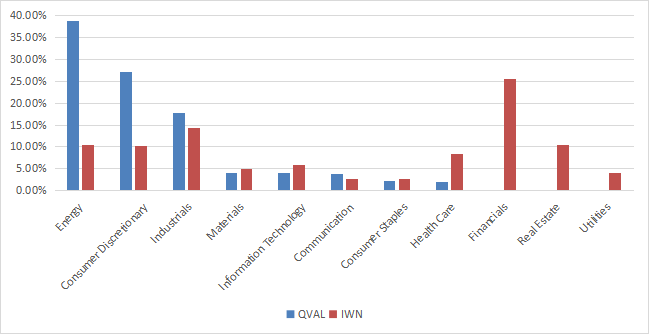
QVAL is overweight in energy (about 38% of assets). Then, come consumer discretionary (about 27%) and industrials (about 18%). Other sectors are below 5%. The sector breakdown may change over time. In my S&P 500 monthly dashboard , energy has been the most undervalued sector since February 2022, but it was overvalued a few months before. QVAL portfolio implicitly follows sector rotations from a value point of view. The biggest difference with the Russell 2000 value index is the absence of financials (IWN's top sector) and real estate, by definition of the strategy. QVAL also ignores utilities, probably eliminated by the screening process. This sector has a recurrent issue with cash flow and quality metrics, which are often bad (and possibly less relevant than in other sectors).
The portfolio is well diversified and risks related to individual stocks are low: the weights of the 50 constituents are between 1.79% and 2.28% as of writing. The top 10 holdings, listed in the next table with valuation ratios, represent 21.2% of asset value.
| Ticker |
| Name |
| Weight (%) |
| P/E TTM |
| P/E fwd |
| P/Sales TTM |
| P/Book |
| P/Net Free Cash Flow |
| Yield% |
| Steel Dynamics, Inc. |
| 2.28 |
| 6.21 |
| 7.18 |
| 0.88 |
| 2.07 |
| 6.52 |
| 1.60 |
| Macy's, Inc. |
| 2.18 |
| 4.27 |
| 4.12 |
| 0.13 |
| 0.75 |
| 24.18 |
| 5.76 |
| United Therapeutics Corp. |
| 2.14 |
| 12.55 |
| 11.19 |
| 5.20 |
| 2.03 |
| 16.56 |
| 0 |
| CONSOL Energy, Inc. |
| 2.11 |
| 4.62 |
| 4.62 |
| 1.25 |
| 2.48 |
| 7.18 |
| 4.50 |
| Mueller Industries, Inc. |
| 2.10 |
| 6.40 |
| 9.47 |
| 1.13 |
| 1.96 |
| 6.23 |
| 1.65 |
| UFP Industries, Inc. |
| 2.09 |
| 11.10 |
| 12.24 |
| 0.75 |
| 2.18 |
| 7.50 |
| 1.19 |
| Peabody Energy Corp. |
| 2.08 |
| 2.62 |
| 4.93 |
| 0.69 |
| 1.10 |
| 1.62 |
| 1.26 |
| Group 1 Automotive, Inc. |
| 2.08 |
| 5.54 |
| 5.76 |
| 0.21 |
| 1.41 |
| 19.34 |
| 0.70 |
| Hub Group, Inc. |
| 2.08 |
| 9.49 |
| 13.12 |
| 0.53 |
| 1.59 |
| 9.13 |
| 0 |
| Vishay Intertechnology, Inc. |
| 2.08 |
| 8.26 |
| 9.42 |
| 0.97 |
| 1.55 |
| 16.34 |
| 1.64 |
Since 11/1/2014, QVAL has outperformed IWN by a short margin and is behind the broader small-cap benchmark Russell 2000 ( IWM ). However, the three funds are in a narrow range of 72 bps in annualized return. The relative underperformance of value ETFs may not be representative of future returns. In this period, the value investing style has been lagging in a historic way.
| Total Return |
| Annual Return |
| Drawdown |
| Sharpe ratio |
| Volatility |
| QVAL |
| 58.11% |
| 5.27% |
| -51.49% |
| 0.3 |
| 23.13% |
| IWN |
| 56.19% |
| 5.13% |
| -46.08% |
| 0.3 |
| 20.98% |
| IWM |
| 66.12% |
| 5.85% |
| -41.13% |
| 0.34 |
| 20.28% |
Data calculated with Portfolio123
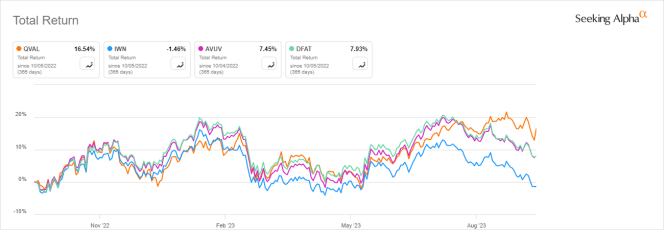
The next chart compares 12-month total returns of QVAL, IWN and two actively managed value ETFs:
- Avantis U.S. Small Cap Value ETF ( AVUV ),
- Dimensional U.S. Targeted Value ETF ( DFAT ), reviewed here .
QVAL has been the best performer in one year, but only due to the last 3 months. This is a bit short to call a winner. However, the three actively managed funds are clearly beating the index fund.
QVAL vs IWN, AVUV, DFAT, 12-month total return (Seeking Alpha)
Comparing QVAL with my Dashboard List model
The Dashboard List is a list of 80 stocks in the S&P 1500 index, updated every month based on a simple quantitative methodology. All stocks in the Dashboard List are cheaper than their respective industry median in Price/Earnings, Price/Sales and Price/Free Cash Flow. After this filter, the 10 companies with the highest Return on Equity in every sector are kept in the list. Some sectors are grouped together: energy with materials, communication with technology. Real estate is excluded because these valuation metrics don't work well in this sector. I have been updating the Dashboard List every month on Seeking Alpha since December 2015, first in free-access articles, then in Quantitative Risk & Value.
The next table compares QVAL performance since 11/1/2014 with the Dashboard List model, with a tweak: the list is reconstituted quarterly to make it comparable to QVAL strategy. The number of holdings is also comparable (50 to 100 for QVAL, 70 to 80 for the Dashboard List).
| Total Return |
| Annual Return |
| Drawdown |
| Sharpe ratio |
| Volatility |
| QVAL |
| 58.11% |
| 5.27% |
| -51.49% |
| 0.3 |
| 23.13% |
| Dashboard List |
| 80.07% |
| 6.82% |
| -41.49% |
| 0.38 |
| 19.38% |
Past performance is not a guarantee of future returns
The Dashboard List outperforms QVAL by about 1.5% in annualized return, and it looks safer regarding drawdowns and volatility. A note of caution: ETF performance is real, whereas the list is hypothetical and simulated without management fees and trading costs.
Methodological edge
Most value indexes have two methodological weaknesses, and QVAL avoids them (at least a part of them). The first one is relying too much on the price/book ratio. I have explained above why it is a risky metric. The main valuation metric of QVAL, TEV/EBIT, is a safer one.
The second weakness of usual value indexes is assessing all stocks with the same criteria. It means the valuation ratios are considered comparable across sectors and industries. Obviously, they are not: my monthly dashboard here shows how valuation and quality metrics may vary across sectors. A few ETFs have a more sophisticated approach, for example Fidelity Value Factor ETF ( FVAL ), reviewed here , and actively managed value funds like AVUV and DFAT. QVAL excludes financials, whose low valuation ratios are a big source of value traps. It also excludes real estate, where the usual ratios are irrelevant.
Takeaway
Alpha Architect U.S. Quantitative Value ETF is an actively managed fund picking stocks based on value and quality metrics. It excludes financials and real estate, where valuation ratios are unreliable, and uses TEV/EBIT as main value factor. It is currently overweight in energy, yet the sector breakdown may change along market cycles. QVAL track record is not exceptional, but it is promising. It has slightly outperformed the Russell 2000 Value Index since inception, and it has beaten actively managed value funds by Dimensional and Avantis in the last 3 months.
For further details see:
QVAL: A Methodological Edge Over Most Value ETFs