QYLD - QYLD: 2023's Tech Bull Run Left This Covered Call Strategy In The Dust
2024-01-02 09:20:52 ET
Summary
- QYLD, a covered call ETF, returned about half of what the Nasdaq 100 delivered in 2023.
- Implied volatility remains low on the Nasdaq 100, and the first quarter has historically featured higher volatility later in Q1.
- QYLD has a high concentration in top holdings like Apple and Microsoft, and its technical situation remains unimpressive.
- I highlight key price levels to monitor on the chart as the new year gets underway.
I was soft on tech heading into the second half of 2023. The outlook was based on a very strong rally through June last year, and the third quarter is notorious for its bouts of volatility and dashing gains from previous months. What's more, implied volatility on the Nasdaq 100 was very calm, so selling call options wasn't generating the same kind of income stream as was seen during the first handful of months in 2023.
Today, I reiterate my hold rating on the Global X NASDAQ 100 Covered Call ETF (QYLD). Following a year in which the fund returned about half of what the Nasdaq 100 delivered, investors may be wondering if this covered call strategy is still worth it. Implied volatility remains low, but the first quarter often brings about some bearish bouts as seen in Q3, according to history.
2023 total returns: QQQ +55%, QYLD +23%
According to the issuer, QYLD is an investment product that aims to generate income by engaging in covered call writing . This yield-focused strategy with a bent toward lower volatility compared to owning the QQQ outright has historically yielded higher returns during periods of market volatility, as noted by Global X . Being a covered call fund, investors should expect QYLD to do relatively well when the Nasdaq 100 trades sideways to modestly higher, particularly when implied volatility, or the cost of options, is high.
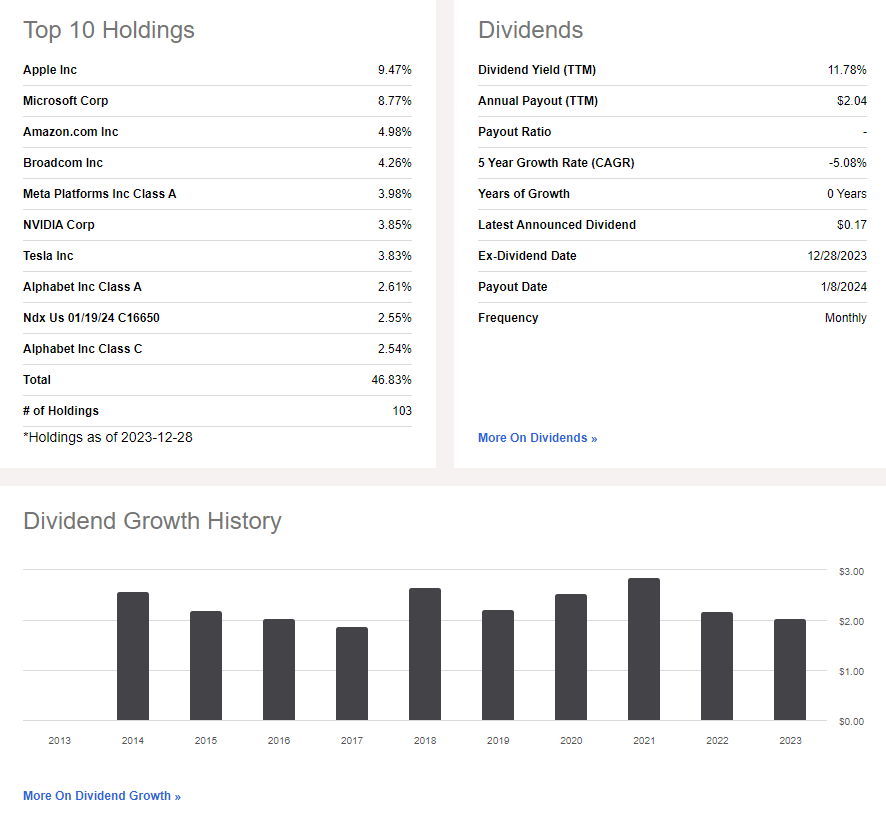
QYLD is a large ETF with $7.8 billion in assets under management and it pays a high 11.8% trailing 12-month dividend yield as of December 29, 2023. It's important to recognize that the yield is primarily generated from the ETF selling call options on the Nasdaq 100, not from a typical collection of company dividends.
Share-price momentum has been weak in the last several months while the ETF's 0.60% annual expense ratio is moderate. QYLD is considered a risky fund by Seeking Alpha's ETF Grades since it has a high concentration and tracking error is reportedly high, though I see it as a less risky product compared to owning the Nasdaq 100 outright. As you might expect, QYLD earns a high dividend grade for its double-digit yield.
Digging into the portfolio, the 3-star rated ETF by Morningstar plots at the top of the style box given its market-cap weighting structure. Holding some of the very biggest US tech stocks, half the fund is considered large-cap growth and there is just 12% exposure to mid-caps (no small-cap exposure).
Moreover, just 9% of the allocation is classified as value. With just a 3.6% total return over the second half of last year (+11.3% for the Nasdaq 100), the ETF has a price-to-earnings ratio of 22 while long-term earnings growth is solid at 11.3, so the PEG ratio of 2.0 is a bit pricey, but not outlandish.
QYLD: Portfolio & Factor Profiles
What makes QYLD somewhat risky is that 47% of its total assets are housed in the top 10 positions, with Apple (AAPL) and Microsoft (MSFT) commanding more than 18% of the ETF. Also take a look at the total dividend payouts by year - 2021 was the top-yielding year and last year's cumulative dividend amount dropped from 2022's total. If we see higher implied volatility this year, I would expect the total distribution figure to rise. As it stands, the CBOE Nasdaq 100 Volatility Index (VXN) is historically low at just 16.2.
QYLD: Portfolio Positioning & Dividend Data
Nasdaq 100 Volatility Near 4-year Lows
Seasonally, QYLD tends to perform in mediocre fashion through the first five months of the year, according to data from Equity Clock . The monthly positivity rate is 60% each in January, February, and March before returns turn a bit better in the second quarter. Still, January averaged a gain of just 0.3% and February featured an average loss of 0.1% with volatility sometimes persisting throughout much of March in the fund's history.
QYLD: Neutral to Slightly Bearish Season Risks Through early May
The Technical Take
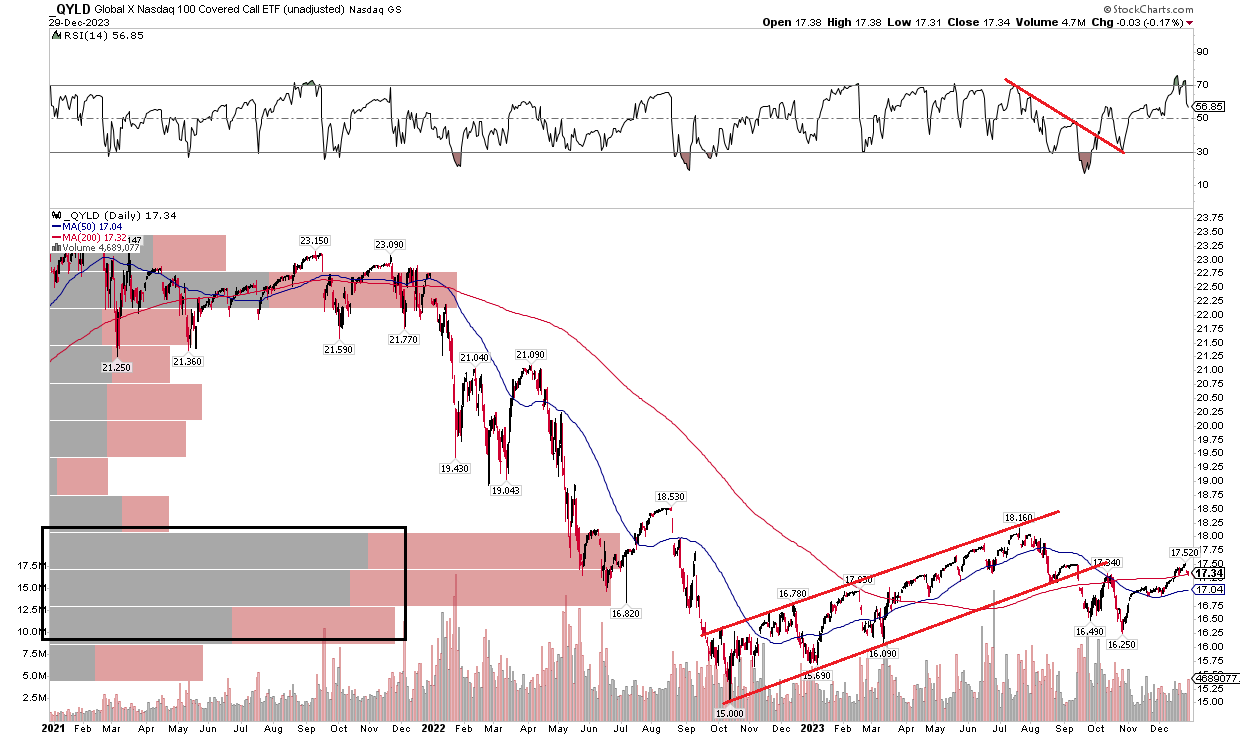
Readers know that I am less confident in technical analysis on high-yield products, particularly covered call funds. Still, investors remember what they paid for a security, so historical price and volume data still matter. Notice in the chart below that QYLD has not done much from a price-only perspective since late 2022 while the QQQ ETF has surged from its October 2022 low. Back in June last year, I noted that a key uptrend support line was in play, and that monitoring it would be important for future price action. That upward trend channel proved to falter, and momentum fell over the back half of 2023. Today, shares are bouncing around the long-term 200-day moving average, though the RSI momentum gauge at the top of the graph is actually at a strong level after breaking through a downtrend line back in Q4.
With a high amount of volume by price in the $16 to $18 zone, it may be tough sledding for the bulls to get the fund through this area of high congestion. If the ETF can rally above the July peak of $18.16, however, there are not many shares traded until you get to about $22.50. Another encouraging data point is that the 200dma has turned higher, but I would like to see the short-term 50dma rise above the 200dma to help confirm some upside price strength.
Overall, the technical situation remains unimpressive, and investors are not collecting a very high yield right now given low implied volatility in the Nasdaq 100.
QYLD: Improved Momentum, But Neutral Trends Following A Lackluster 2H23
The Bottom Line
I reiterate my hold rating on QYLD. The Nasdaq 100 outperformed this covered call strategy sharply last year, and I do not see enough definitive signs to suggest the trend will change.
For further details see:
QYLD: 2023's Tech Bull Run Left This Covered Call Strategy In The Dust