ETV - QYLD And ETV: Appealing Plays For Income-Focused Investors
2023-12-07 16:59:33 ET
Summary
- Call-writing funds, such as the Eaton Vance Tax-Managed Buy-Write Opportunities Fund (ETV) and Global X NASDAQ 100 Covered Call ETF (QYLD), offer higher distributions to investors.
- ETFs like QYLD have lower expense ratios and are passively managed, while CEFs like ETV can trade at discounts/premiums and have a more active management approach.
- Both funds write index options and have a tech tilt, but ETV also incorporates exposure to the S&P 500 Index.
Written by Nick Ackerman, co-produced by Stanford Chemist.
Call-writing funds are designed to provide substantially higher distributions to investors by collecting options premiums from their underlying portfolios. There are a plethora of option writing funds available these days, both in closed-end fund and open-end fund forms such as exchanged traded funds. CEFs and ETFs, while having similarities such as pooling investments together in one package, also have distinct differences.
One of the primary advantages of ETFs would be that they tend to have much lower expense ratios. Any fee that isn't paid to management is retained by the fund; thus, returns can be higher. However, they also tend to be passively managed, which is one of the reasons their advisory fees are significantly lower.
On the other hand, CEFs can often trade at wild discounts/premiums that investors can look to exploit. ETFs can be a great place to put capital to work when CEFs are richly priced. CEFs also generally take a more active management approach. That can lead to either better or potentially worse results, depending on the success of the management team.
When there is enough demand, new shares can be created and can grow assets for an ETF. With closed-end funds, they are "closed" in that creating new shares isn't a fluid process of just having an authorized participant create more. Instead, they can 'grow' AUM, but it is through at-the-market offerings, rights offerings or dividend reinvestment plans.
Two of these funds that I wanted to take a look at today carry a similar strategy, which would be the Eaton Vance Tax-Managed Buy-Write Opportunities Fund ( ETV ) and Global X NASDAQ 100 Covered Call ETF ( QYLD ). They both write index options, which are a bit different from writing covered calls on individual positions. They also both have a tech tilt being oriented toward the Nasdaq 100, with that being suggested right in QYLD's name.
Each of these funds tends to be quite popular vehicles in the income space, and I believe they can both be worth investing in for that purpose.
The Basics
ETV
- 1-Year Z-score: -1.03
- Discount: -5.46%
- Distribution Yield: 9.26%
- Expense Ratio: 1.08%
- Leverage: N/A
- Managed Assets: $1.5 billion
- Structure: Perpetual
ETV's investment objective is to "provide current income and gains, with a secondary objective of capital appreciation." To achieve this, the fund will invest "in a diversified portfolio of common stocks and writes call options on one or more U.S. indices on a substantial portion of the value of its common stock portfolio to seek to generate current earnings from the option premium."
QYLD
- Dividend Frequency: Monthly
- Dividend Yield: 12.65% (SEC yield 0.32%)
- Expense Ratio: 0.60%
- Leverage: N/A
- Managed Assets: $7.71 billion
- Structure: Passive ETF
QYLD's investment objective is to "seek to provide investment results that correspond generally to the price and yield performance, before fees and expenses, of the Cboe Nasdaq-100 BuyWrite V2 Index." The strategy is quite simple, "the fund buys the stocks in the Nasdaq 100 Index and "writes" or "sells" corresponding call options on the same index."
Similarities And Differences
It is important to note that the difference between the trailing twelve-month dividend yield and the SEC yield is significantly different because the SEC yield only reflects the income generated from the underlying holdings. While option premiums are often called "income," that isn't technically true. They are really capital gains and, therefore, would not be included as "yield," but it would be more technically correct to call it a distribution yield.
Though ETFs, even call writing ETFs, generally still just get referred to as paying "dividends." That is reflected for ETV, which it is more commonly known that CEF payouts are referred to as distributions.
Both funds write options that are a month or less out. QYLD writes at-the-money options, while ETV writes options that are just out-of-the-money. Writing options at-the-money means that upside is essentially capped immediately; ETV has a little bit more wiggle room here, but even their options are only around 4.6% out-of-the-money. During a strong rising market, that means both of these funds will underperform just a straight benchmark such as the Invesco QQQ Trust ETF ( QQQ ). However, if you're interested in ETV and/or QYLD, you're probably here for the significantly higher monthly distributions that they can offer income-oriented investors.
Neither fund employs any leverage in the form of borrowings when implementing their strategies. However, it's important to note that when writing index options, you can't technically own an index directly. Therefore, they technically write naked calls, and the theoretical loss could be infinite. In practice, though, the underlying portfolios being so closely aligned with the index means that indirectly, they are going to be covered by those theoretical infinite losses.
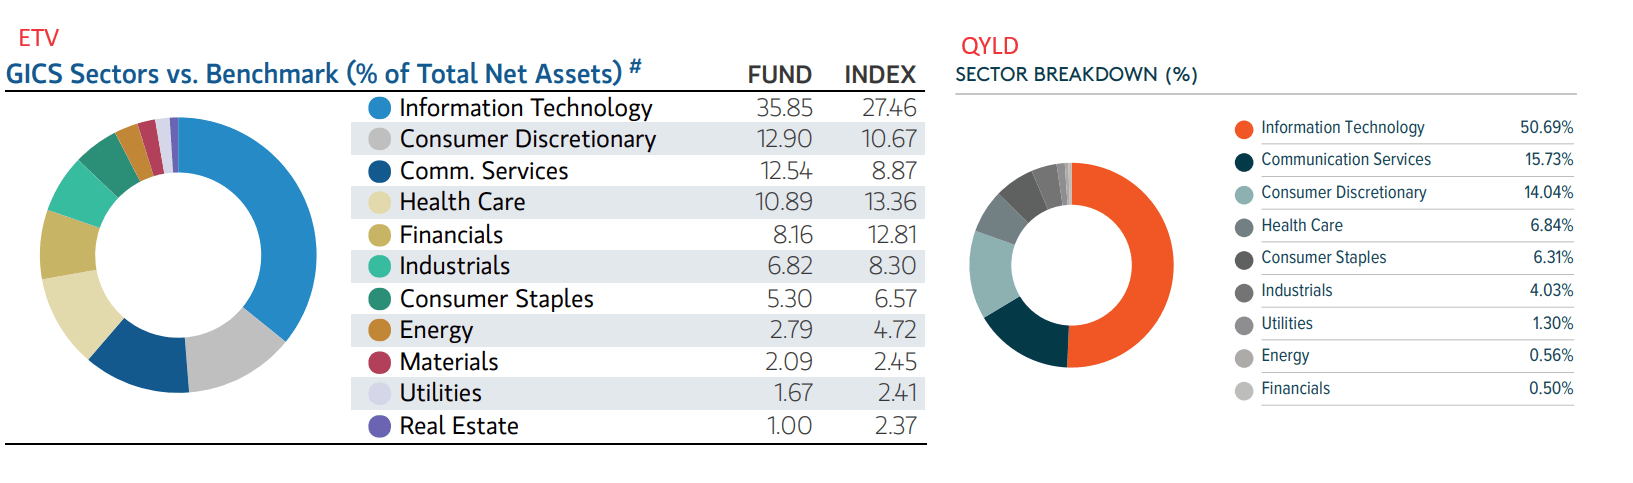
Finally, while the funds share significant overlap in holdings, ETV has a bit less of a tilt toward tech, relatively speaking. This is because the fund also incorporated some S&P 500 Index exposure as well. That said, these days, even the S&P 500 Index is being dominated by the mega-cap tech names.
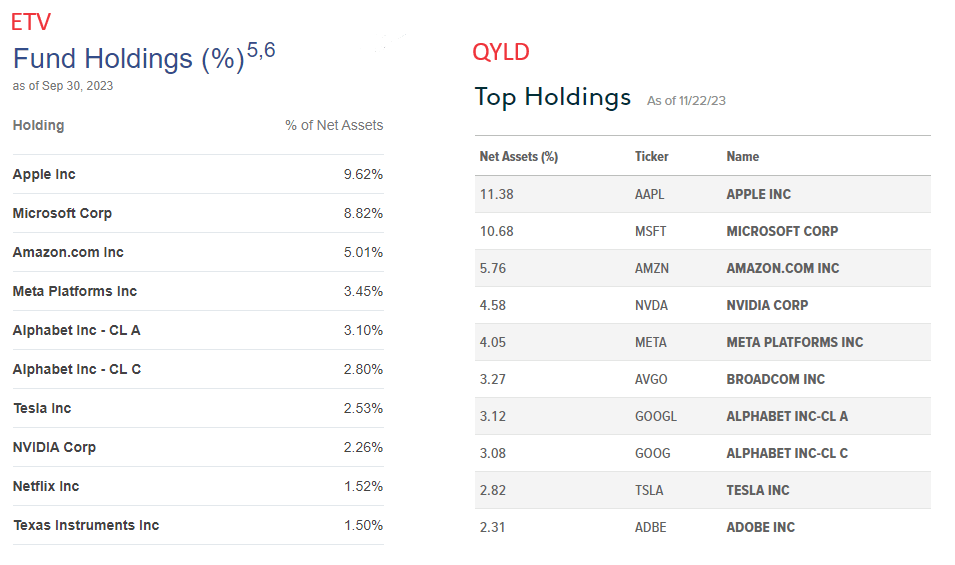
The top ten holdings shown below are from two different dates, but the general idea is still there: massive overweight toward the Magnificent 7 names but more specifically, Apple ( AAPL ), Microsoft ( MSFT ) and Amazon ( AMZN ). These three make up almost 23.5% of ETV and nearly 28% of QYLD. NVIDIA ( NVDA ), with its massive move higher through 2023, has meant a big push higher in terms of weighting as well. That's been more reflected in the Nasdaq 100 and, therefore, QYLD over the S&P 500 currently. However, it is still becoming a more substantial position.
Another way to see more easily that ETV is a bit less tech-heavy than QYLD is by looking at the sector breakdowns of each.
Performance Comparison
Despite the difference in the fund's weightings, both have put up incredibly similar results over the long term. This performance period is just under a decade because QYLD's inception was on December 11, 2013.
YCharts
While the call-writing strategy means the rises aren't as sharp when in a bull market, it also should mean being slightly more defensive in a bear market. 2022 was a perfect example of seeing this play out. The QQQ ETF faced significant pressure, and ETV and QYLD also saw some deep losses, but they were meaningfully lower. Of course, this comes directly from collecting the options premiums that directly offset the losses from the underlying portfolio.
YCharts
What would make ETV look like the better buy these days is going back to the discount/premium mechanic that is a part of the CEF structure. ETFs can trade at discounts/premiums as well, but it generally isn't to a meaningful degree.
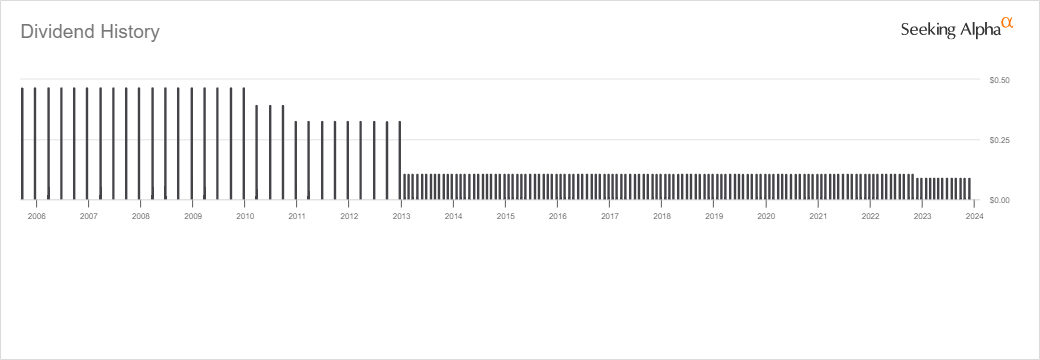
Here, ETV had been trading at a premium, but that was given up when they cut their distribution last year. ETV paid a steady monthly distribution, and that was one of its appealing features.
YCharts
High Distributions Yields And Tax-Deferred
When they cut their payout, that drove investors away, and it traded at a deep discount relative to its history. It has clawed back some of that discount now, but it remains attractive. Currently, the fund pays out a 9.26% distribution rate, and against its NAV, that works out to 8.75%
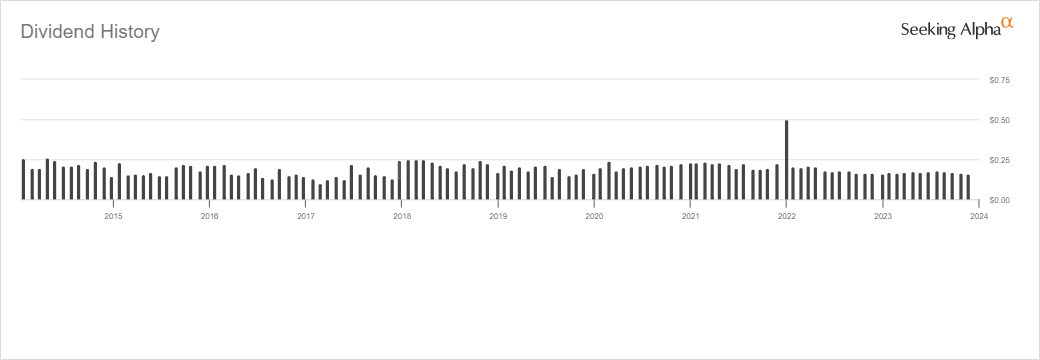
In the ETF wrapper, the monthly distribution is different every month, but investors are willing to accept that because it's the way they've always worked. The TTM rate here is 12.65%, but the current distribution yield based on the last payout works out to 11.52%.
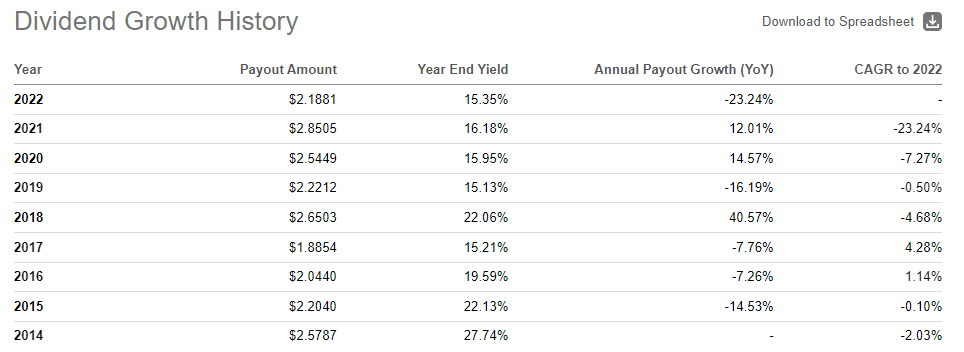
If we want to get into more details on that, then QYLD technically 'cut' its distribution as well. During 2021, the fund paid out $2.8505 in distributions, but then in 2022, it paid out $2.1881. That was a decline of -23.24% year-over-year. 2021 did see an unusually large distribution paid in the last month. However, even when comparing to 2020's $2.5449, it would have been a reduction from that as well.
As we've made our way through 2023, volatility has been incredibly low and that has meant less option premium coming in. Therefore, it's unsurprising to see QYLD's distribution trending lower and lower as we move through this year. We don't see that monthly change for ETV because they've implemented a managed distribution policy whereby they attempt to keep it at a level payout for extended periods.
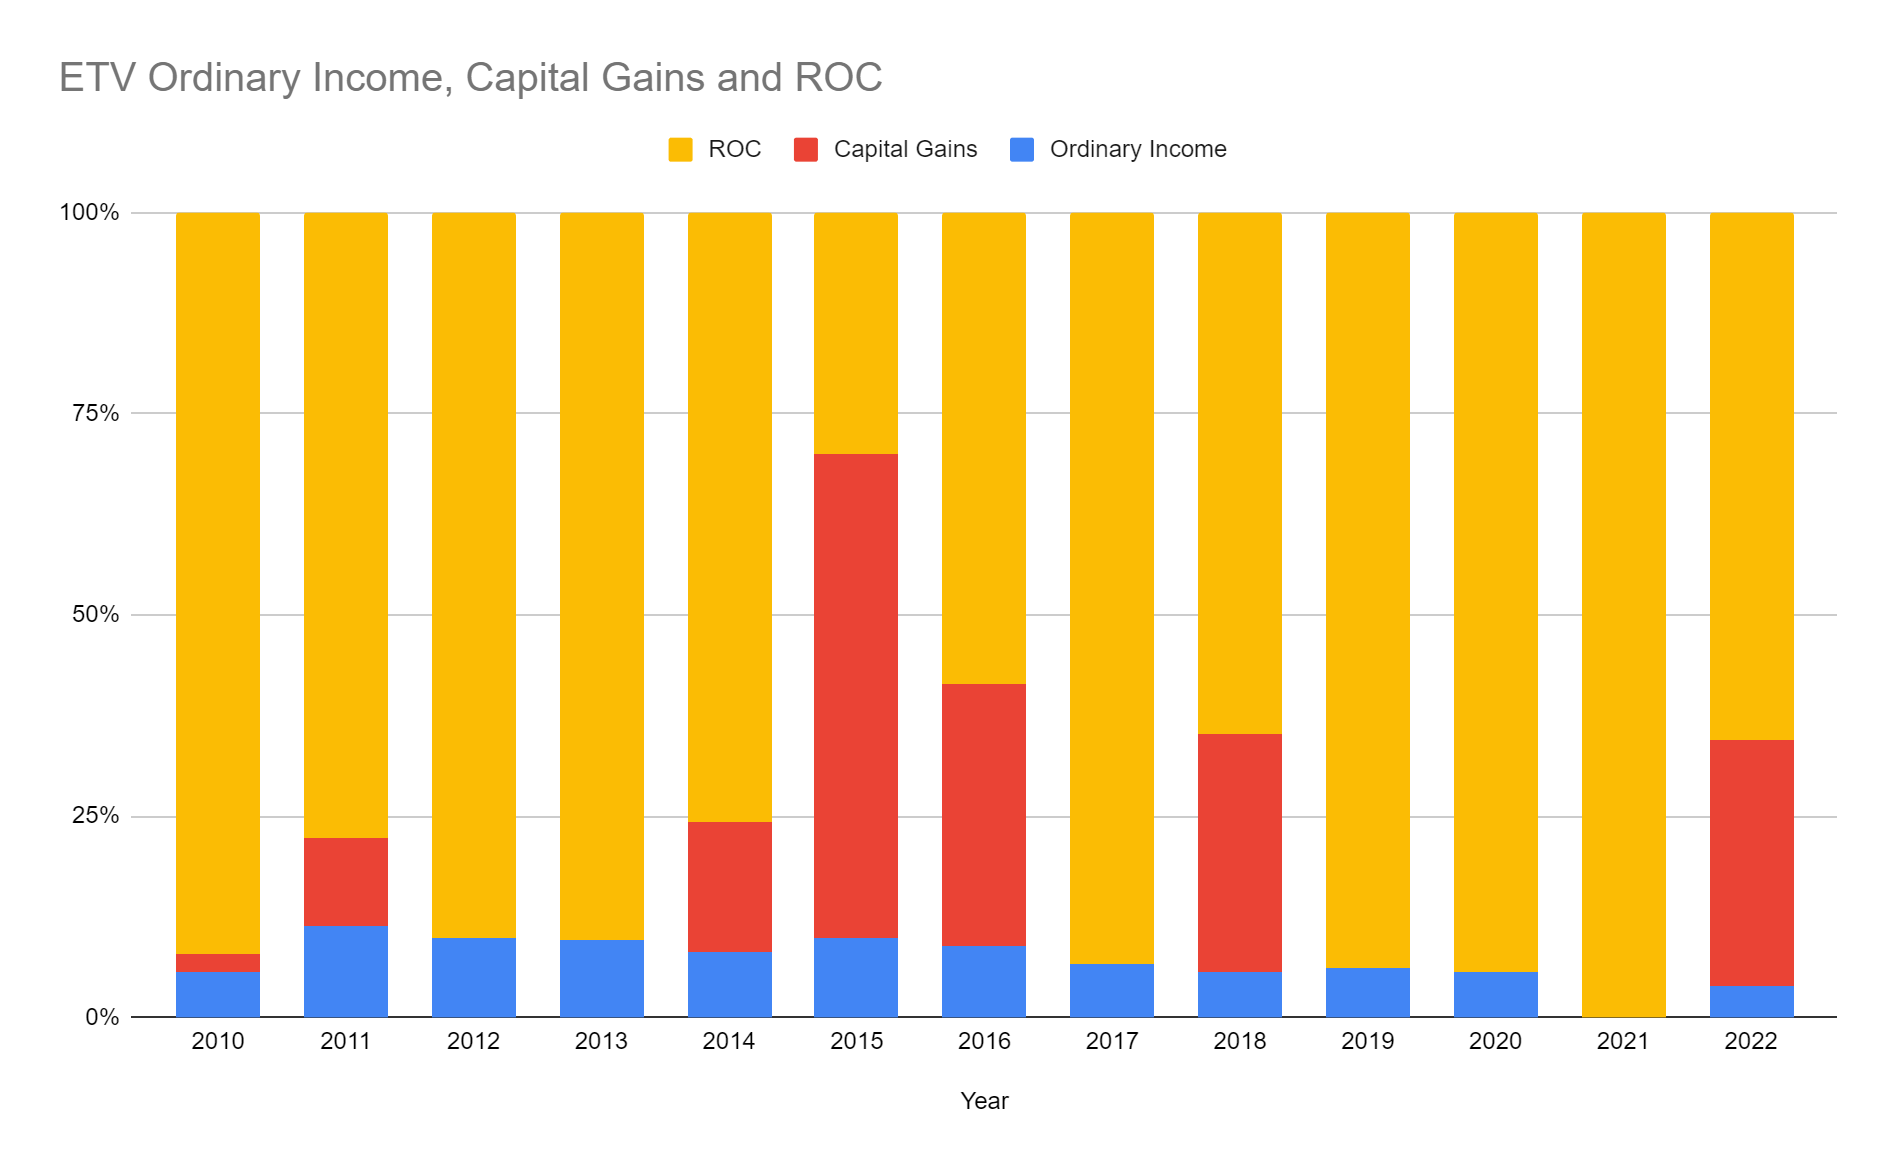
One thing that also tends to show up for both funds is that a significant portion of their distributions are classified as return of capital. This can be a great way to defer tax obligations. There can be "good" ROC and "bad" ROC . ROC distributions reduce an investor's cost basis, therefore acting as a way to defer tax obligations. Once the cost basis reaches $0, additional ROC distributions would become subject to capital gains taxes.
Here's a breakdown of the distribution classifications for ETV over time per characterization.
ETV Distribution Tax Classification (Annual Reports, Author Compiled Chart)
For 2022 , QYLD saw $1.7837 of its $2.188099 distributions classified as ROC. In 2021 , it was a different story. While they had estimated through section 19a reports that they believed most of the distribution would be ROC - as it generally had been - investors were hit with $2.351168 of the $2.850545 distribution being ordinary dividend income. The remaining $0.499377 wasn't any better as it was short-term capital gains. That meant the entire 2021 distribution paid to investors was at a significantly higher tax rate than most probably anticipated.
Another way to measure this would be to look at the NAV performance by itself, without the inclusion of distributions. In this case, ETV has been able to manage itself better while being less destructive to its NAV.
YCharts
Conclusion
ETV and QYLD provide income investors with significantly higher distribution rates, making them perfect for investors looking for monthly cash flows. Both funds have performed quite similarly over the long run; however, given ETV's discount being present, I would lean toward ETV over QYLD at this time. If ETV moved back to a rich premium as it was previously, it could make sense to swap into something such as QYLD.
For further details see:
QYLD And ETV: Appealing Plays For Income-Focused Investors