QYLD - QYLD And RYLD: Yield Spread Narrowed And Ratings Downgraded
2023-05-23 04:51:00 ET
Summary
- The purpose of this article is to update an article I published about 1 year ago in June 2022 regarding covered-call ETFs.
- More specifically, the thesis is to downgrade my ratings on Global X Russell 2000 Covered Call ETF and Global X NASDAQ 100 Covered Call ETF.
- In my June 2022 article, I argued that QYLD was a better choice than RYLD after analyzing their yield spread compared to risk-free rates.
- This update is triggered by 3 changes since then: changes in their yields, in risk-free rates, and also in volatility.
- These changes lead to a downgrade on both ETFs.
Thesis
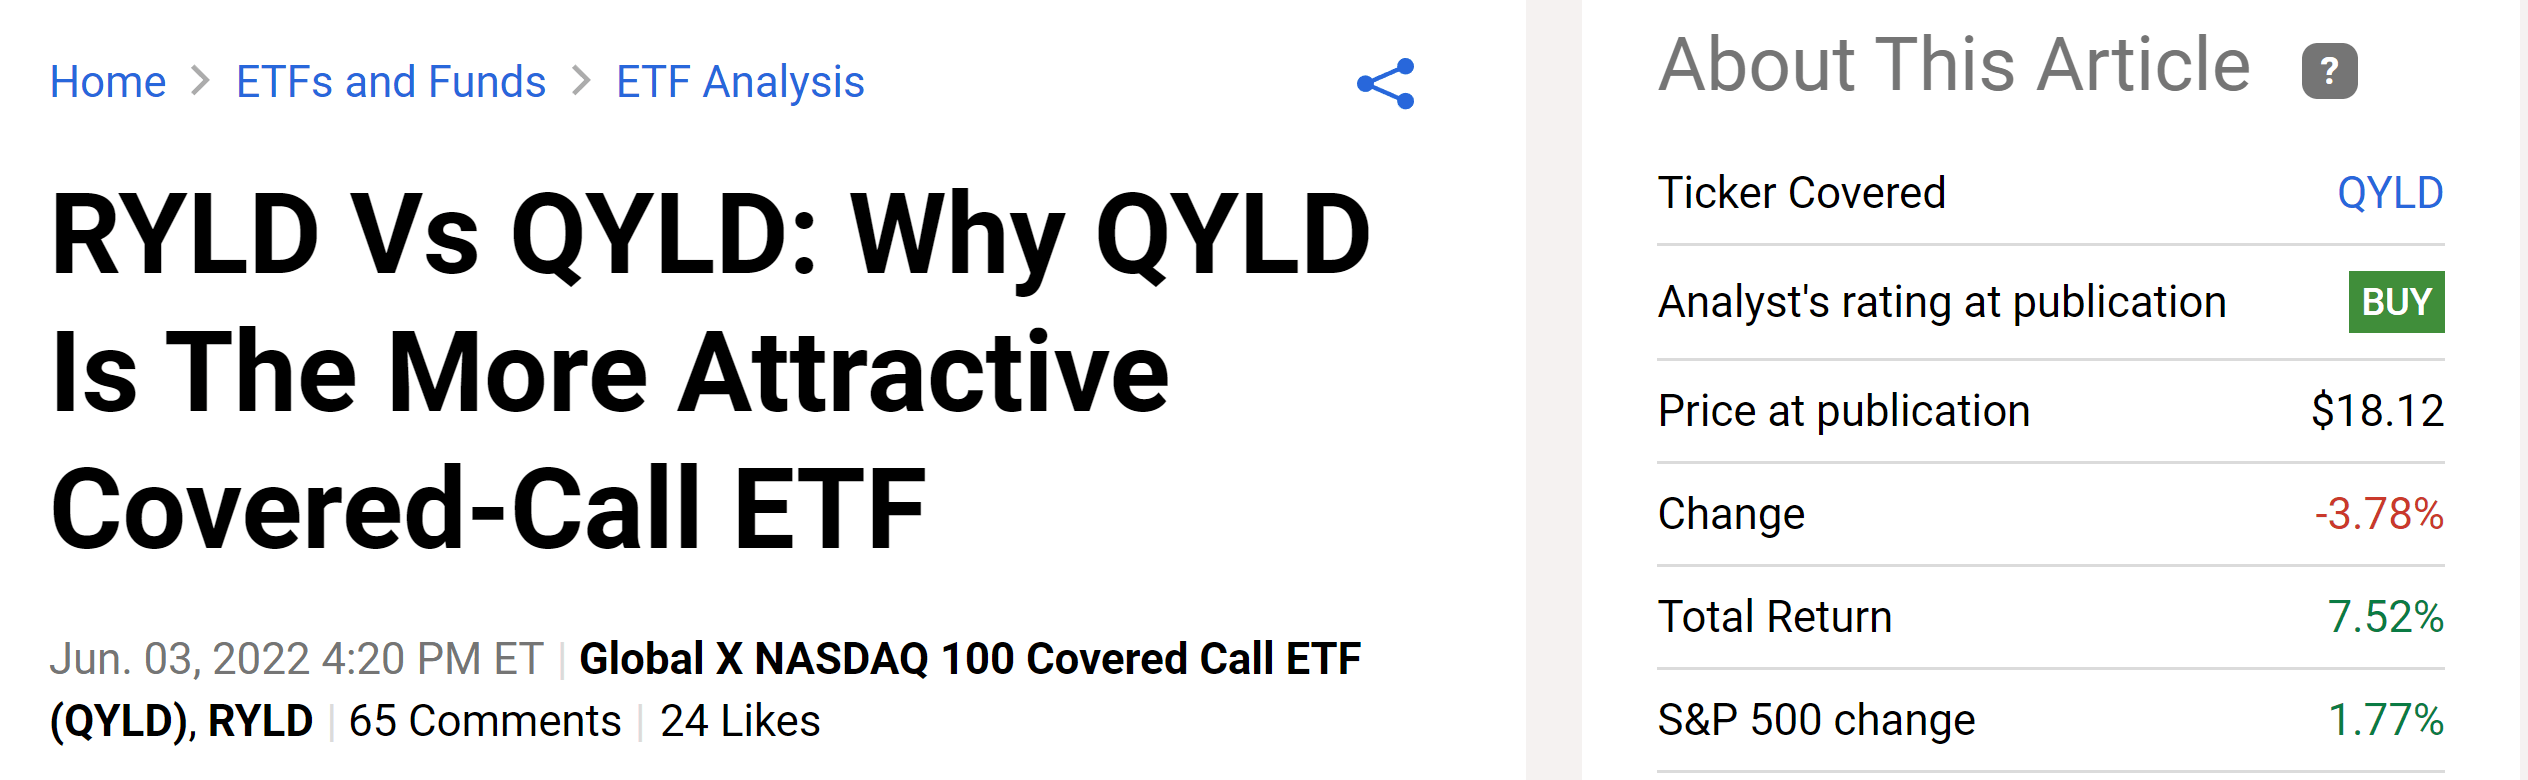
This is an update of an article that I published around 1 year ago (on June 3, 2022, to be precise) on two popular covered-call ETFs: the Global X Russell 2000 Covered Call ETF ( RYLD ) and the Global X NASDAQ 100 Covered Call ETF ( QYLD ) . The title, "Why QYLD Is the Better Covered-Call ETF than RYLD", already gave away the entire thesis. And the main consideration in my thesis involved their yield spread ("YS") against risk-free rates. At that time, QYLD's yield spread was 12.1% above the 10-year treasury rates, which was not only more than 120 basis points higher than RYLD but also the highest level since its inception eight years ago.
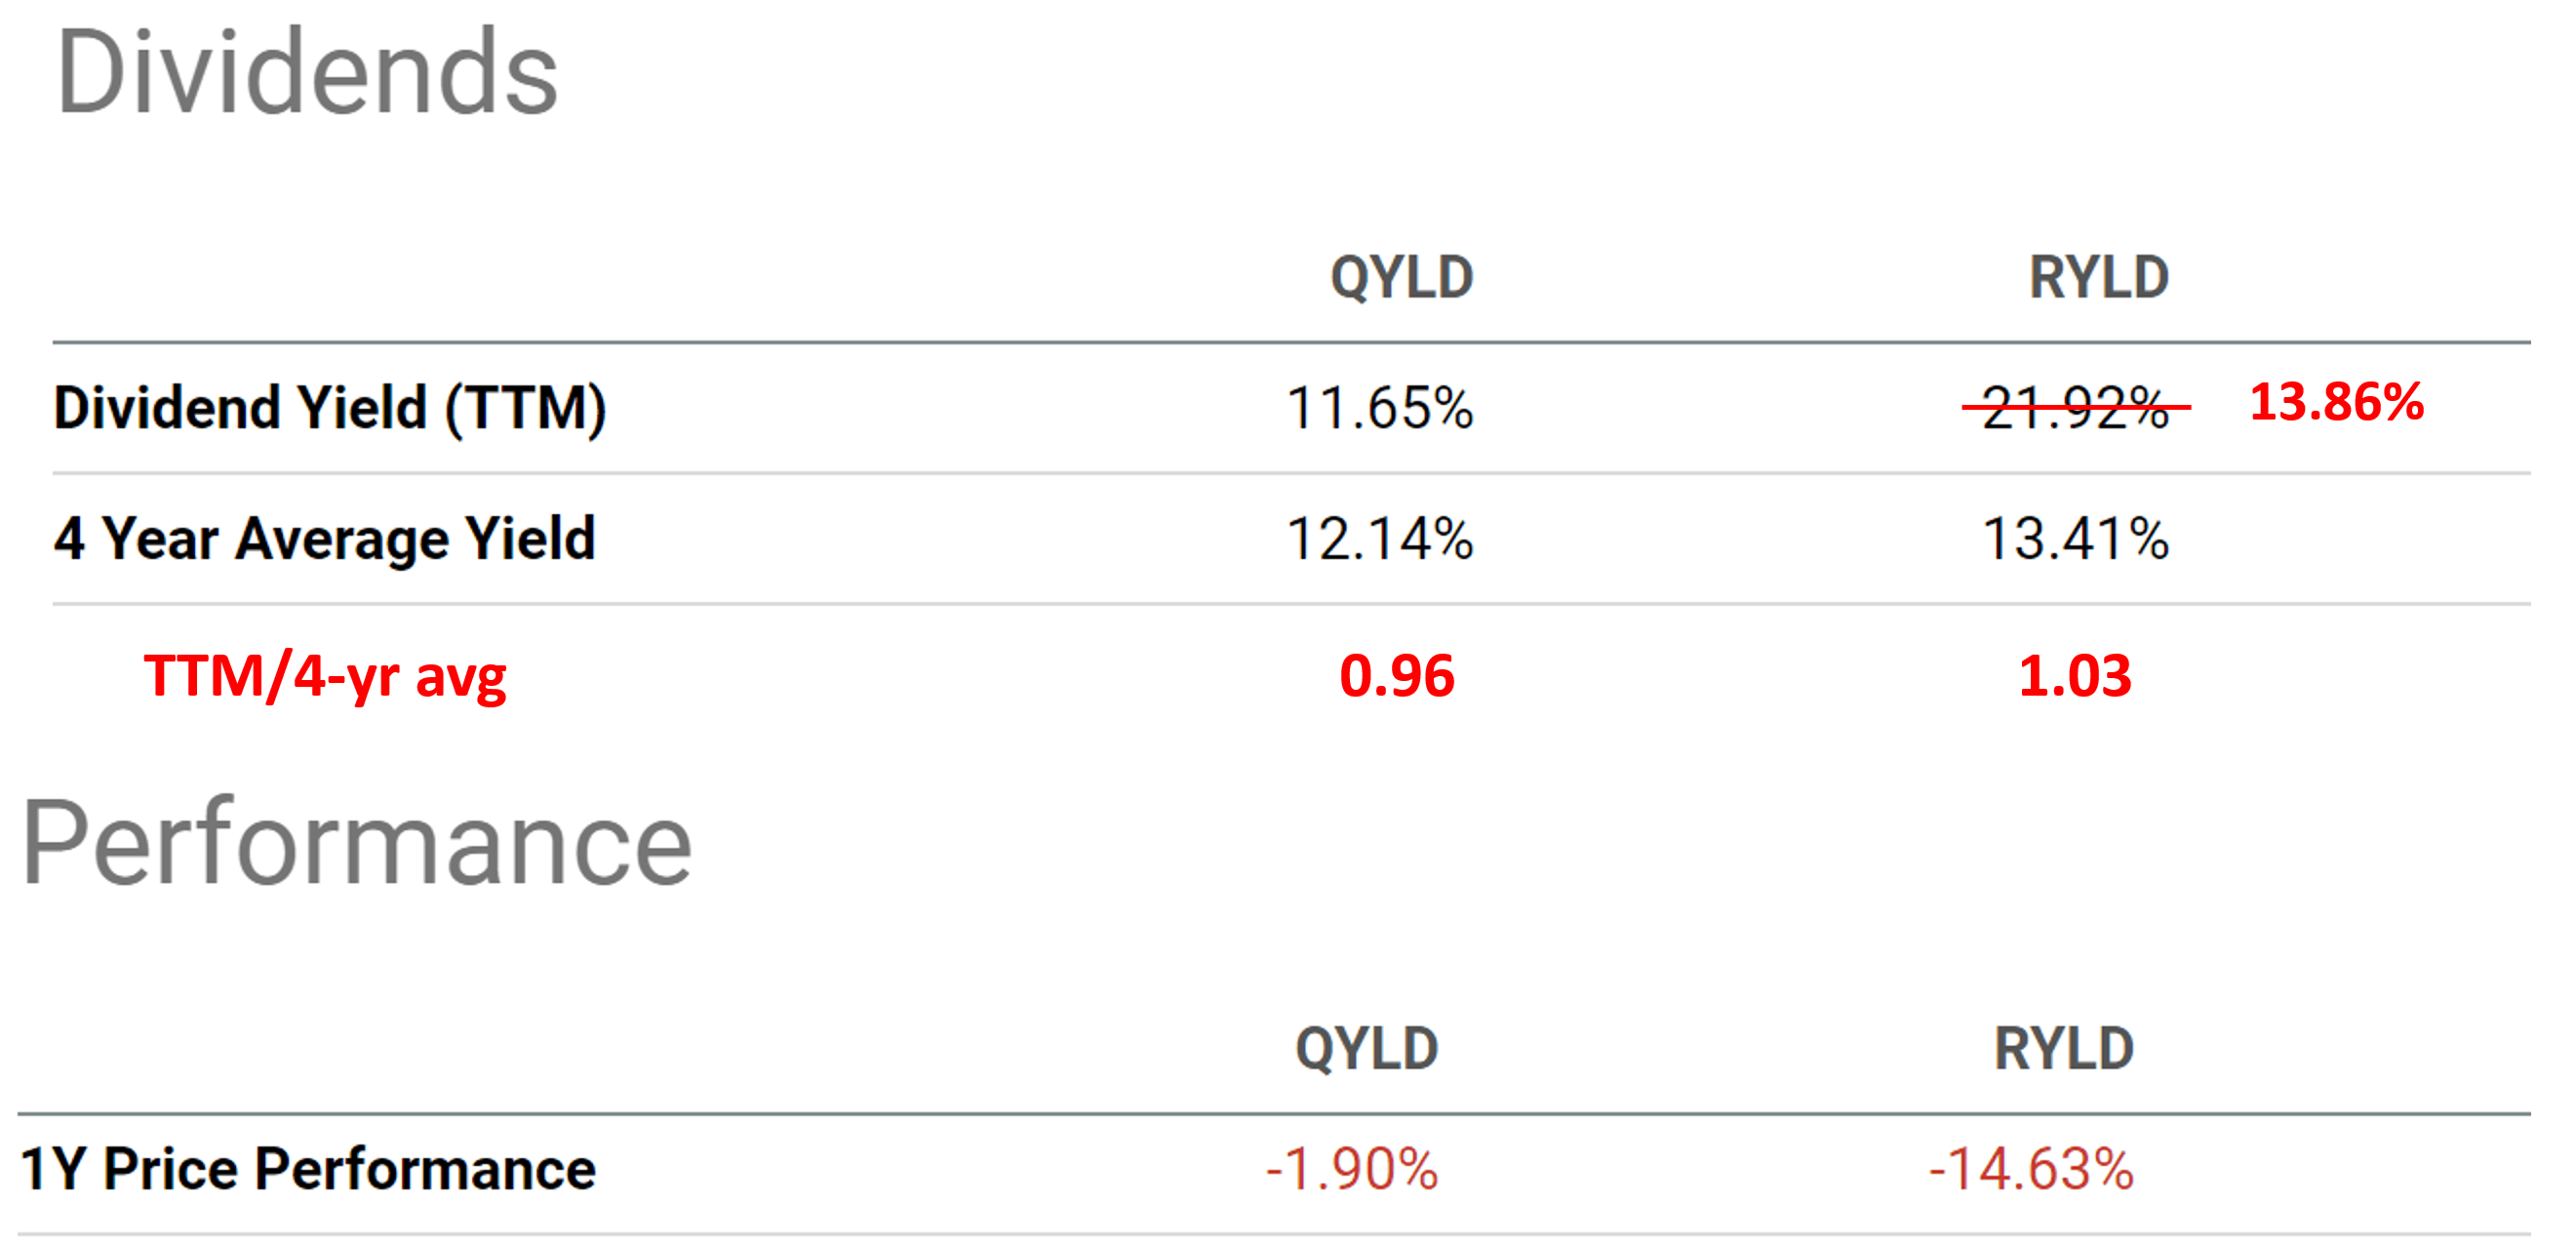
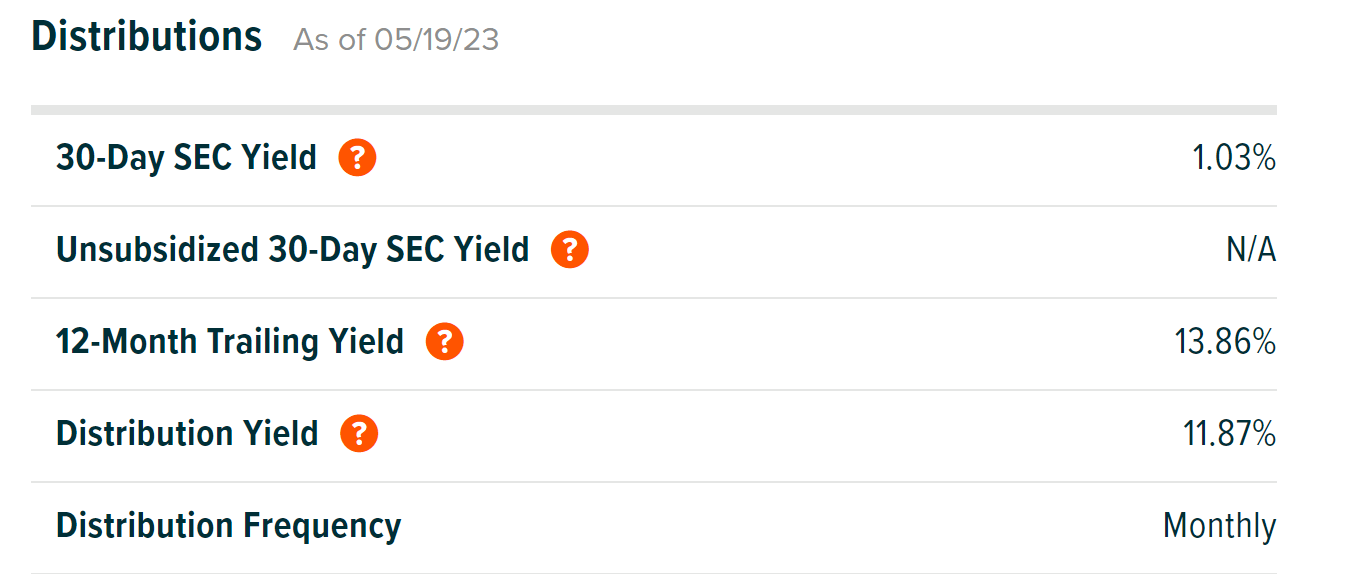
The thesis worked out beautifully. As you can see from the charts provided here, QYLD has delivered a total return of 7.52% since then, outperforming S&P 500 by a good margin and also outperforming RYLD by an even larger margin. To wit, RYLD has suffered a 14.6% price loss. With a dividend yield (on average 13.4% as seen below), RYLD still suffered a total net loss. A quick note here - I am not sure why Seeking Alpha data quoted RYLD's TTM dividend yield to be 21.9%. The correct number should be 13.86% as seen in the third chart below (taken from the fund's website directly).
Given the effectiveness (and also the simplicity) of YS illustrated here, this article will perform an updated assessment of these two covered-call ETFs. And you will see that their YS again risk-free rates have narrowed significantly due to a combination of 2 changes. First, their yields have become less attractive since my June 2022 article. As seen in the chart below, QYLD's yield has become lower than its 4-year average (by about 4%) and RYLD's yield has become only 3% above its 4-year average. And second, the risk-free rates have risen substantially since then by more than 100 basis points. With YS substantially narrowed, I now see a very unfavorable return profile ahead.
The remainder of this article will elaborate on the above changes.
RYLD and QYLD: Basic information
Details of both ETF funds are provided in my original article, and I will only repeat/quote a few key points directly relevant to this update:
- Both ETFs follow a similar covered-call strategy. And the difference is in the underlying index that they use: RYLD uses a small-cap index (the Russell 2000 index) and QYLD uses a large-cap index (the NASDAQ 100 index).
- Both RYLD and QYLD use their underlying holdings to write covered calls. The premium they receive is how they pay their generous monthly income. The premium is correlated with so-call implied volatility, which is another consideration for my downgrade since the volatility index has quieted down substantially since June 2022. More on this later.
RYLD and QYLD: YS narrowed dramatically
The YS concept worked so effectively because risk-free rates act as the gravity of all asset valuations. As such, we view it as the universal and timeless benchmark for all yields (see more elaborations in our earlier writings ).
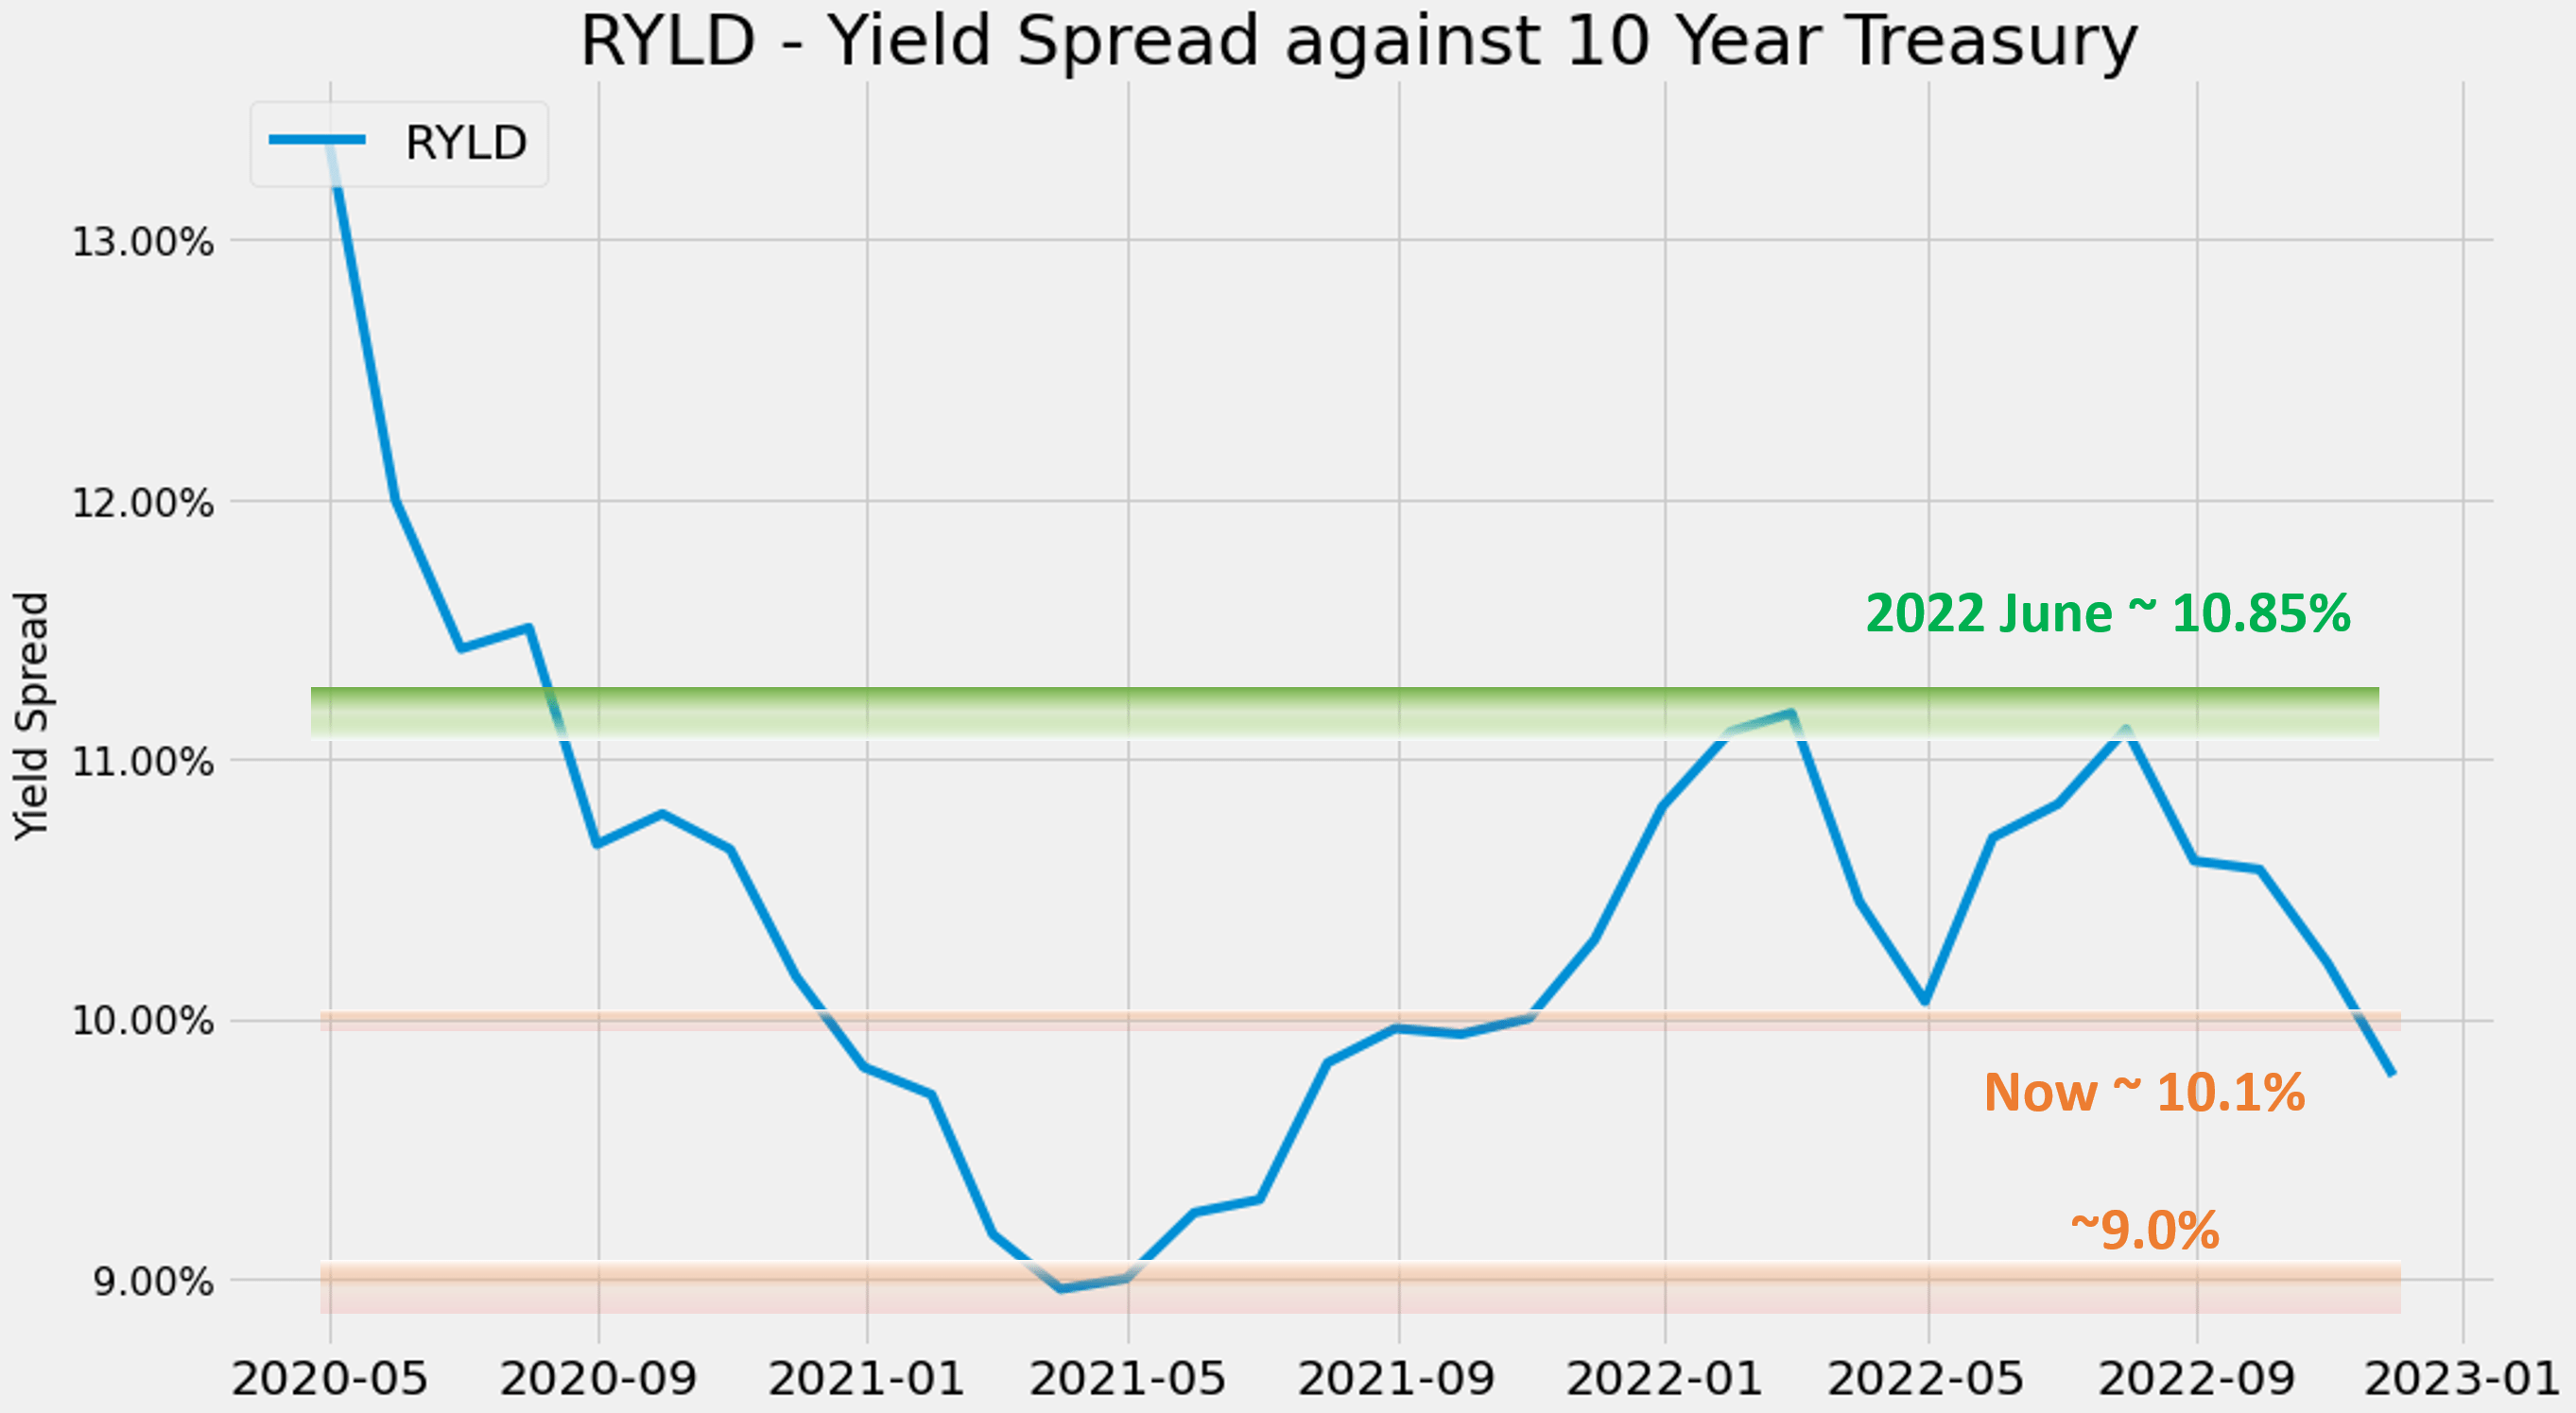
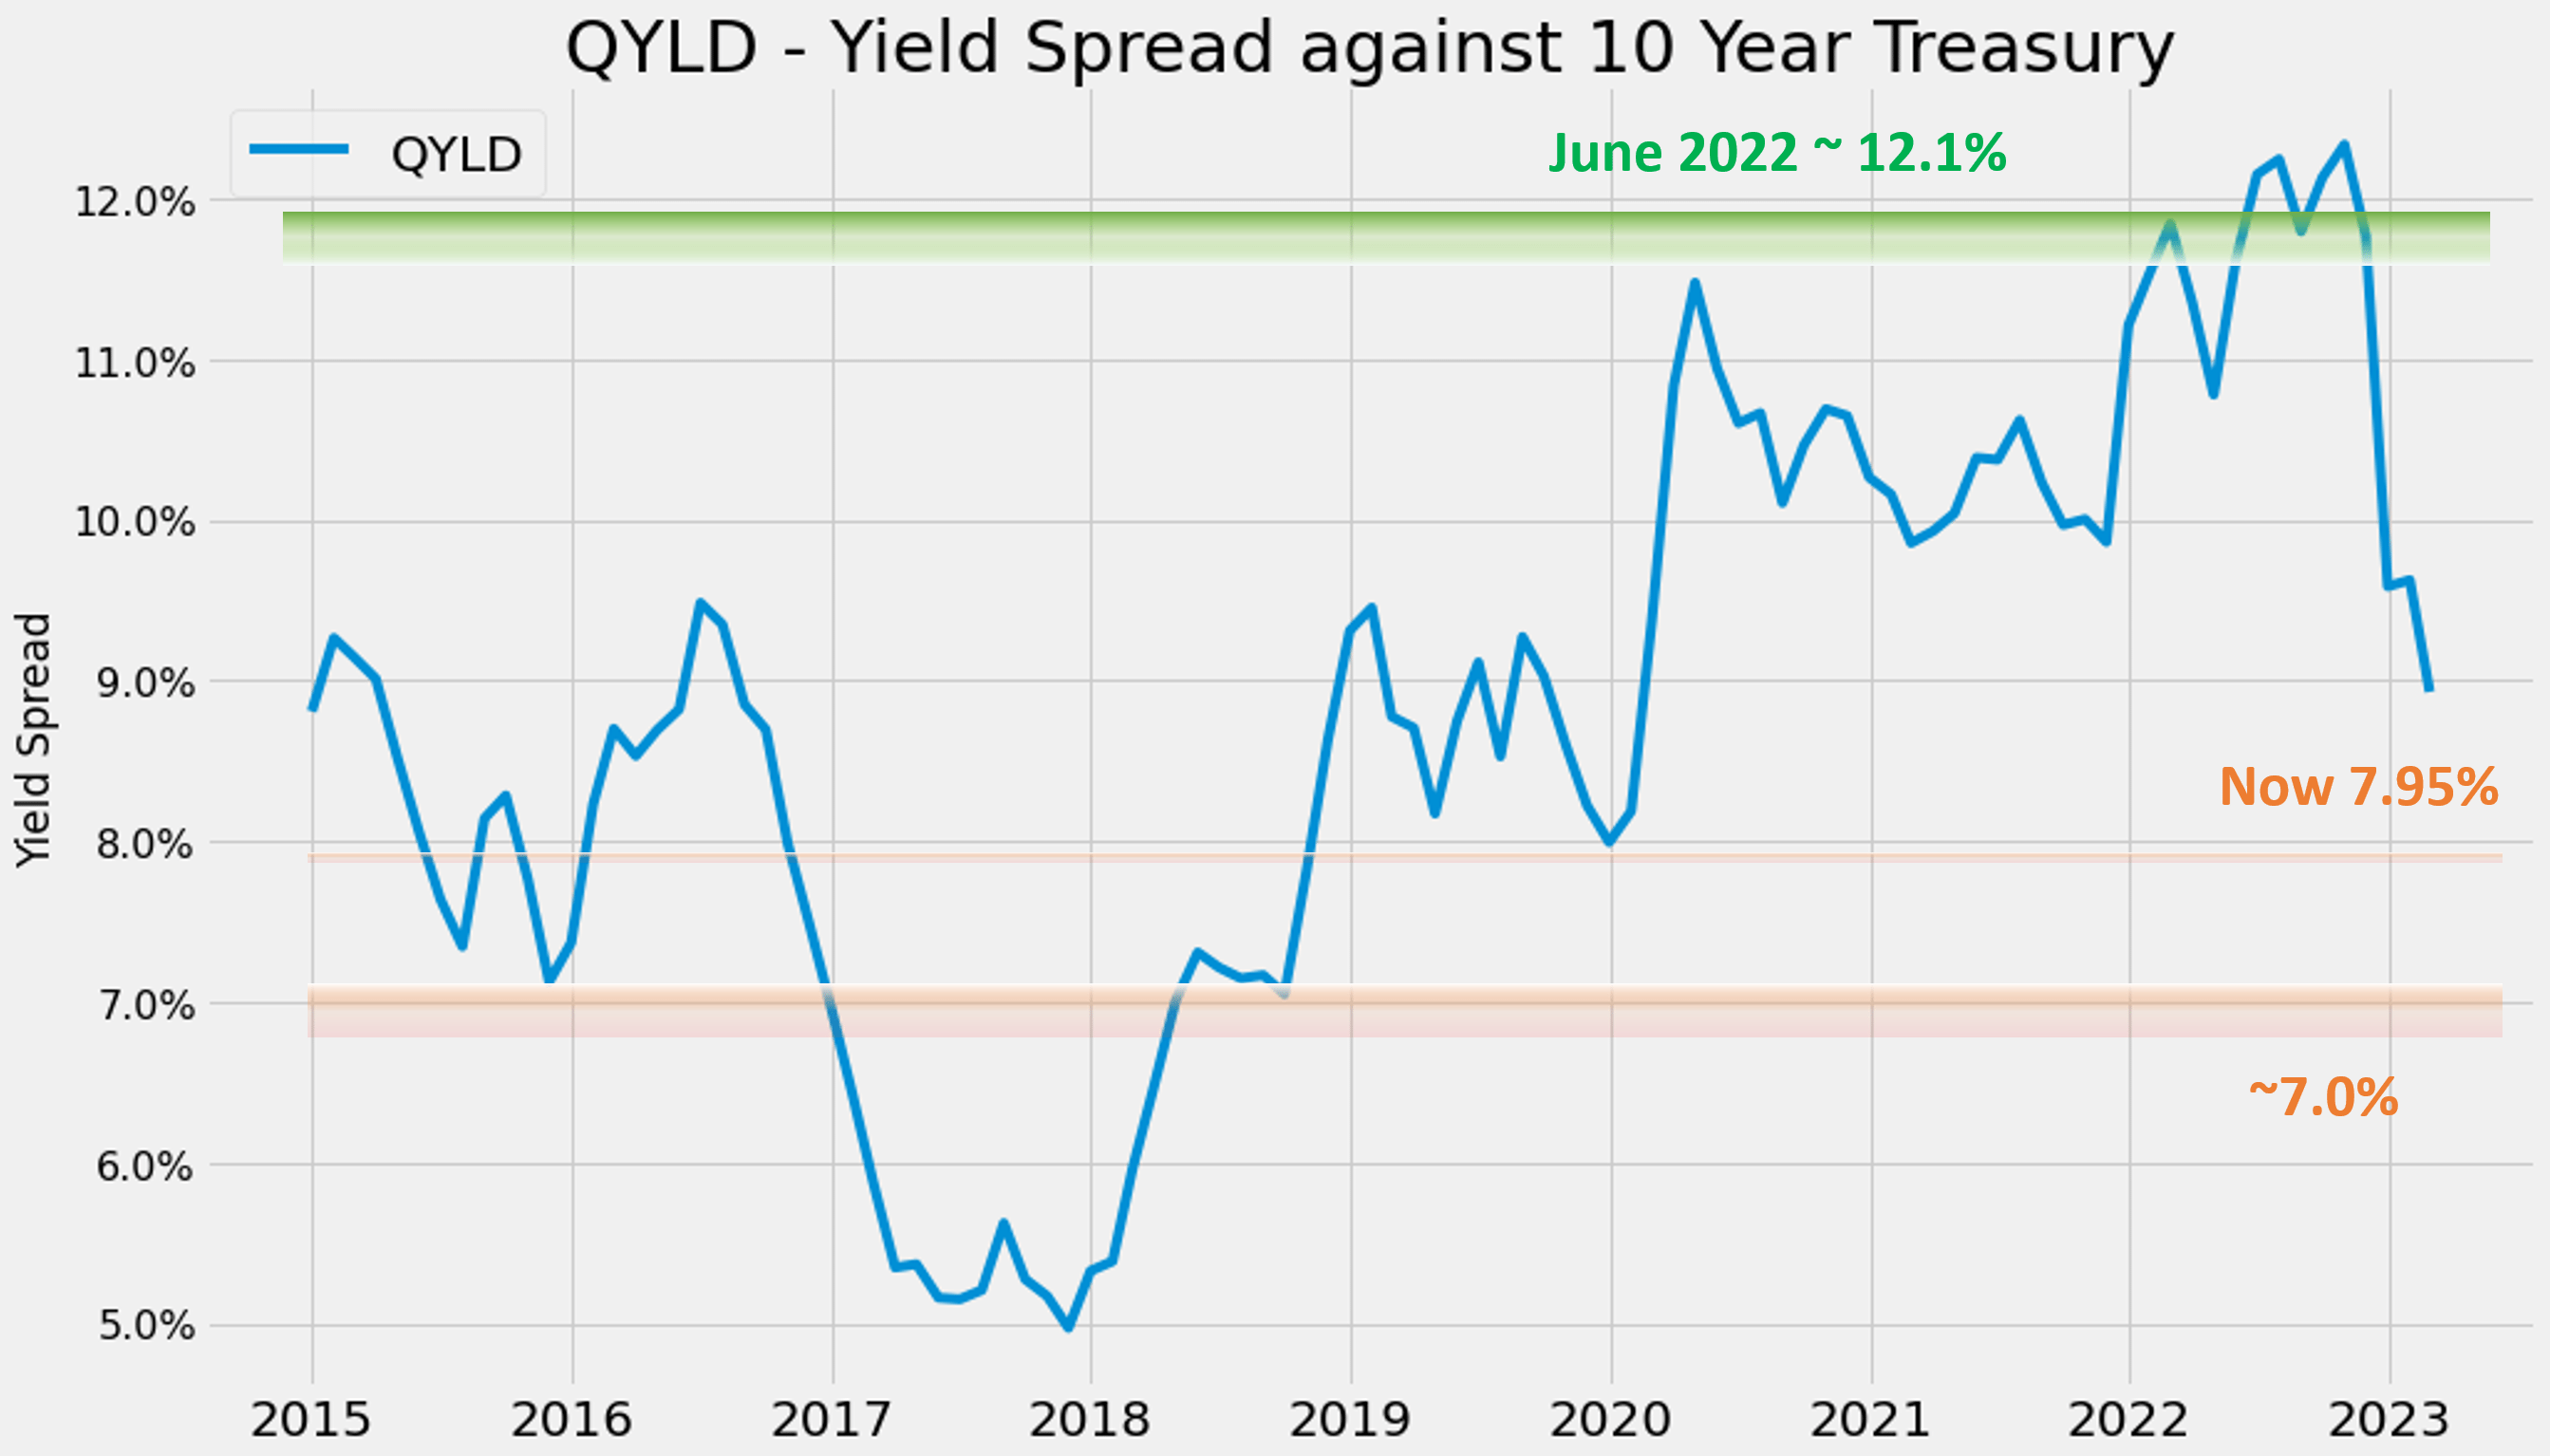
And the following two charts show the YS change for both QYLD and RYLD since June 2022. The YS here is computed as the difference between the TTM yield of RYLD and QYLD relative to 10-year treasury rates. As seen, both funds' YS mostly fluctuated within a relatively stable range over time. Over the past eight years, QYLD's YS has primarily fluctuated between 7.0% and 12.0%. And RYLD's YS has primarily fluctuated between 9.0% and 11.0%. Although bear in mind that RYLD has limited available historical data and therefore my estimated range could have a large margin of error. However, if we exclude the peaked YS of 13%+ during the COVID panic, its YS has largely been range-bound between ~9% and 11%, hitting a low point of around 9% in mid-2021 and widening to approximately 11% twice in 2022.
With the above context, it's straightforward to explain why we liked QYLD last June but have changed our minds now. QYLD's YS in relation to risk-free interest rates was at 12.1% last June. As observed in these charts, that was not only more attractive than RYLD's YS (about 10.85% at that time) by more than 100 basis points, but also among its historical peak value.
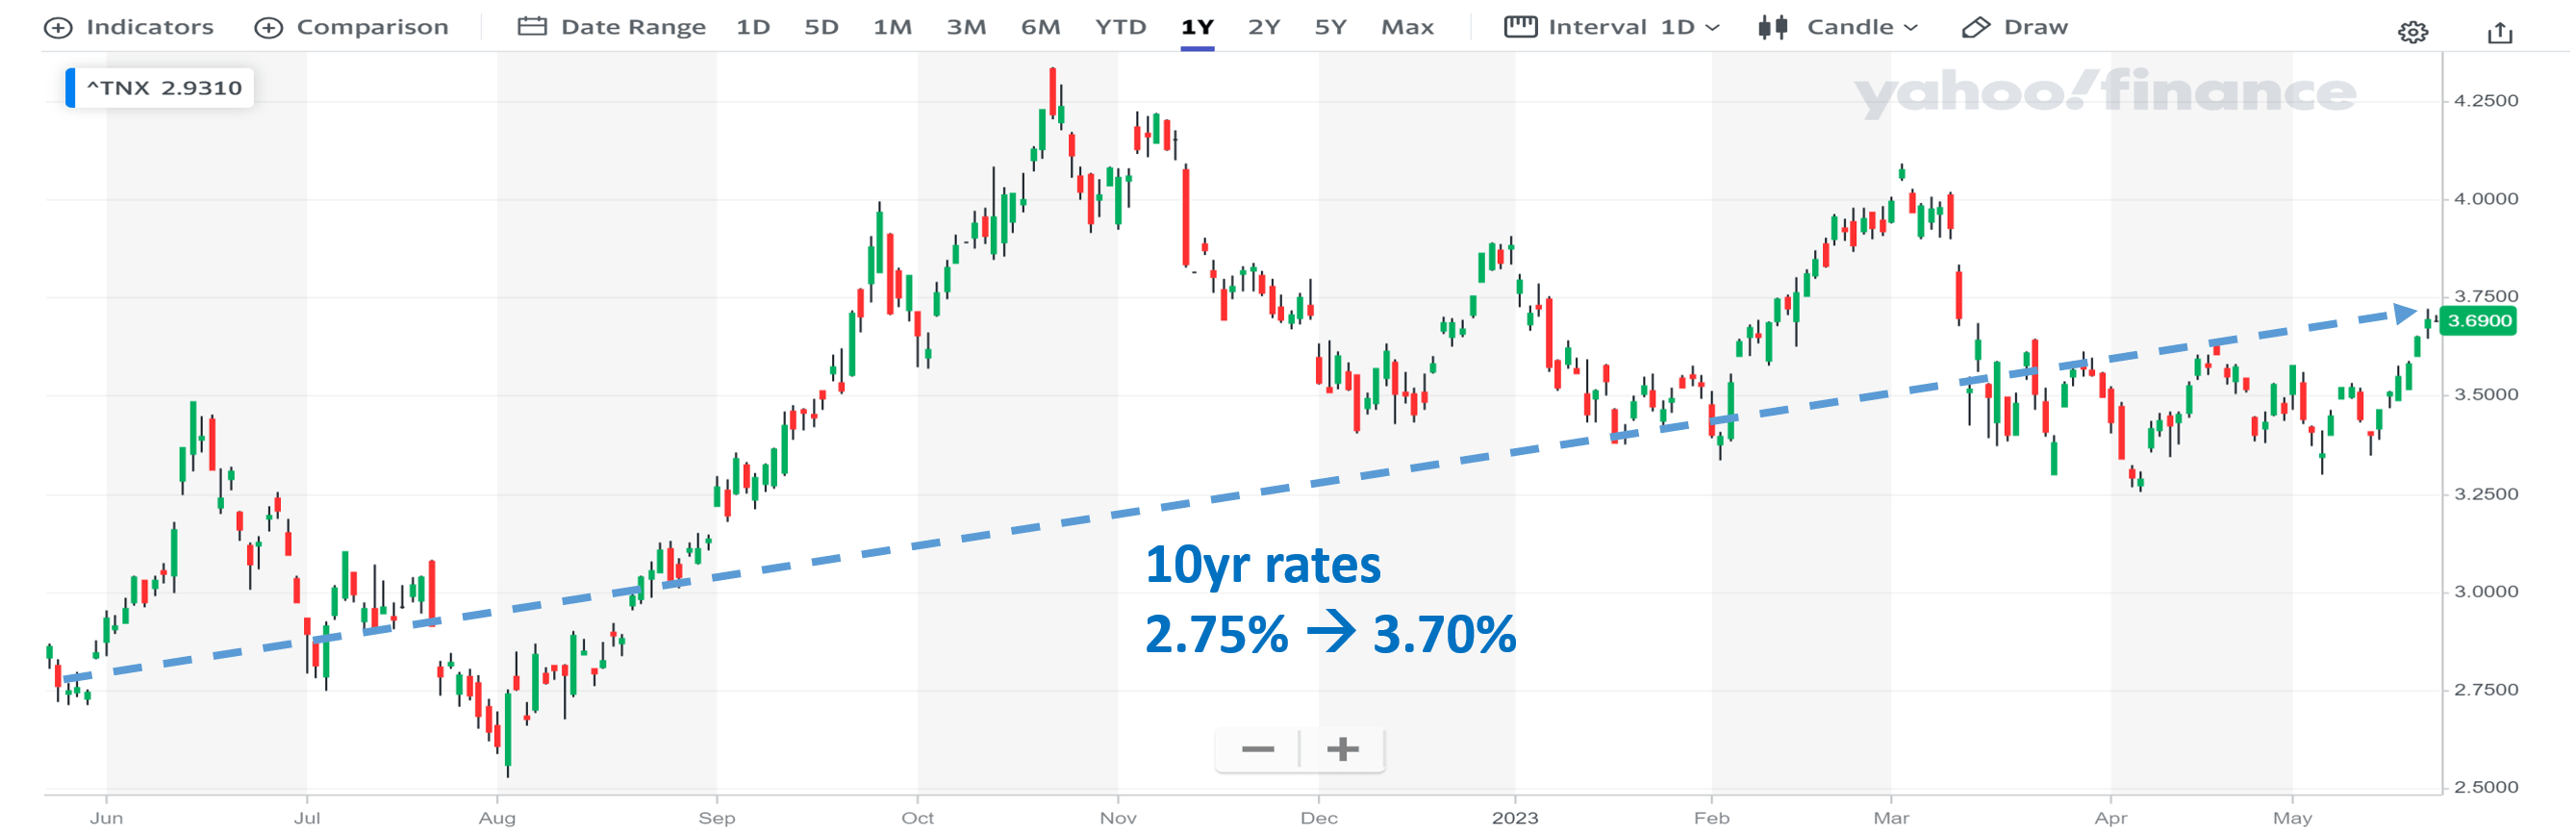
However, since June 2022, their YS has narrowed dramatically due to a combination of the changes in their yields as aforementioned, and also the rise in risk-free rates as shown in the chart below. To wit, the 10-year treasury rates have risen about 2.75% when I published my original thesis to the current level of 3.7%. A rise of almost 100 basis points. Due to these combined effects, the YS between QYLD and 10-year treasury rates have narrowed to about 7.95% only (11.65% TTM yield minus 3.7% treasury rates). And as you can see from the chart above, this level of YS is now close to the thinnest level historically. A thinner yield spread suggests a higher risk premium and unfavorable future total return potential, as to be detailed next.
Total return potential vs. YS
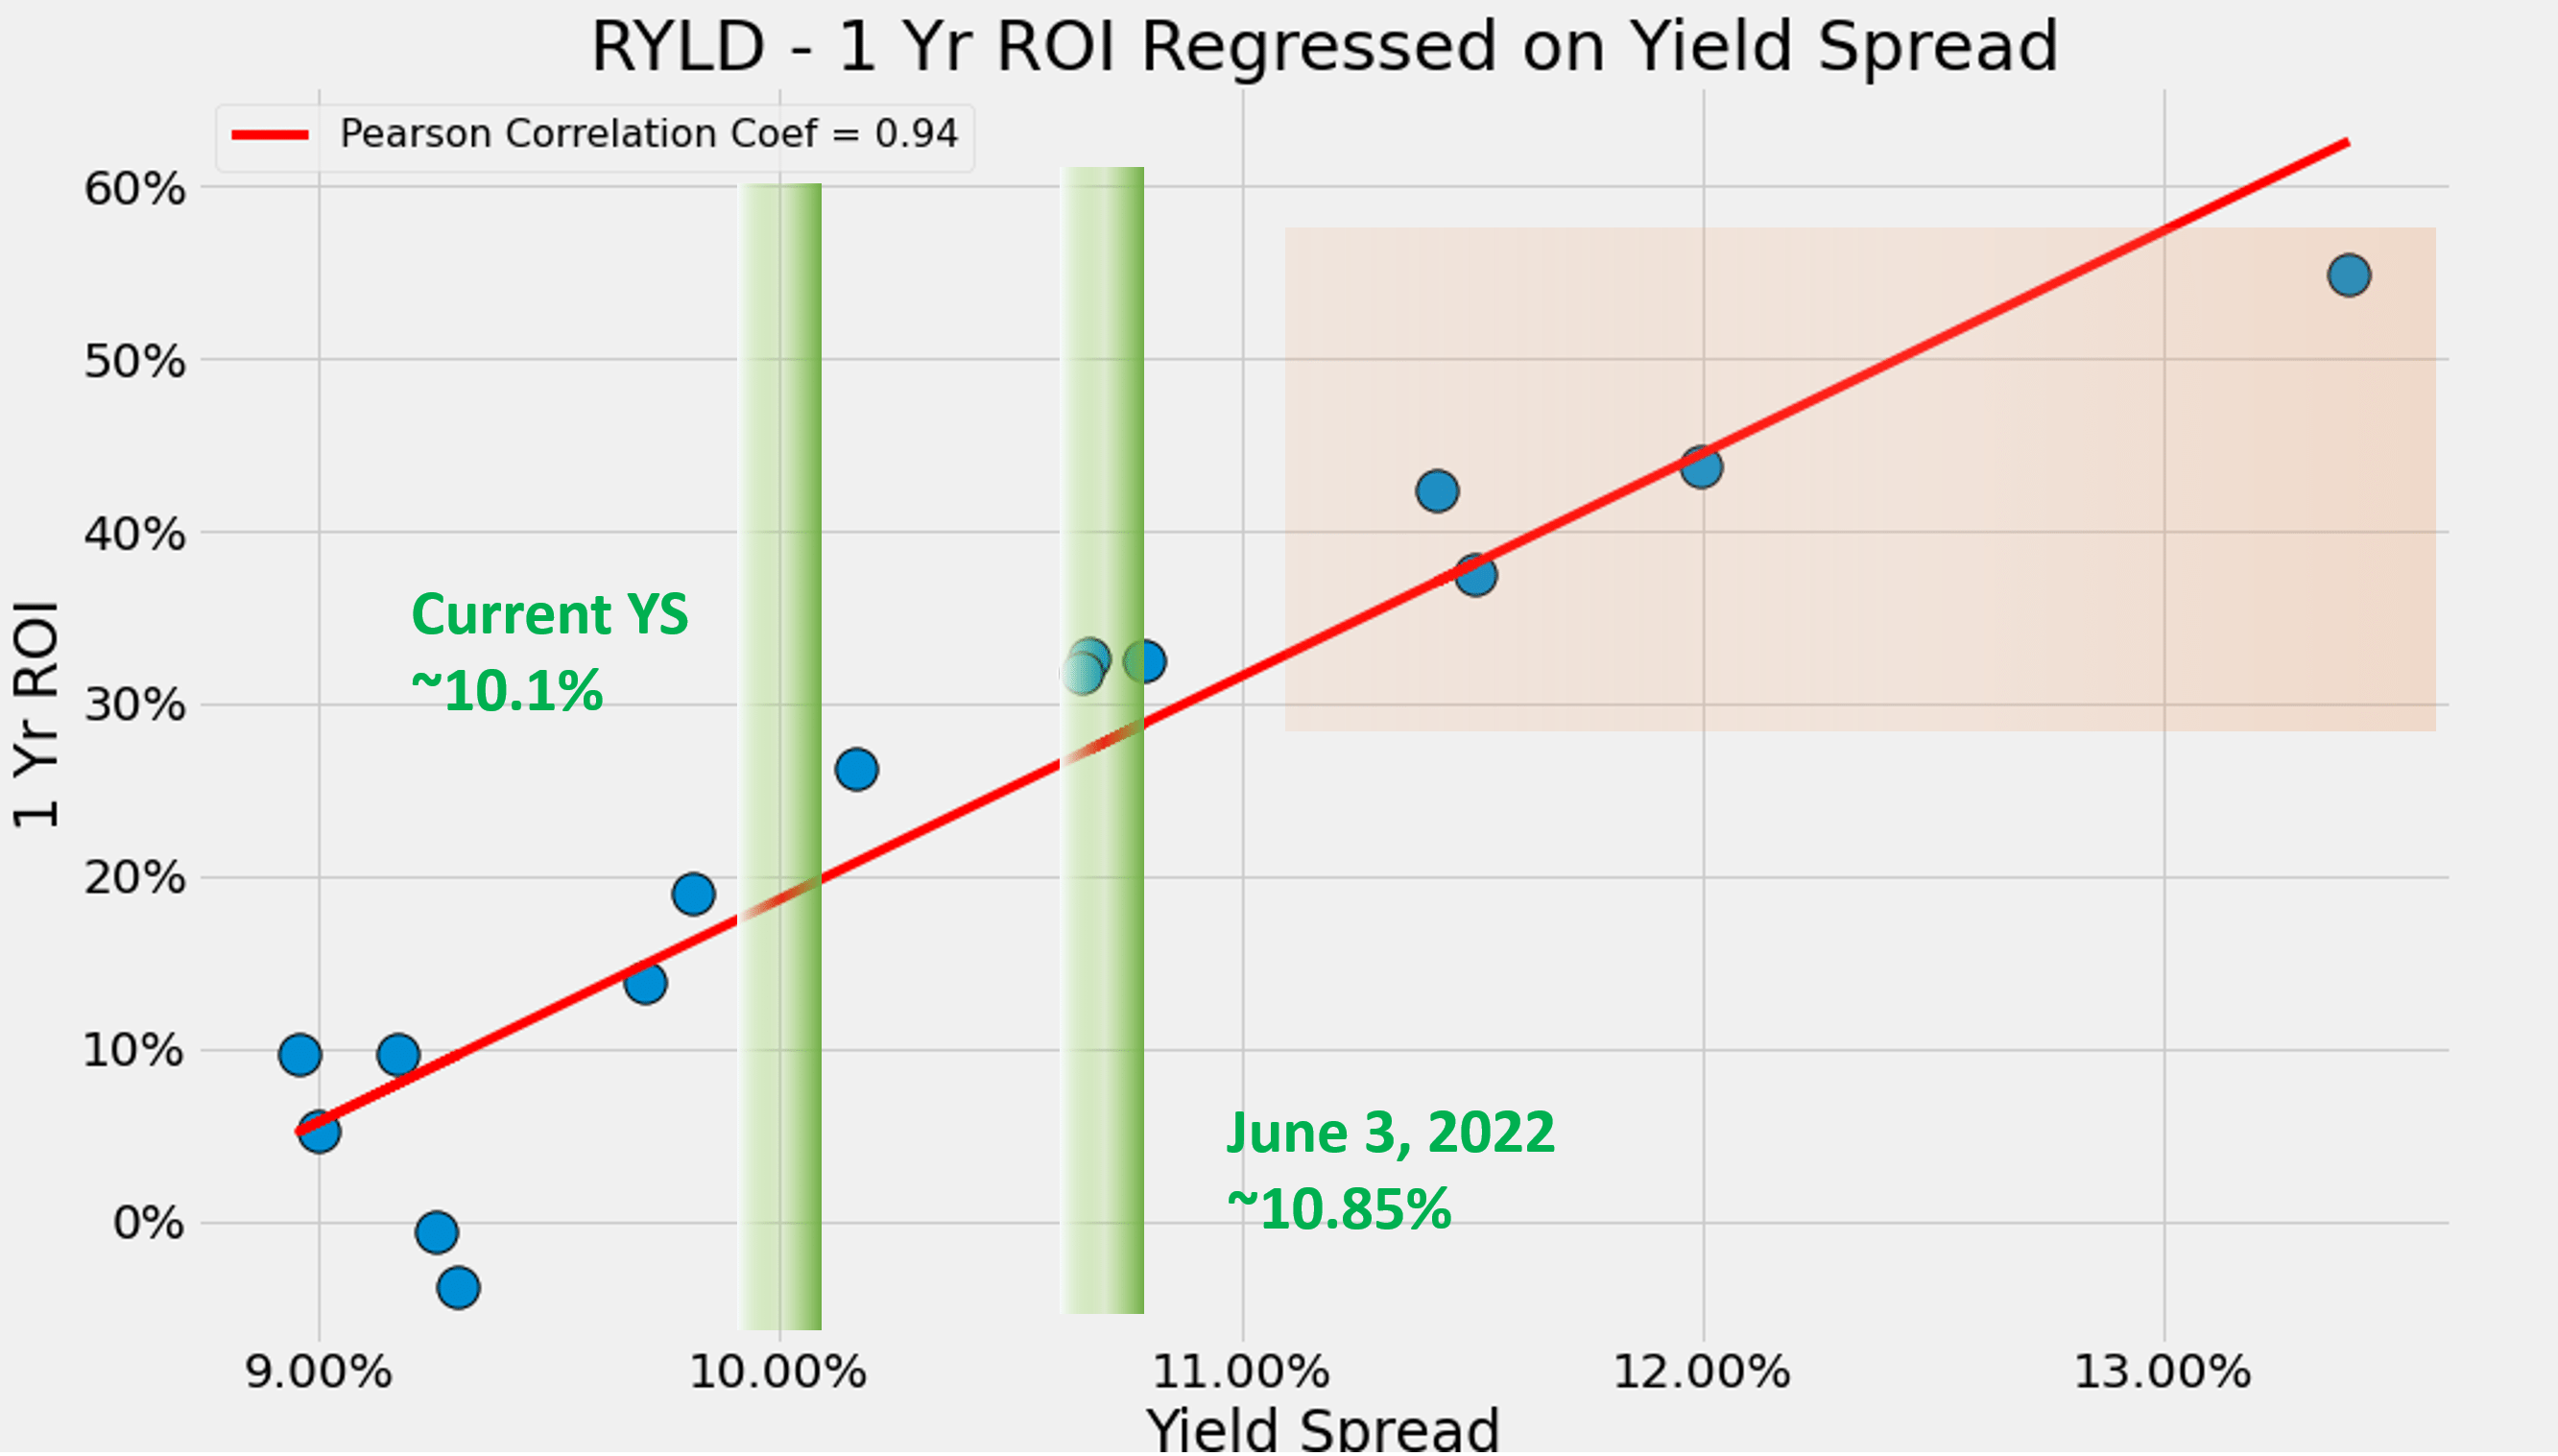
For those familiar with our approach, you must be very familiar with the fact that future total returns are closely tied to the YS, as shown in the following two charts. The first chart illustrates the 1-year total return from RYLD regressed on YS. And as seen, the correlation is nearly perfect, with a Pearson correlation coefficient of 0.94. But again, bear in mind the limited amount of historical data available for RYLD. Back in June 2022, RYLD's YS was at 10.85%. It had a favorable total return potential, but not as much as QYLD or its most attractive levels (those highlighted in the orange box). Now at the narrower YS of 10.1%, the total return potential has become even less attractive.
The second chart below displays a similar correlation for QYLD. Although the data points appear more scattered due to the much larger amount of data available for QYLD, the positive correlation persisted. To wit, the Pearson correlation coefficient is 0.35, a mildly strong level. And you can see why we liked QYLD a year ago. Its YS hovered around 12.1% at that time, among the widest historical levels, which has only occurred a few times with dominating odds for large total returns. Now, with a much narrower YS of 7.95%, the odds are much less impressive, as seen here.
Other risks and final thoughts
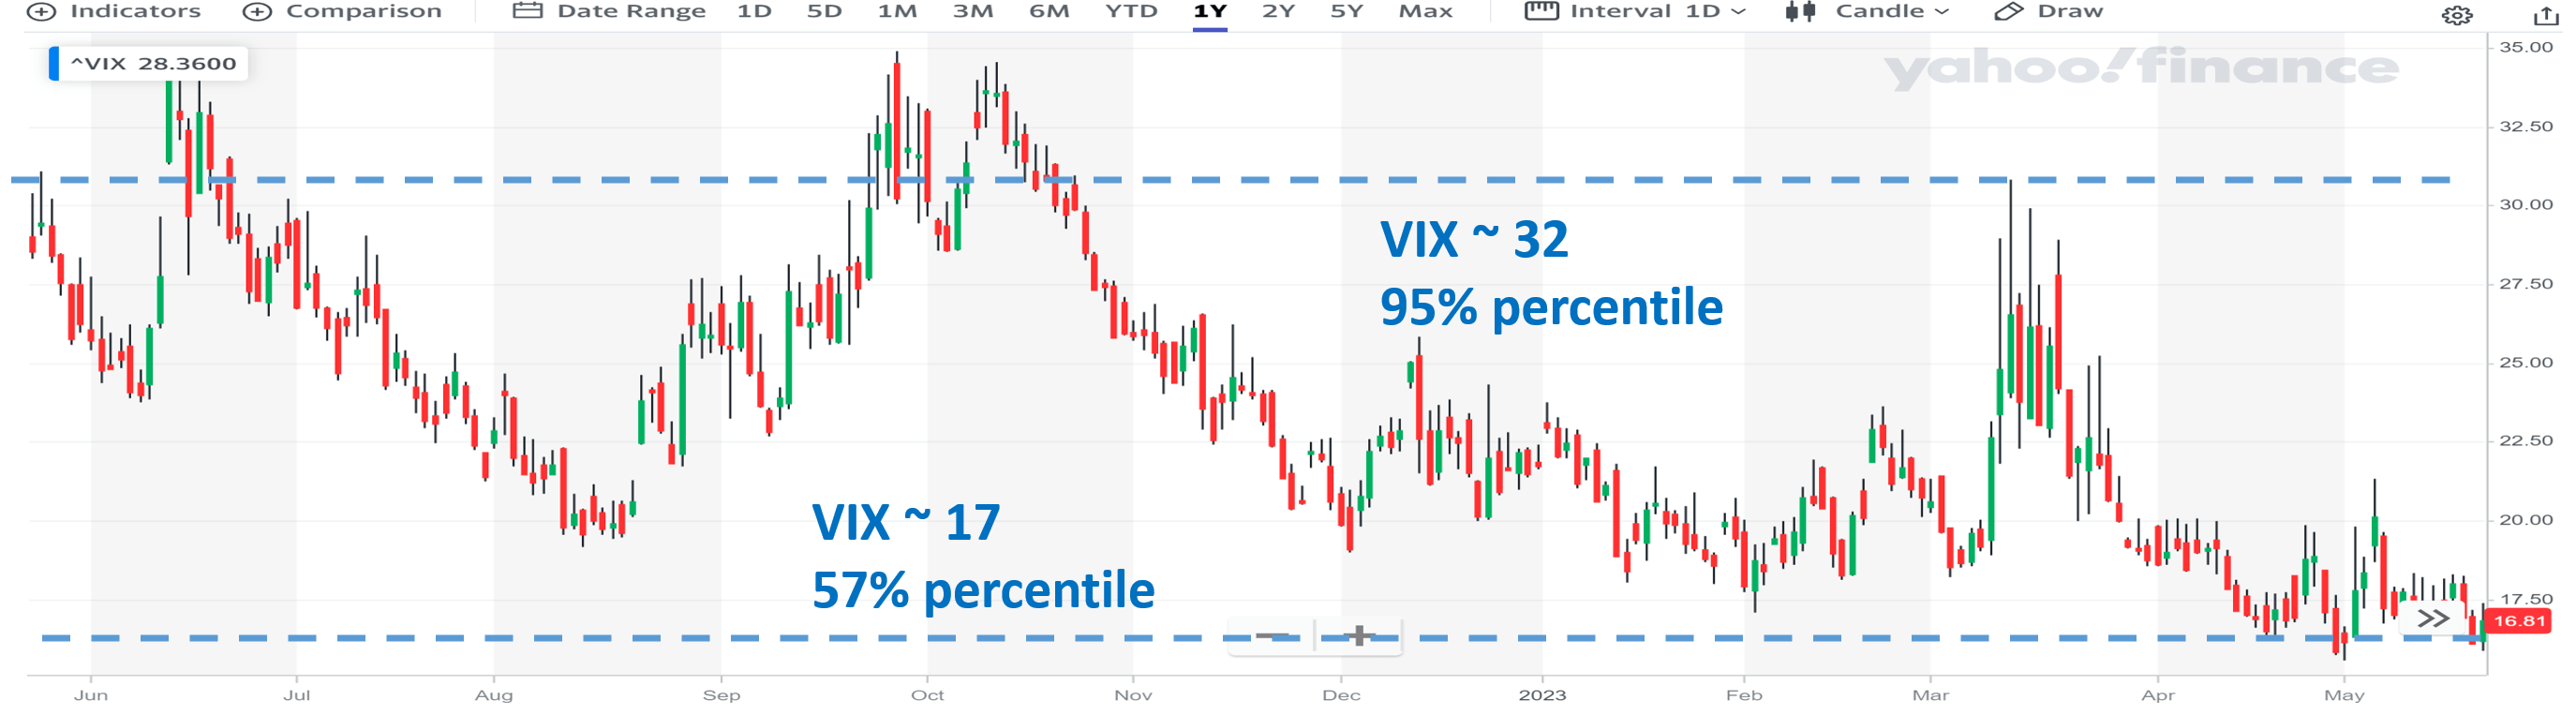
At the same time, the volatility index ("VIX") has been significantly calmer compared to last June as seen in the next chart. Last June, the VIX hovered above 30+, a level that ranked in the 95th percentile historically. Fast forward to now, the VIX hovers around 17, which is only slightly above the historical average (around 15~16). As aforementioned, both risk-free rates and volatility have an impact on income generation through call writing. The subdued volatility tends to decrease the premium on the covered calls, and higher interest rates further make the income "worth less" when compared to the income you can generate via risk-free options (e.g., treasury bonds).
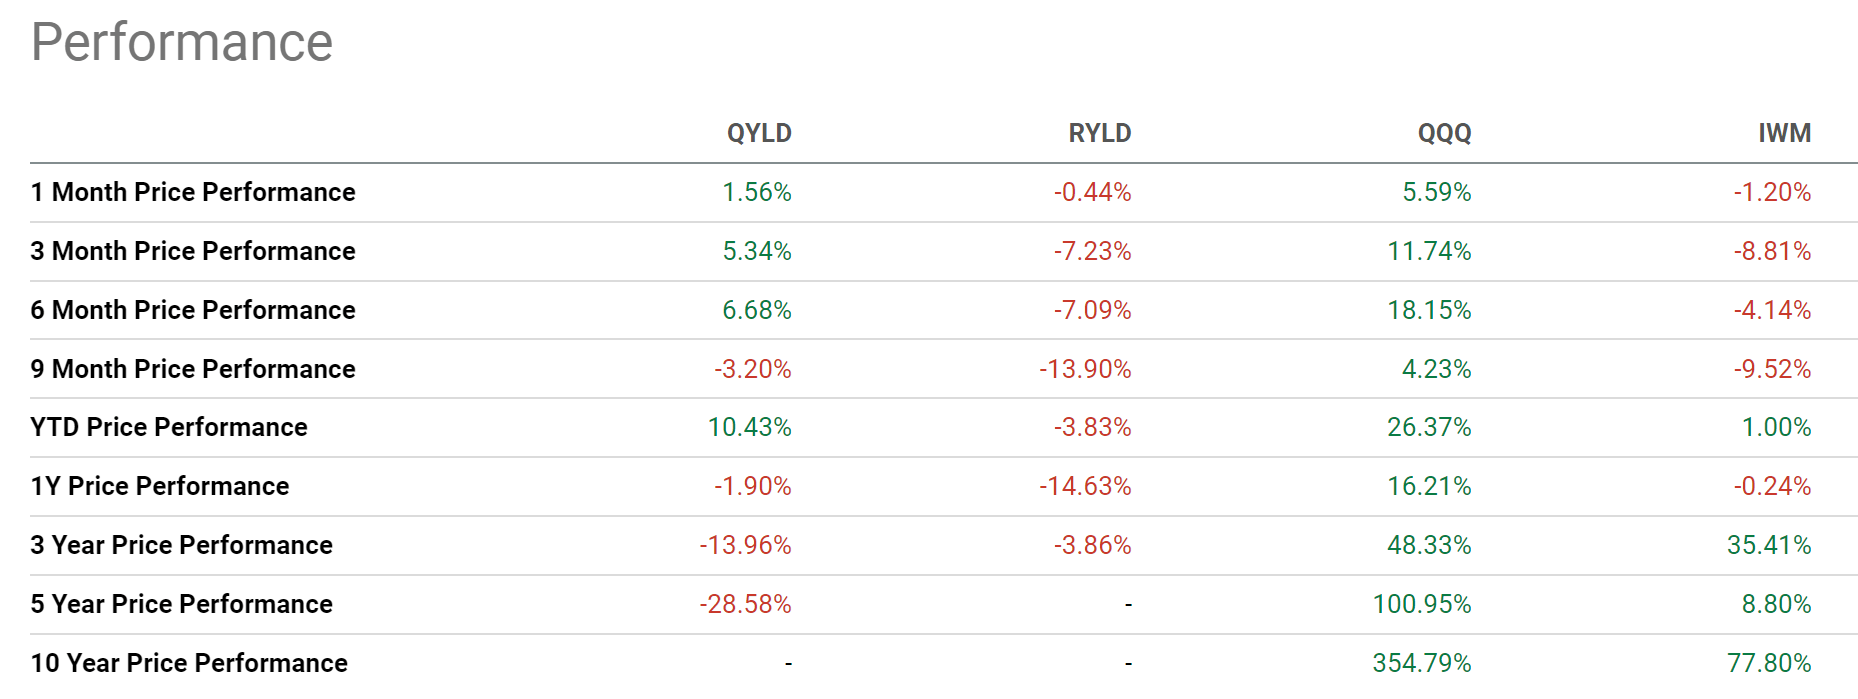
And finally, the covered-call strategy carries a generic risk of capping the upside potential. Mainly for this reason, RYLD and QYLD have historically underperformed their underlying indices (approximated by IWM and QQQ, respectively) in the long term, as you can see from the chart below. Moreover, as detailed in my earlier articles , growth-oriented sectors (such as the tech sector and small caps) have historically enjoyed their best periods of growth when volatilities are low. As such, I only recommend them as tactical holdings when the odds are too favorable to ignore (like QYLD in June 2022). And currently, given the combination of narrow YS and quieter volatility, I see the opposite: I see the odds to be severely against these covered call ETFs.
For further details see:
QYLD And RYLD: Yield Spread Narrowed And Ratings Downgraded