QYLD - QYLD: Attractive Yield And Tax Benefits
2023-10-01 03:50:42 ET
Summary
- The Global X NASDAQ 100 Covered Call ETF seeks to generate income through selling at-the-money covered calls on companies in the Nasdaq-100.
- The fund retains a portion of the premium it collects to mitigate long-term erosion and has a history of paying distributions in the form of return of capital.
- Its volatility can be hedged by taking on a short position in TQQQ.
- I currently rate QYLD as a Buy.
Thesis
Although I have been a growth investor for many years now, I am looking toward retirement and have included high-yield assets in my research. I am currently searching for potential targets to use in a margin portfolio. I have found covered call ETFs particularly attractive because they are typically chosen on tickers that are popular enough that they have leveraged ETFs and so can be hedged fairly easily.
I wrote an article a few weeks ago on Global X's Russell 2000 Covered Call ETF ( RYLD ), and found it appealing. I will also probably examine their S&P 500 Covered Call ETF ( XYLD ) at some point, but today I am taking a look at their NASDAQ 100 Covered Call ETF ( QYLD ).
Although many covered call ETFs do not produce extremely appealing total returns, this family of funds has a history of handing out most of its distributions as Return Of Capital. I do not believe they have a place in a Roth IRA, but this makes them particularly attractive for anyone wanting to own them in a non-tax advantaged account. After reviewing their holdings and the mechanics behind how yield is generated, I currently rate QYLD as a Buy.
Fund Background
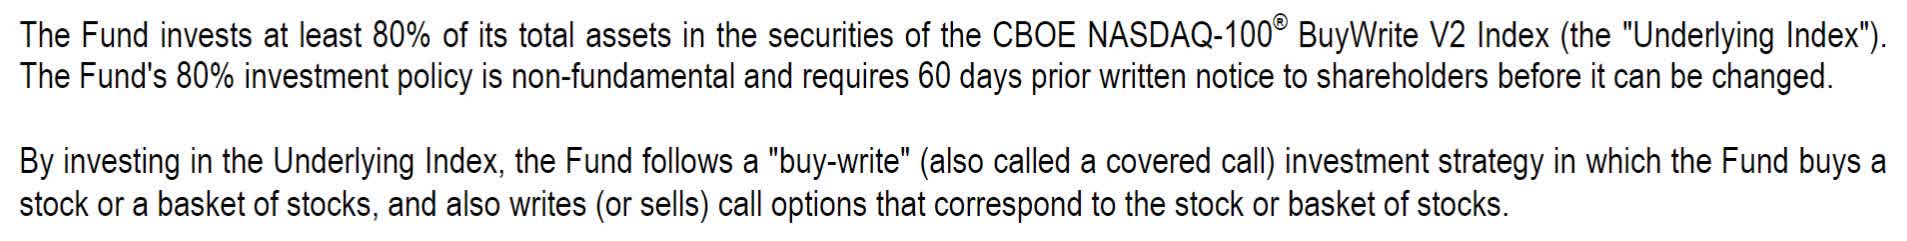
Global X NASDAQ 100 Covered Call ETF is an exchange traded fund which generates yield through what is often referred to as either a covered call or a buy-write strategy. QYLD's prospectus indicates that they hold at least 80% of total assets in CBOE NASDAQ-100® BuyWrite V2 Index.
QYLD Strategy (Globalxetfs.com QYLD Prospectus)
Under some market conditions, the fund can pay a portion of their distribution as Return of Capital. QYLD currently has an annual operating expense ratio of 0.60% .
Holdings
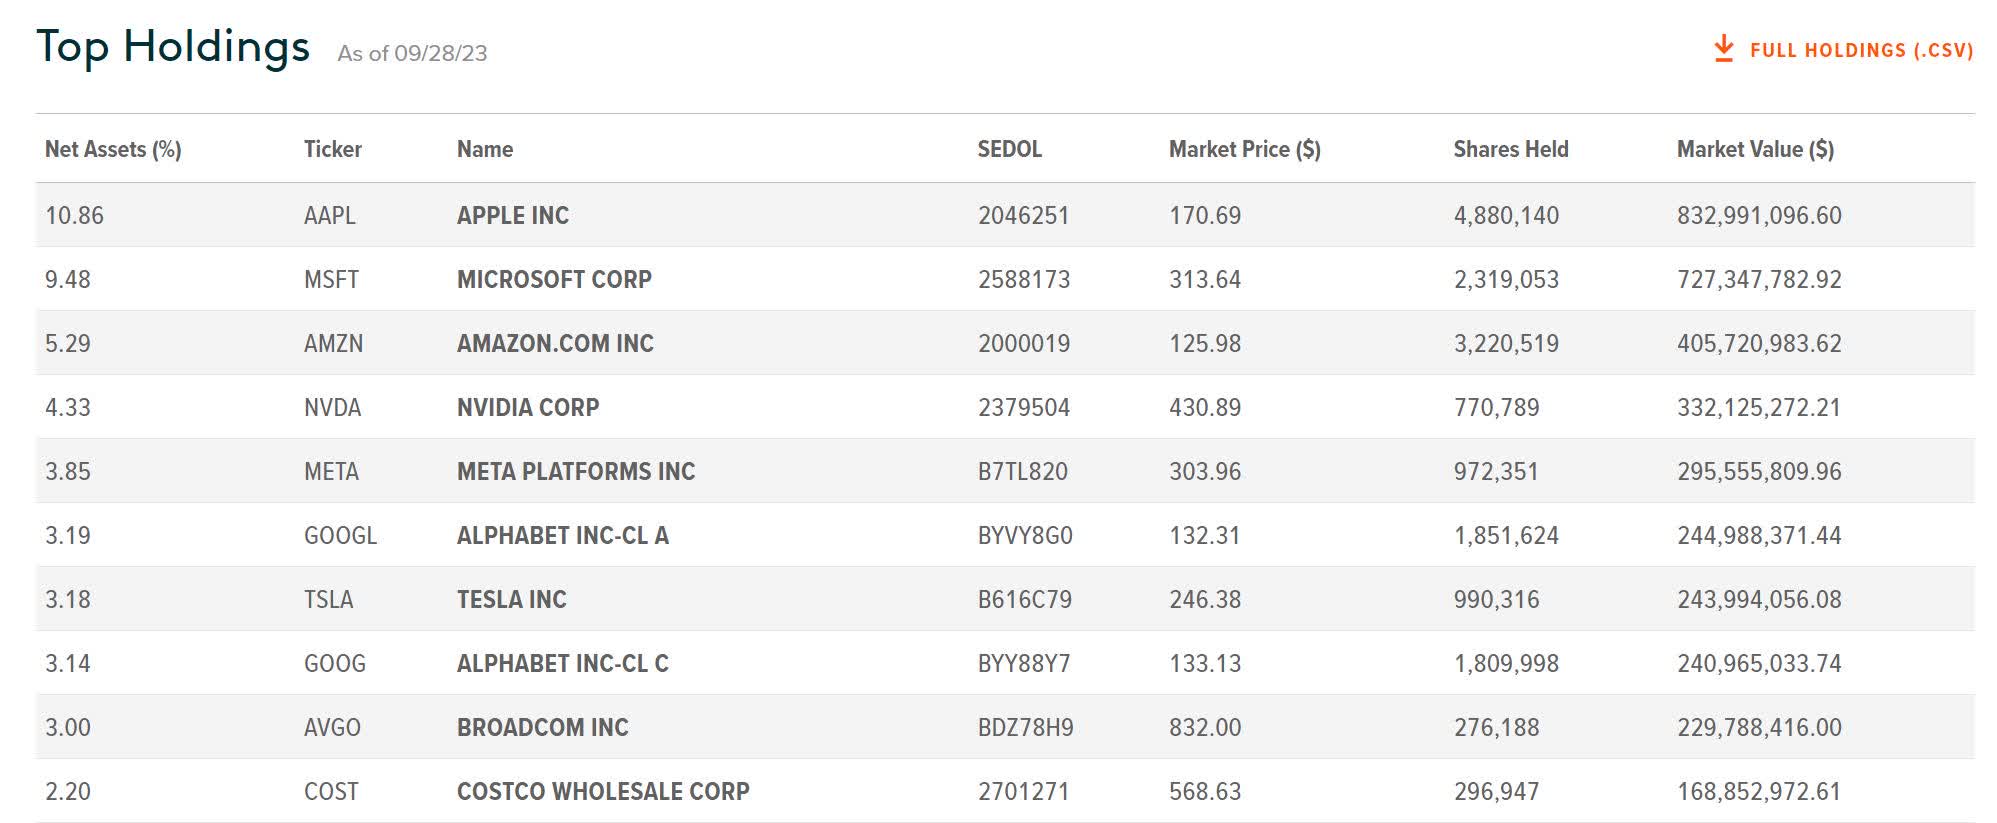
Here are QYLD's current list of holdings . as of 9/28/2023.
QYLD Top Holdings (Globalxetfs.com)
Distribution History
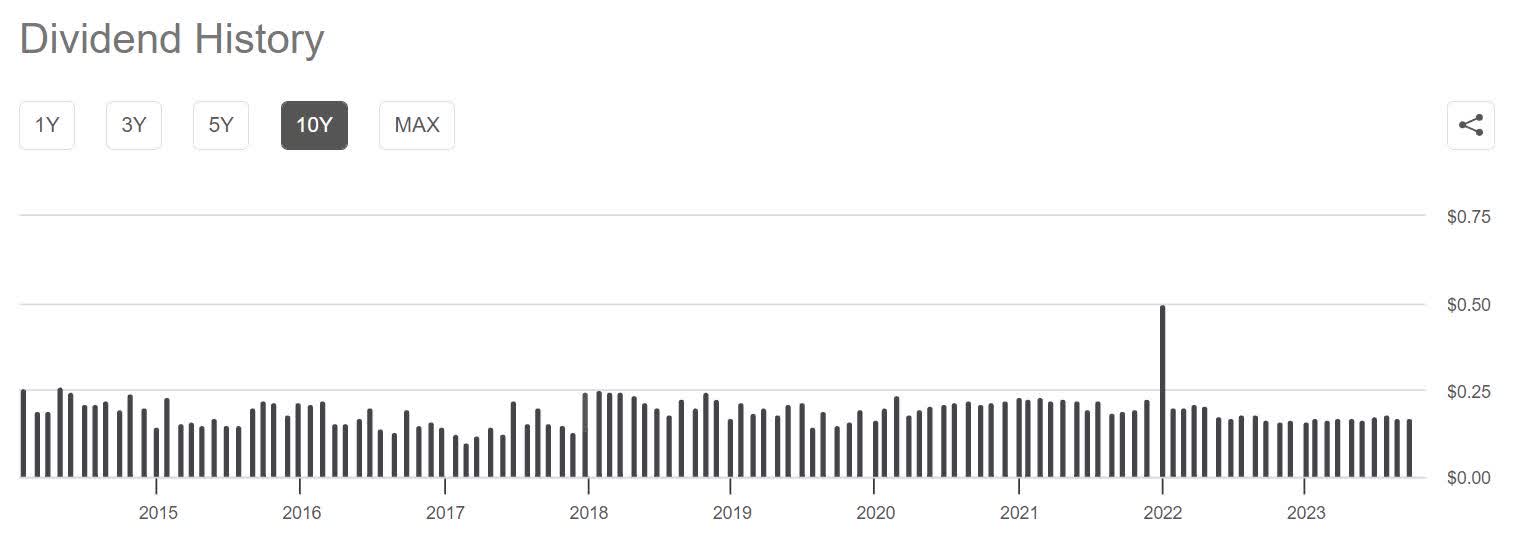
Although variable, the fund pays a fairly stable distribution. Their trailing annual yield is currently at 12.16%
QYLD Distribution History (Seeking Alpha)
NAV Erosion
Covered call strategies are known for experiencing a decay of their Net Asset Value over longer periods. After watching interviews with the fund manager, it became clear that Global X mitigates this somewhat by handing out partial distributions which are set up so the fund is able to retain some of the premium. Each month, the fund either pays half the value of the premium they collected, or 1% of NAV, whichever is lower . From the QYLD shareholders point of view, this is similar to reinvesting only a portion of their distributions. When compared to other covered call strategies, this method of partial distribution has done a fairly good job of slowing erosion while still producing positive total returns.
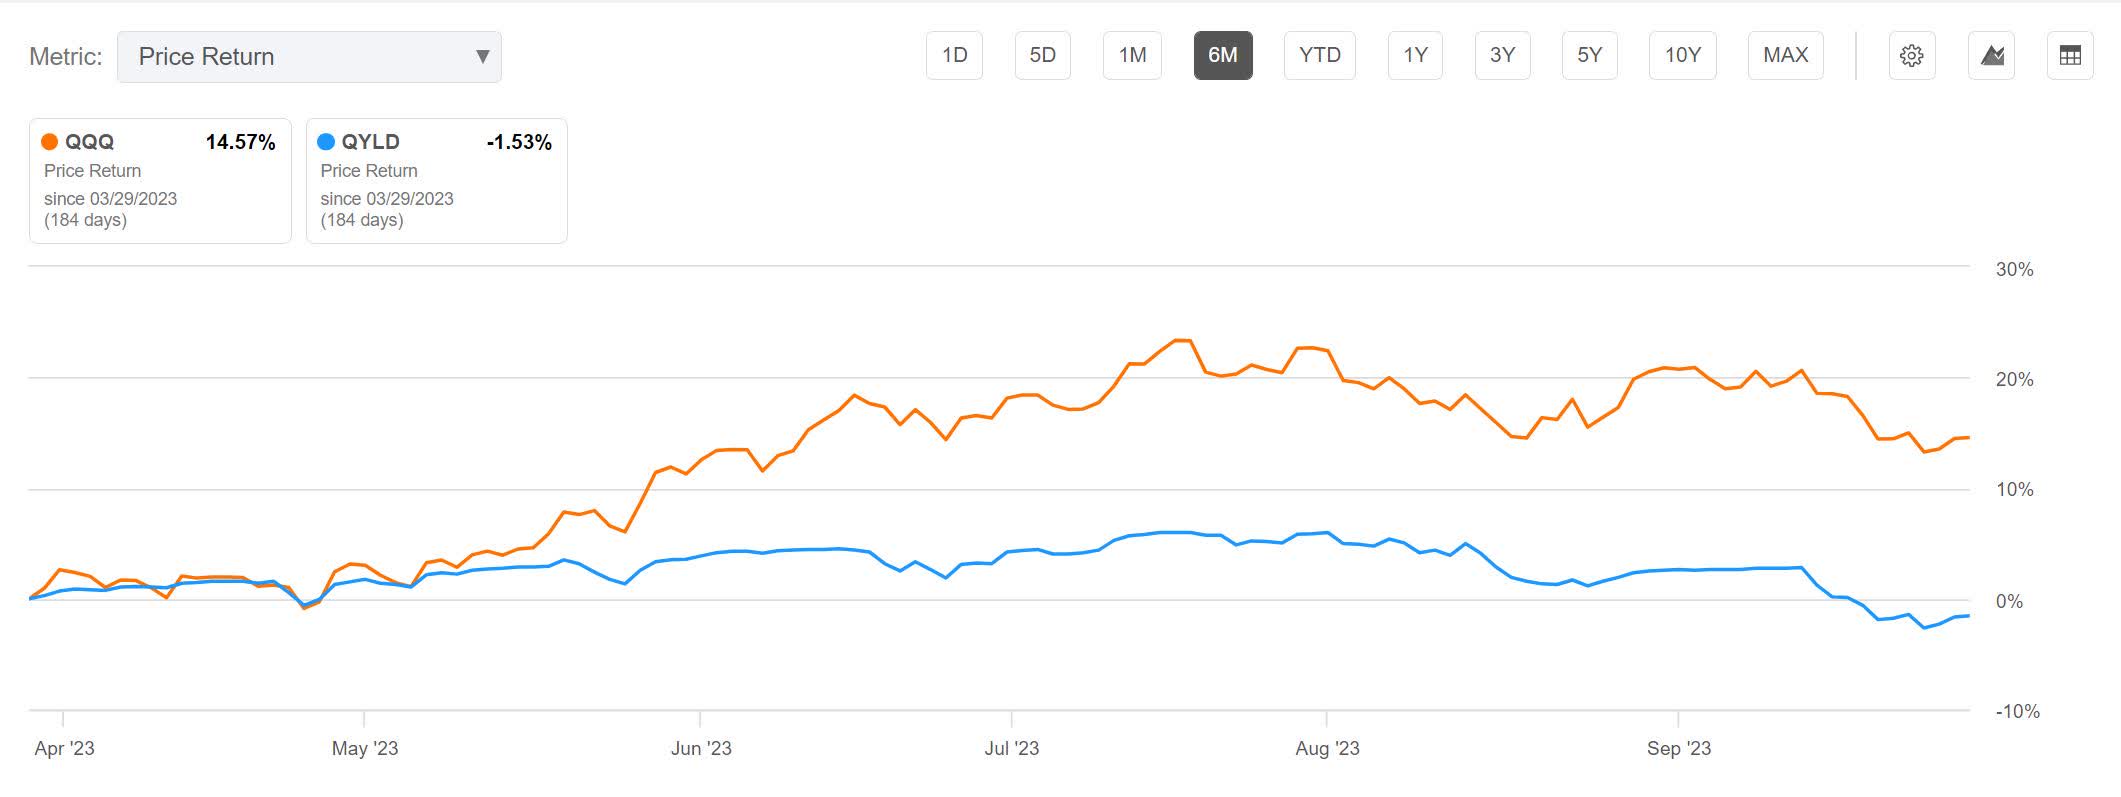
For reference, I am using Invesco QQQ Trust ETF ( QQQ ) as it also seeks to gain broad exposure to the Nasdaq-100. When viewing QYLD price return basis over the last 6 months, it is down 1.53%.
QYLD 6 Month Price Return (Seeking Alpha)
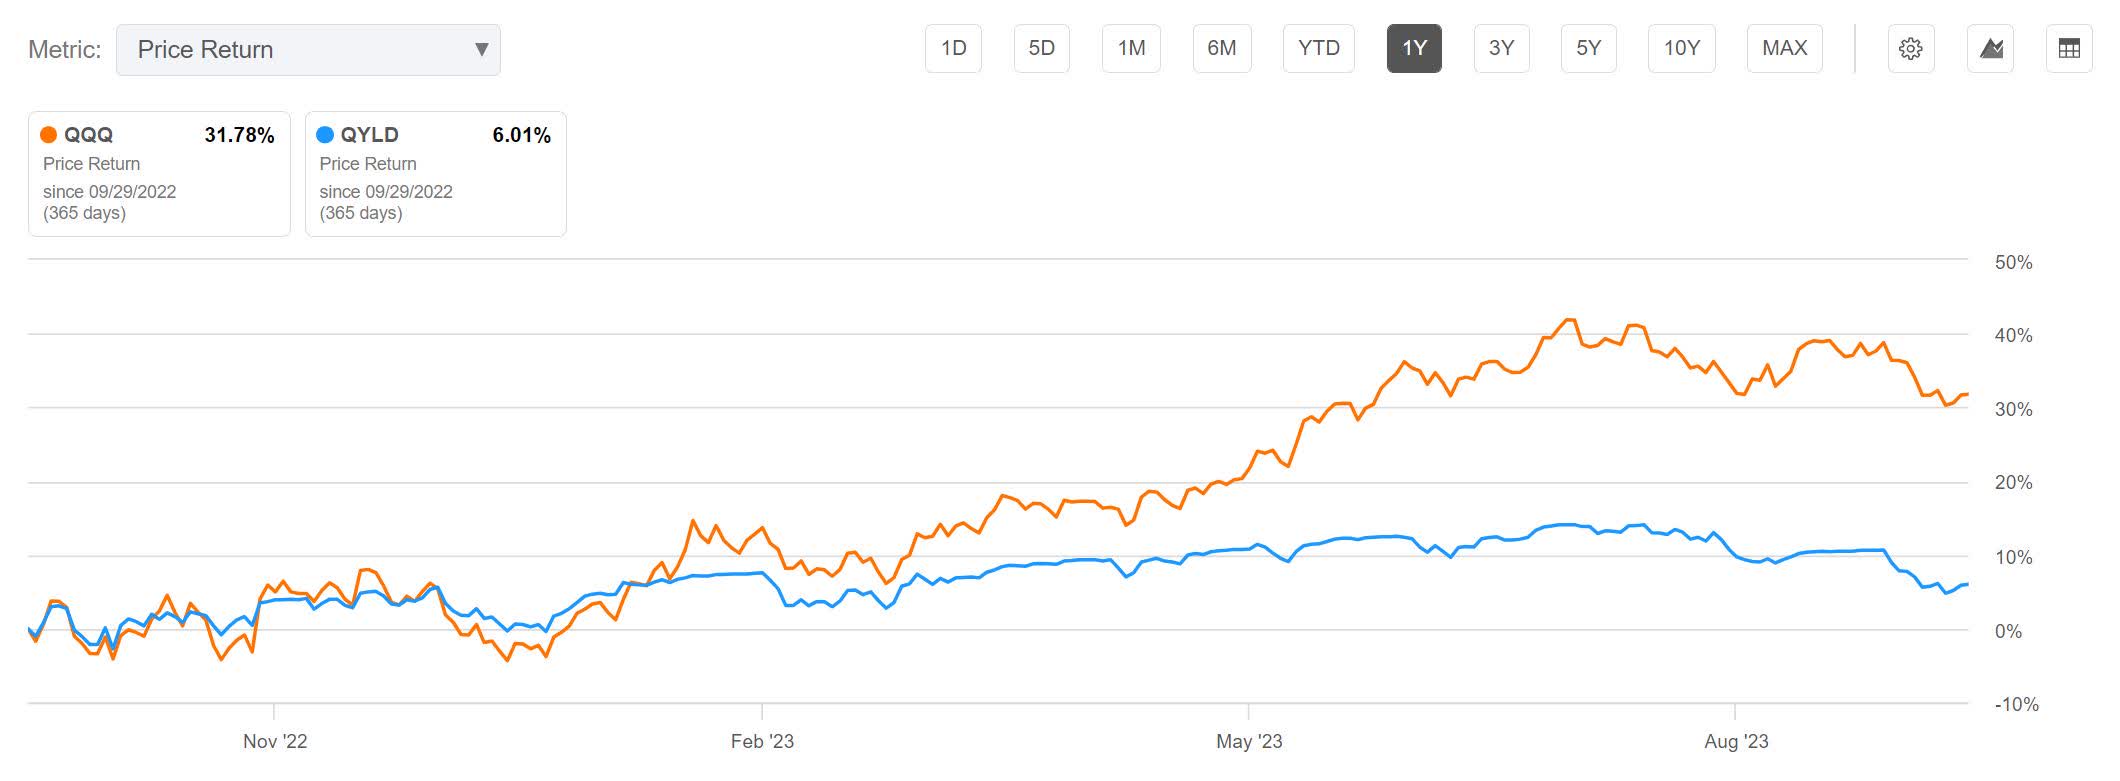
Over the last year, it is up 6.01%.
QYLD 1 Year Price Return (Seeking Alpha)
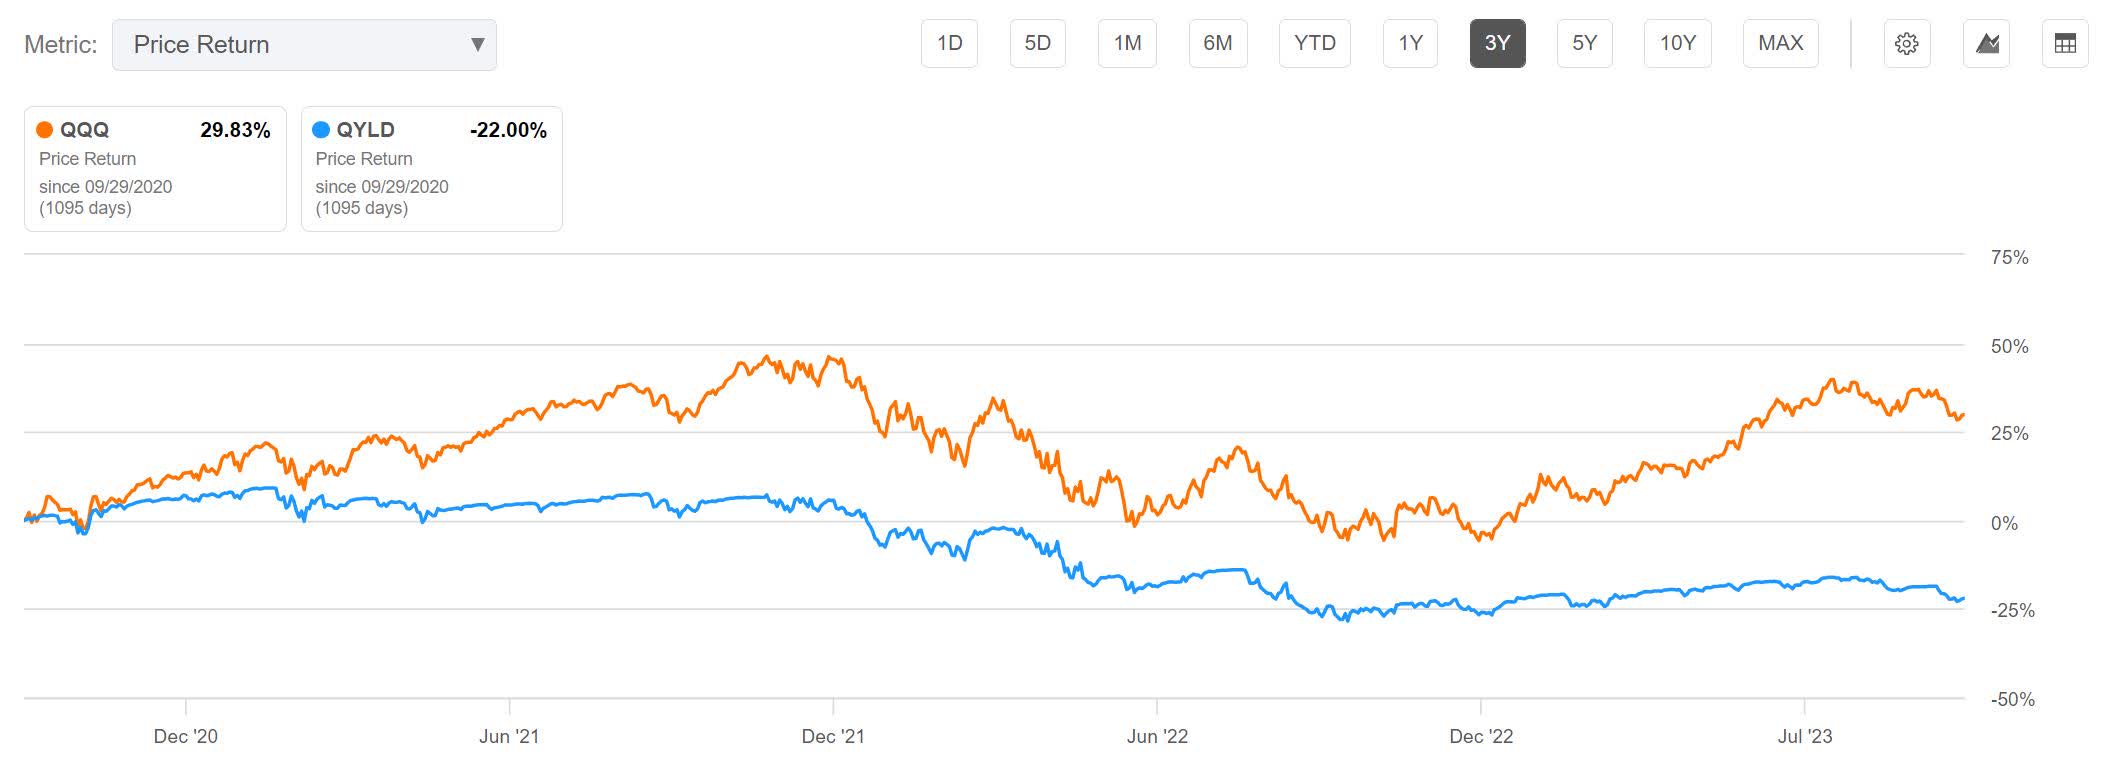
Over the last 3 years, it is down 22%.
QYLD 3 Year Price Return (Seeking Alpha)
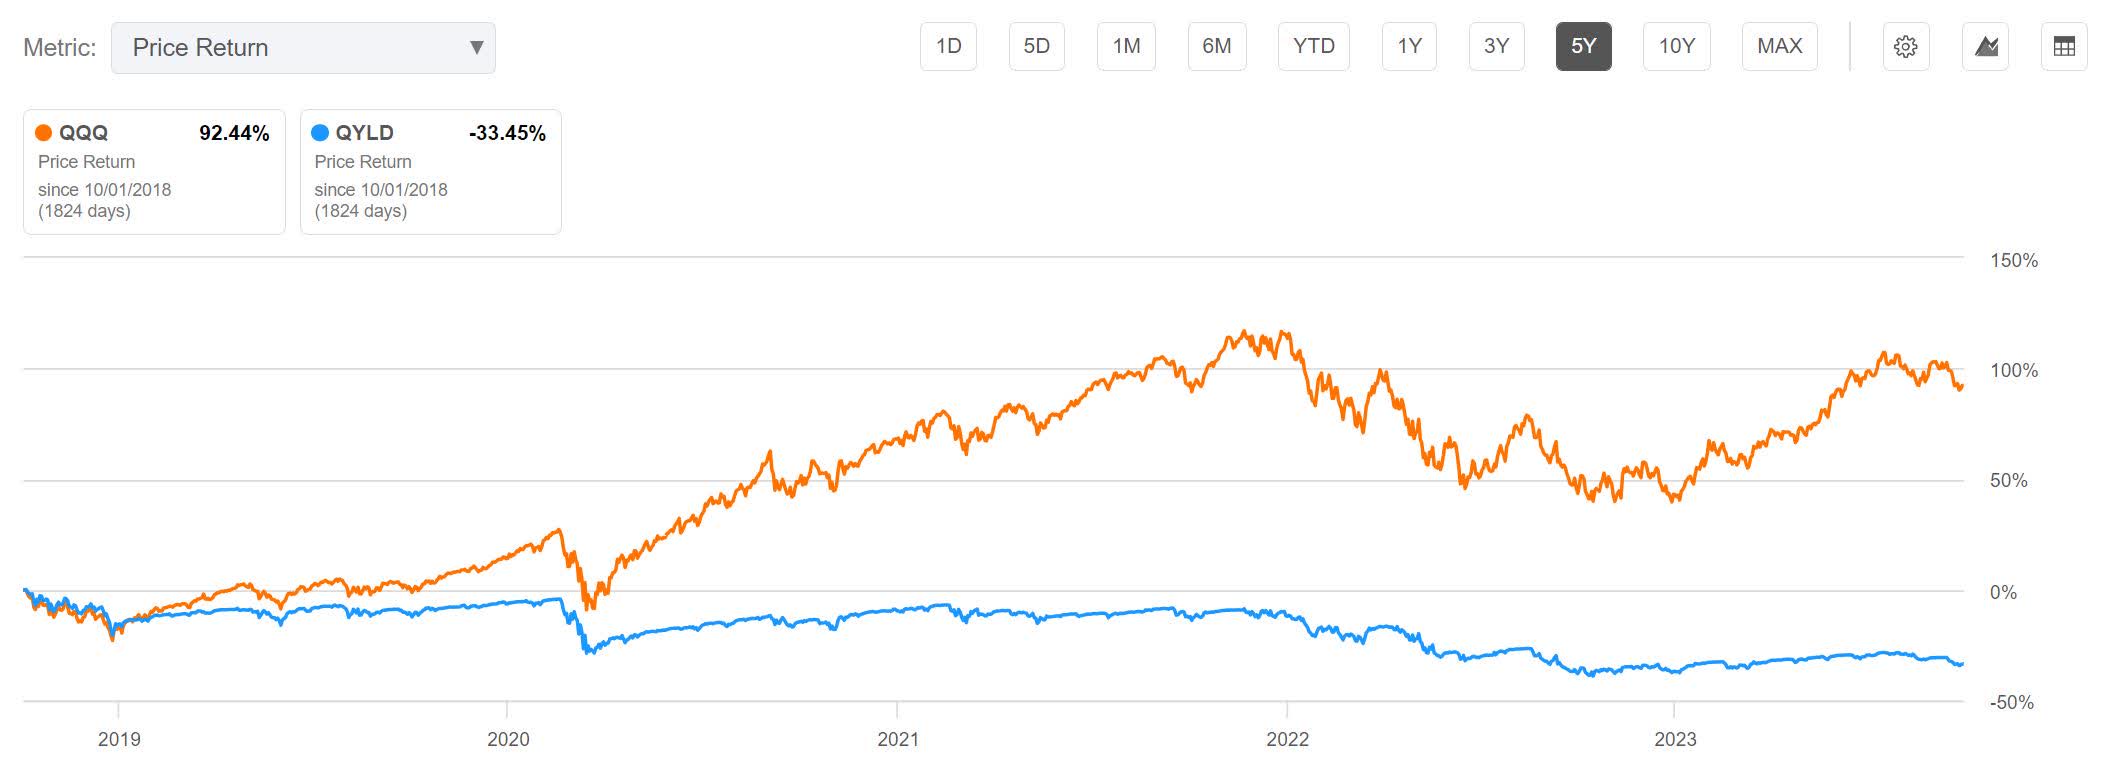
Over the last 5 years, it is down 33.45%.
QYLD 5 Year Price Return (Seeking Alpha)
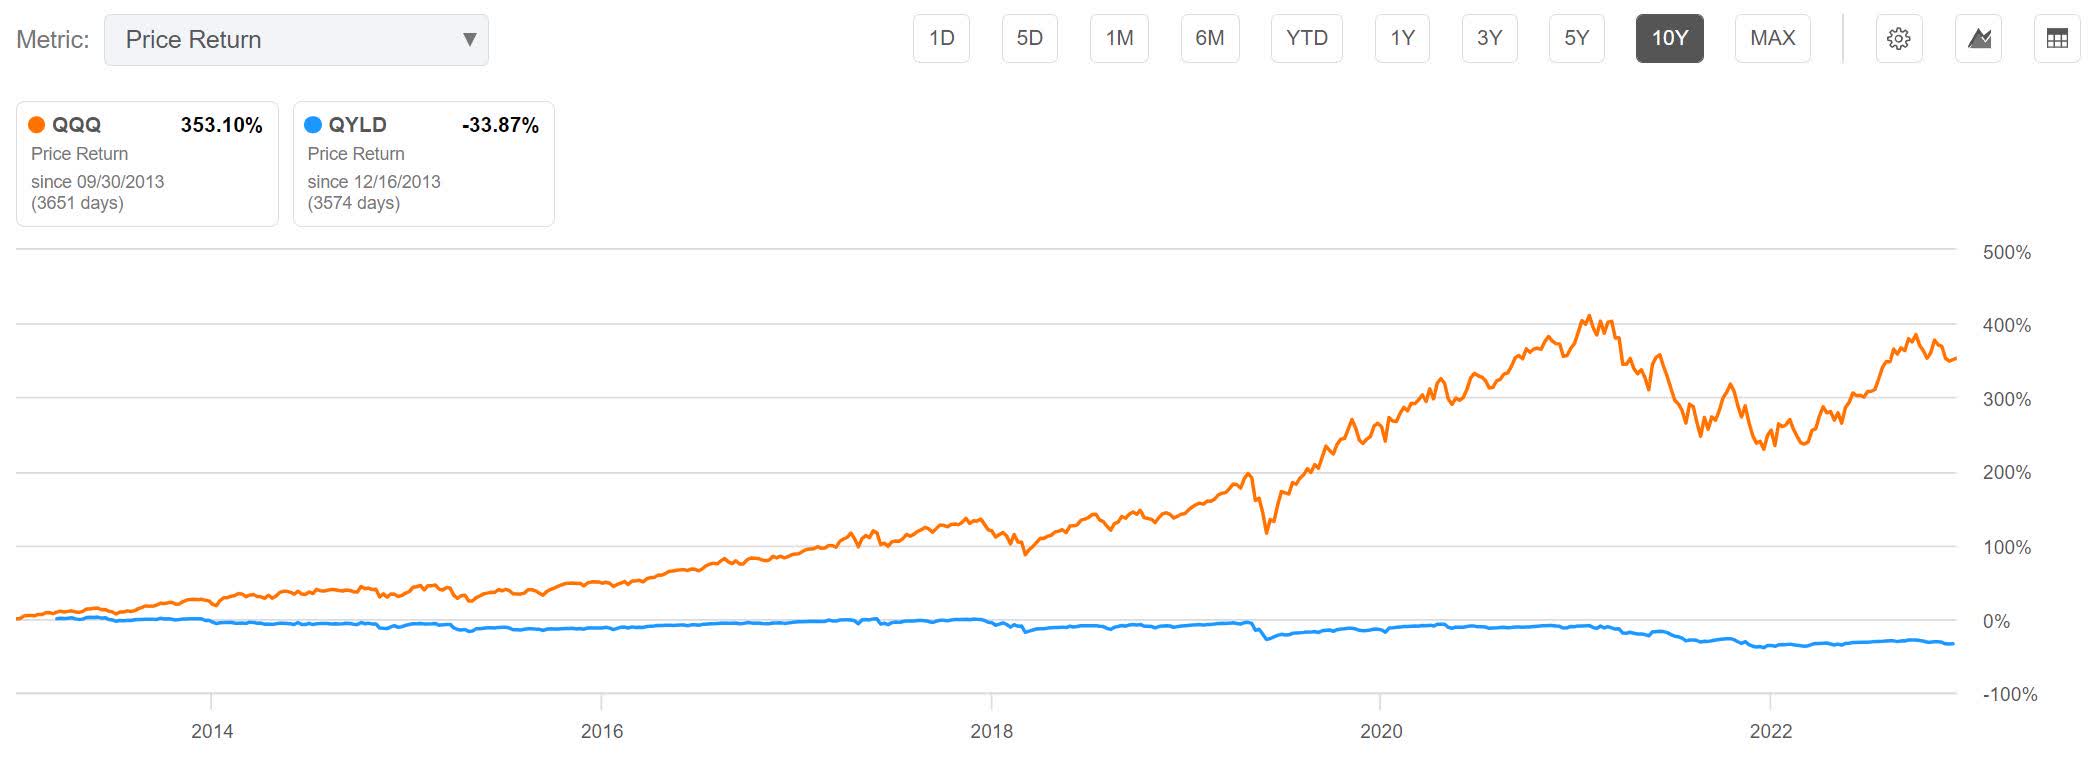
Over the last 10 years, it is down 33.87%.
QYLD 10 Year Price Return (Seeking Alpha)
Total Returns
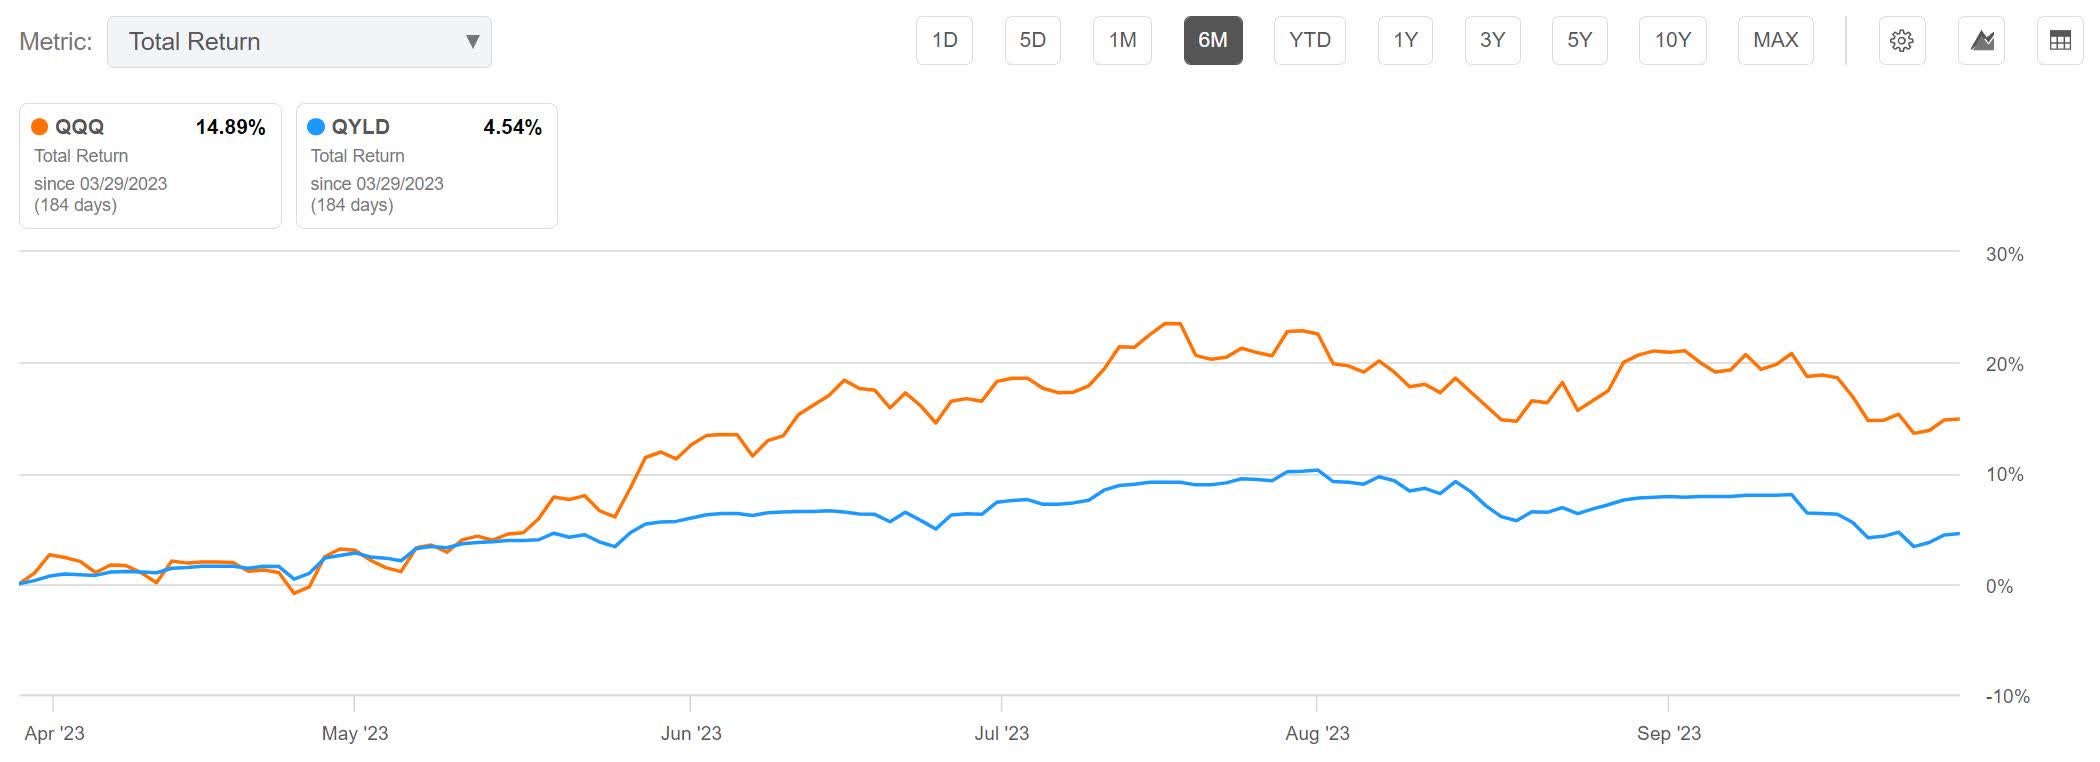
When comparing QYLD to QQQ on a total return basis over the last 6 months, QYLD is up 4.54%, but is lagging QQQ by 10.35%.
QYLD Total Returns 6 Months (Seeking Alpha)
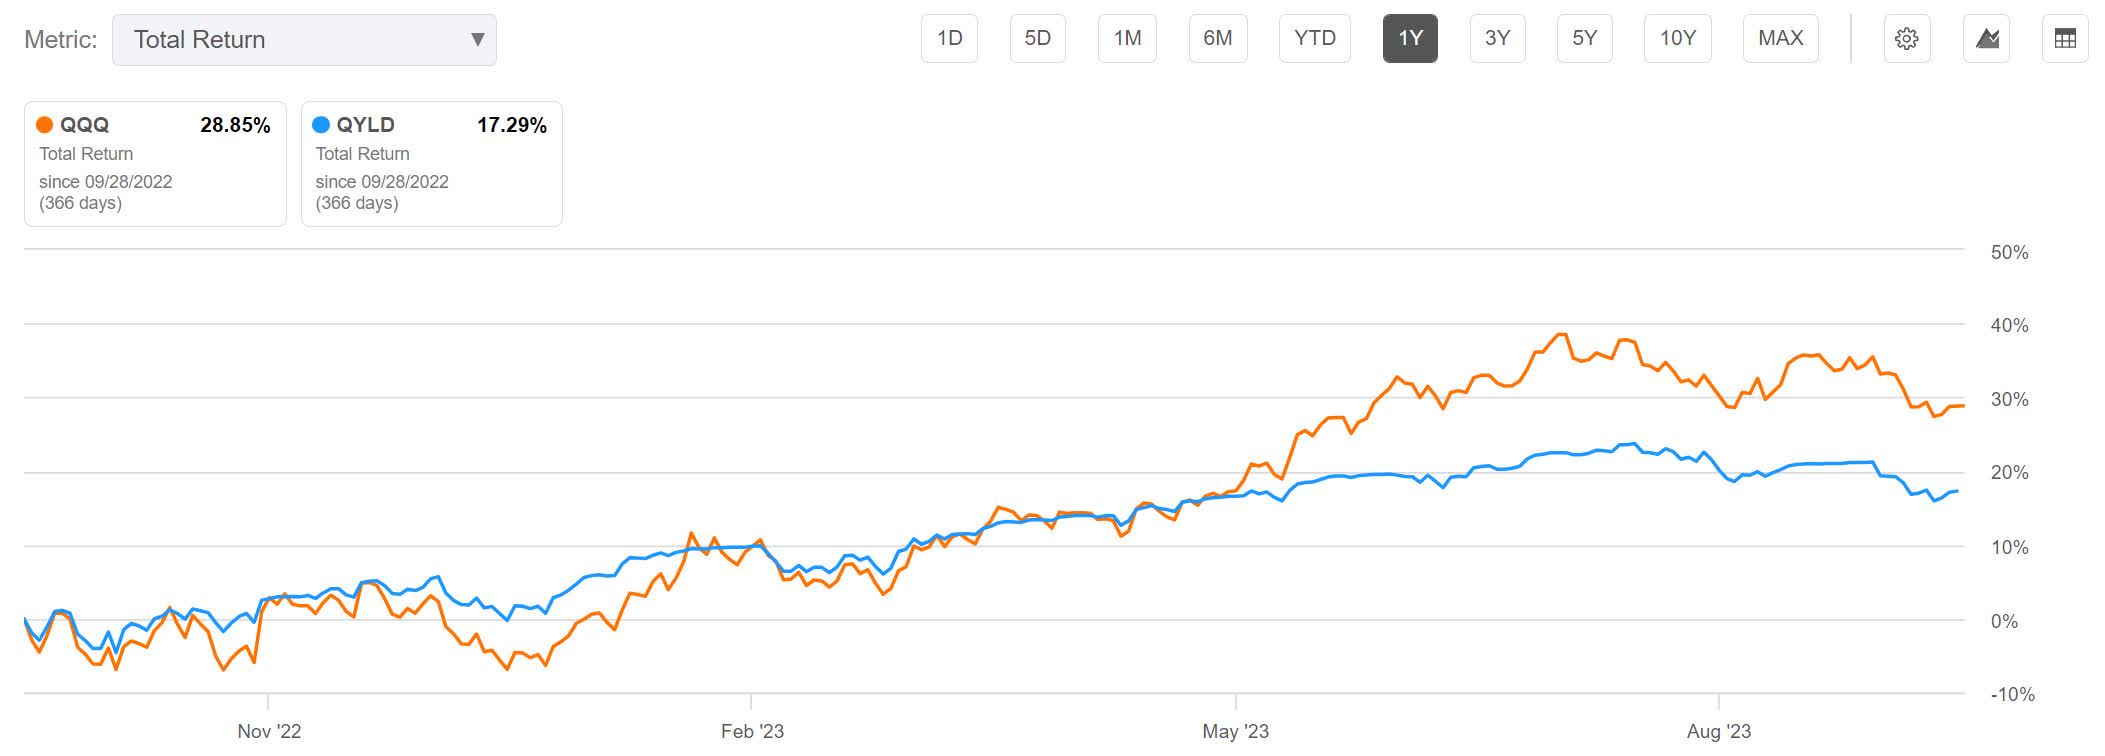
Over the last year, QYLD is up 17.29%, but is lagging QQQ by 11.56%.
QYLD Total Returns 1 Year (Seeking Alpha)
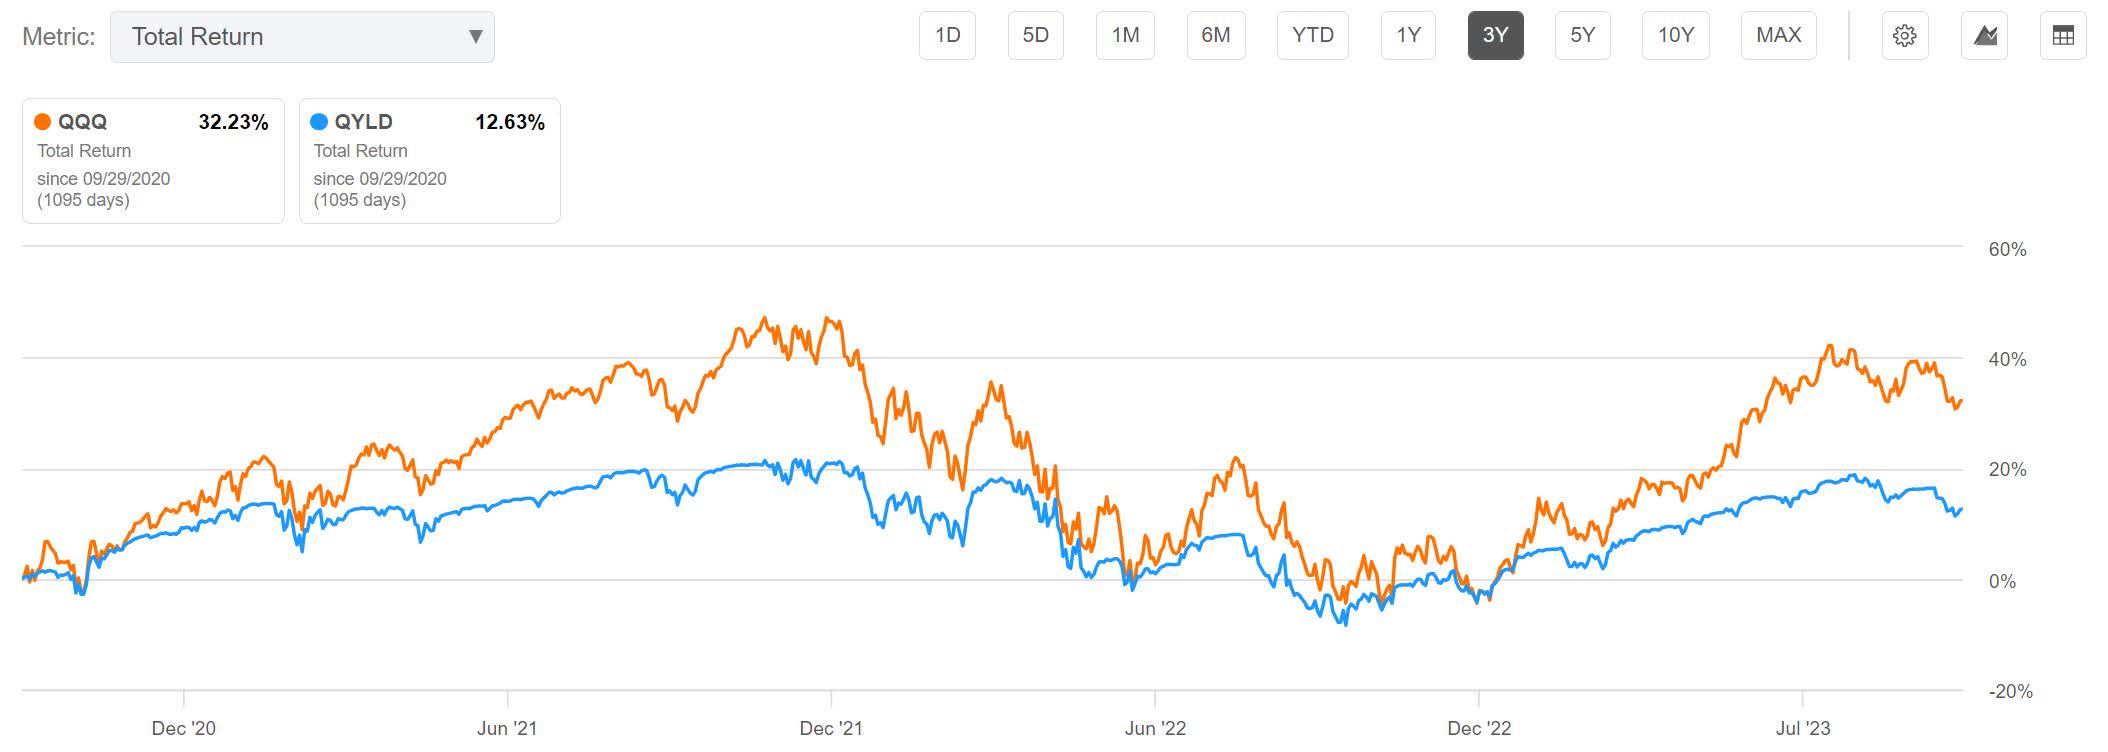
Over the last 3 years, QYLD is up 12.63%, but is lagging QQQ by 19.6%.
QYLD Total Returns 3 Year (Seeking Alpha)
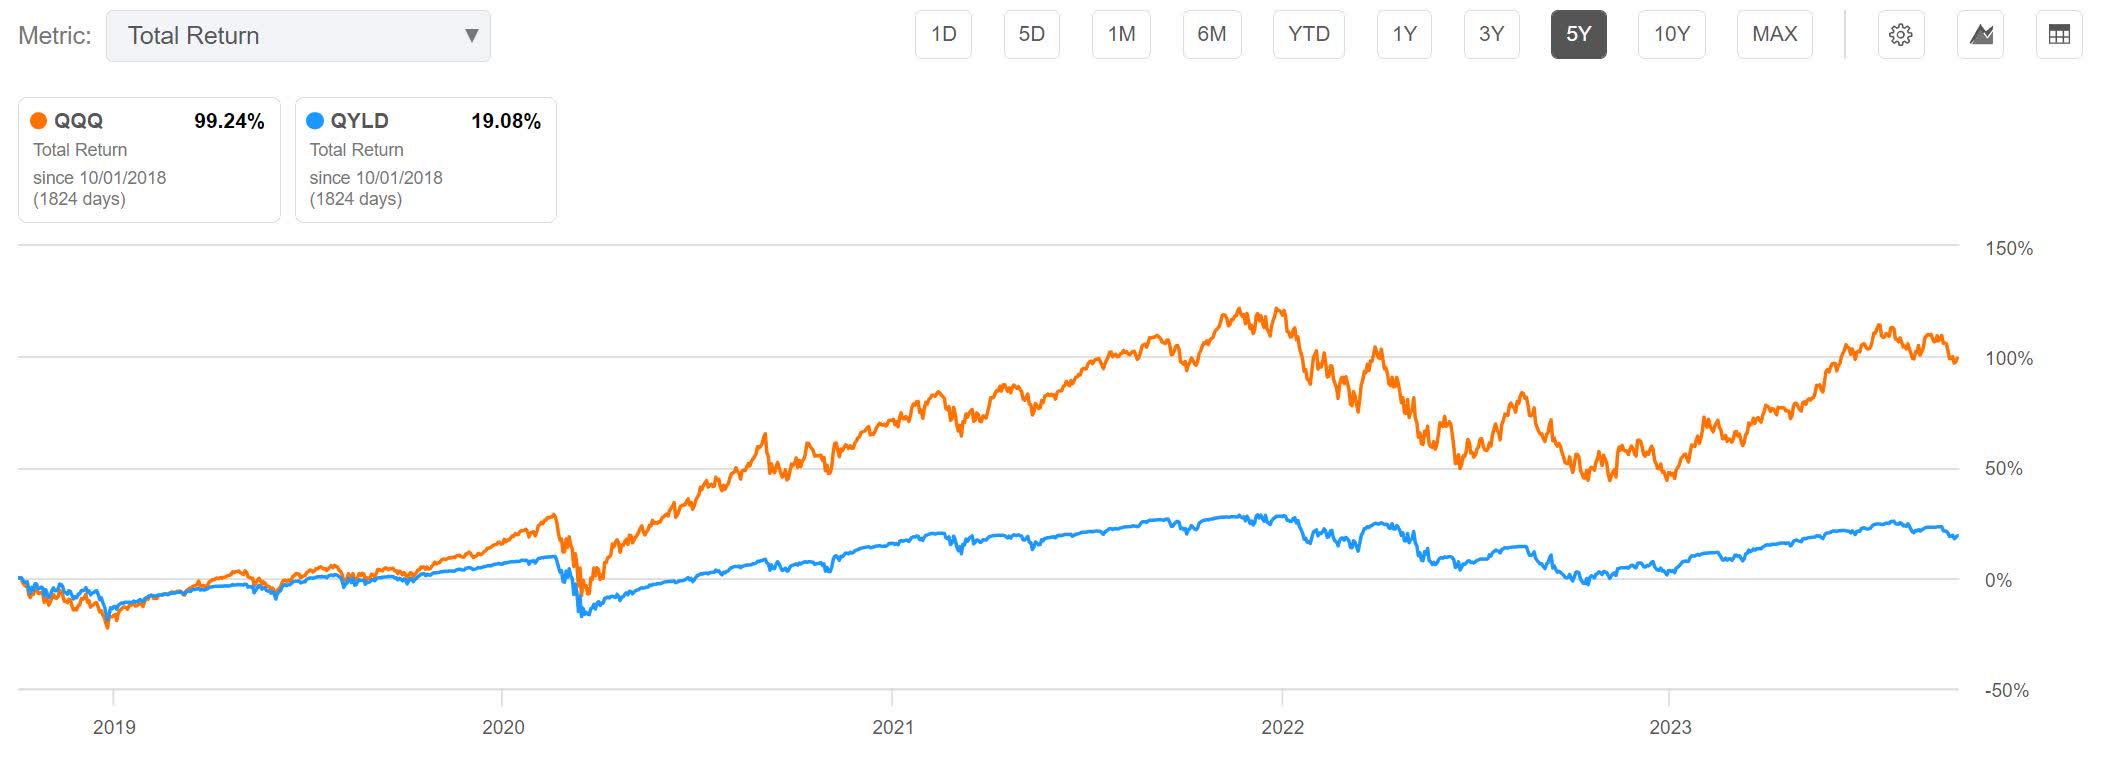
Over the last 5 years, QYLD is up 19.08%, but is lagging QQQ by 80.16%.
QYLD Total Returns 5 Year (Seeking Alpha)
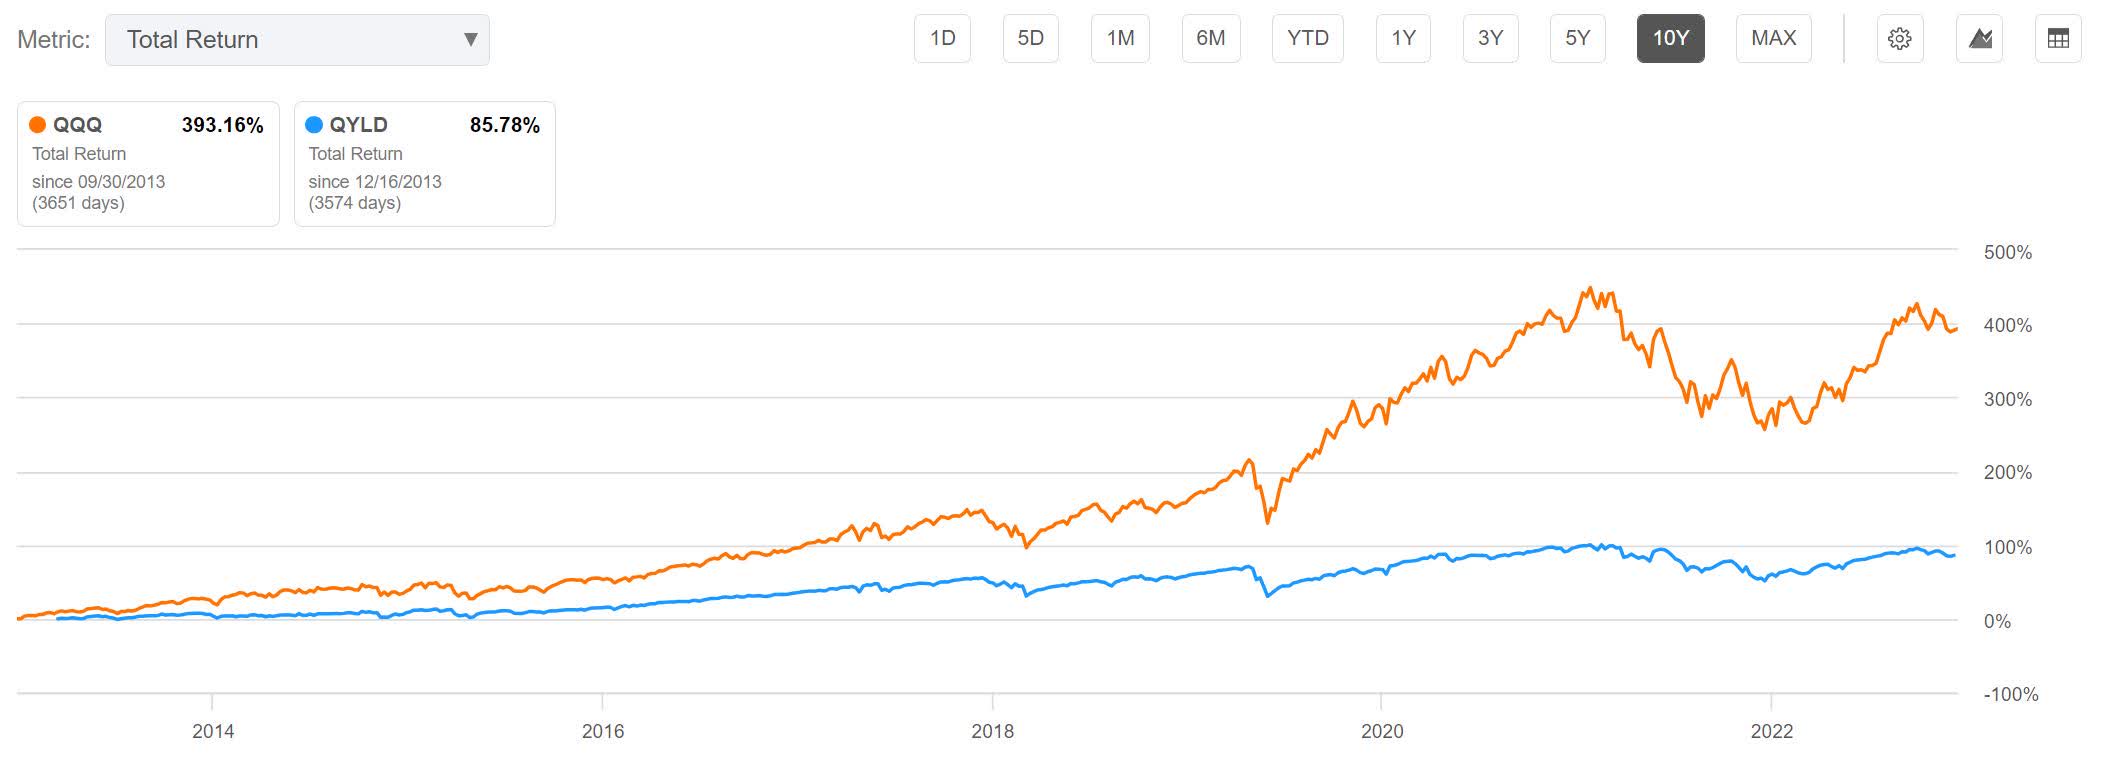
Over the last 10 years, QYLD is up 85.78%, but is lagging QQQ by 307.38%.
QYLD Total Returns 10 Year (Seeking Alpha)
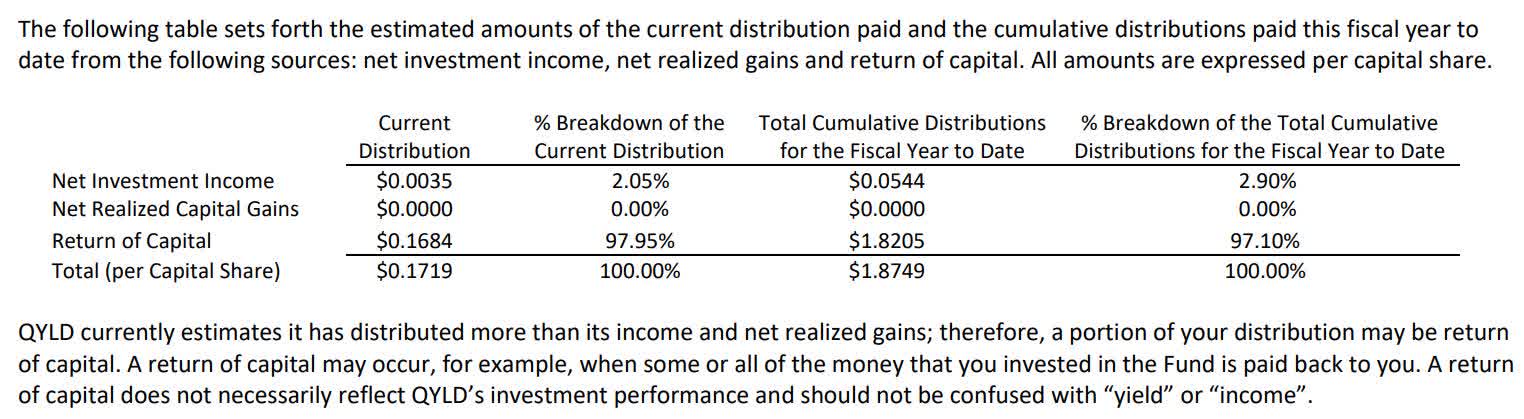
Tax Advantages
This fund is set up so that it is capable of paying a large portion of its distributions as Return Of Capital. The record of this appears in their monthly tax supplements . Their most recent distribution, 97.95% of it was Return Of Capital. Year-to-date, 97.1% of their distributions have been ROC.
QYLD Sept. 2023 Distribution Breakdown (QYLD 09.18.2023 Form 19a)
Hedging Volatility
Because I am considering using this in a margin portfolio, I must also look at ways to hedge it. A low-volatility couple can be formed by pairing QYLD with an inversely correlated position. I can keep the hedge small by using a leveraged ETF, and if I find one I can short, then its NAV erosion can work in my favor.
I need to note a warning about leveraged ETFs. While their daily performance is quite predictable, enough market participants have misunderstood their long-term behavior that the FINRA and the SEC have both issued warnings. Leveraged ETFs also experience long-term NAV erosion, but for very different reasons than covered call ETFs. Because they are designed to match the daily performance of their underlying with a higher beta, they sacrifice the ability to stay correlated over longer timeframes. If their underlying goes down by 10% one day, it will have to go up by 11.111% from that point to reach its previous value.
0.90*111.111 ~ 100
Over that same time the triple leveraged ETF tied to it will have moved down by 30 and then back up by 33.333%, leaving it 6.67% below its previous value.
0.70*133.333 = 93.33
Again, because of the difference in beta, any time the underlying they are tied to experiences a move away from a value and then back to that same value, leveraged ETFs will find themselves at a different end value.
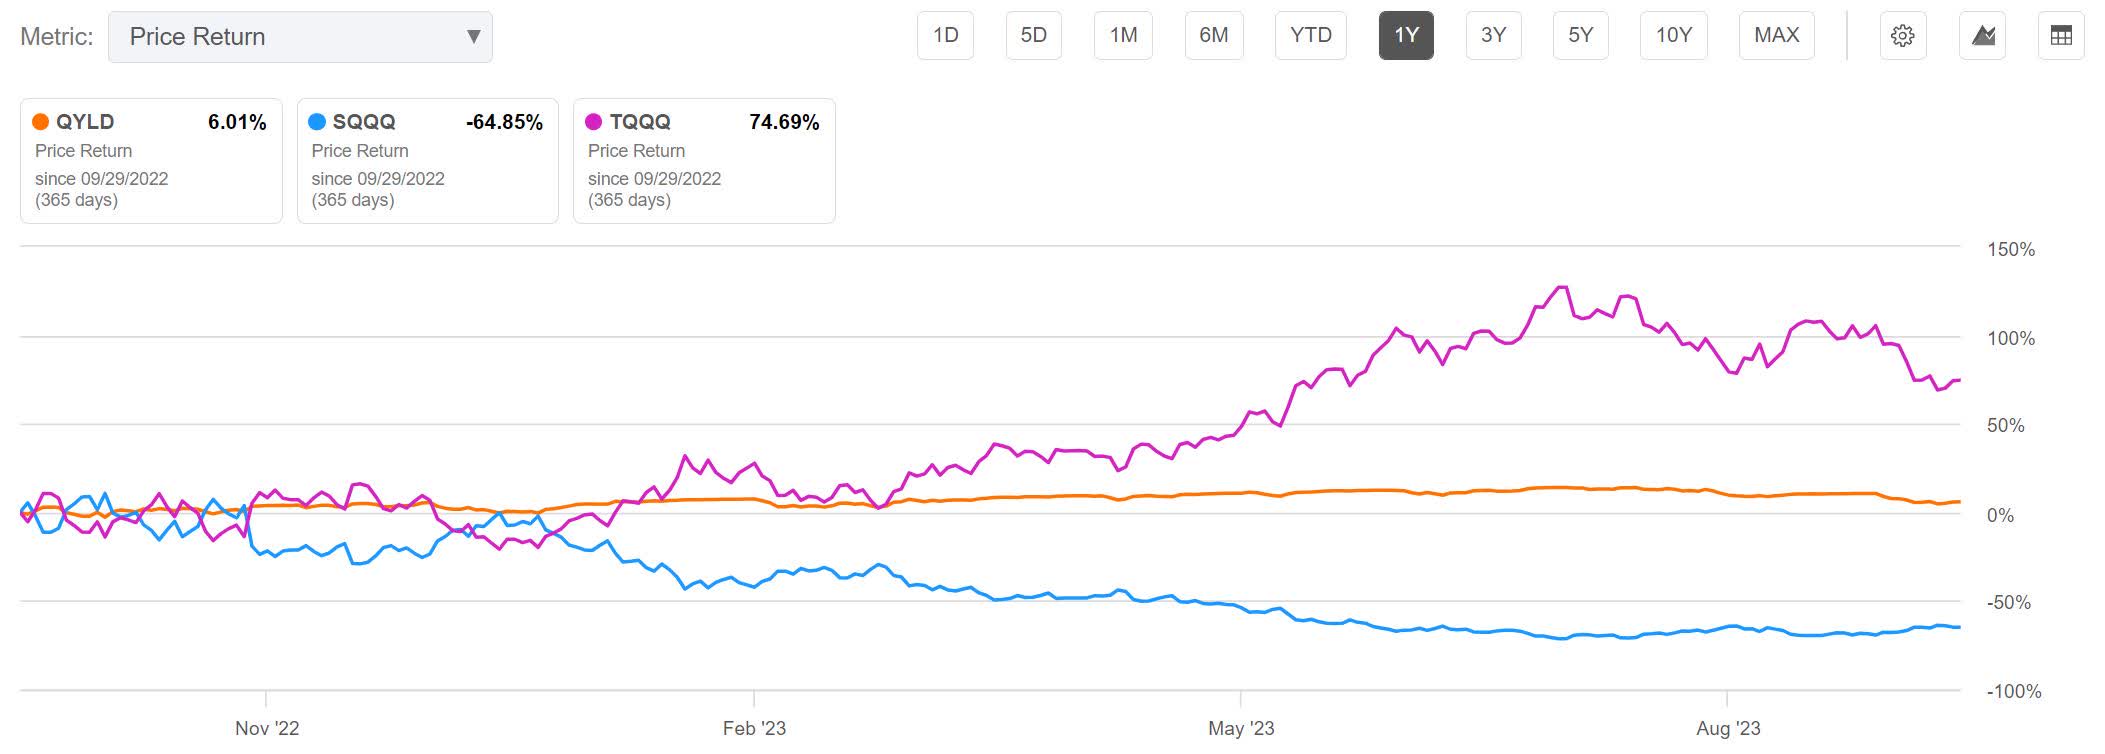
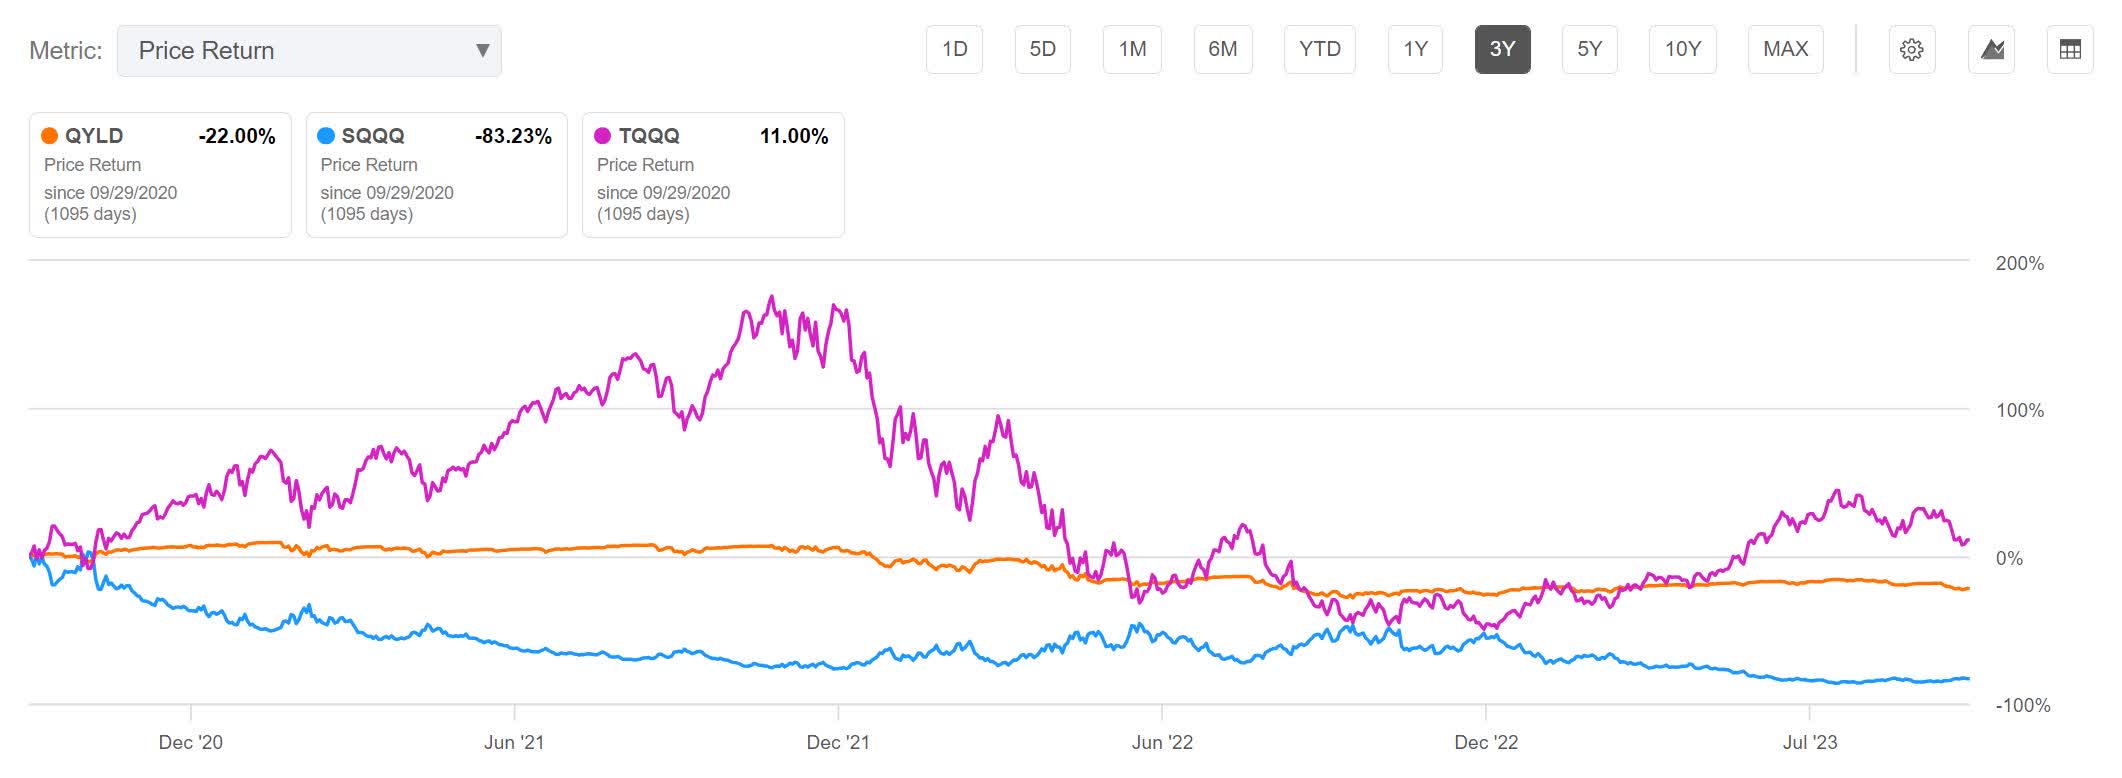
The Couple
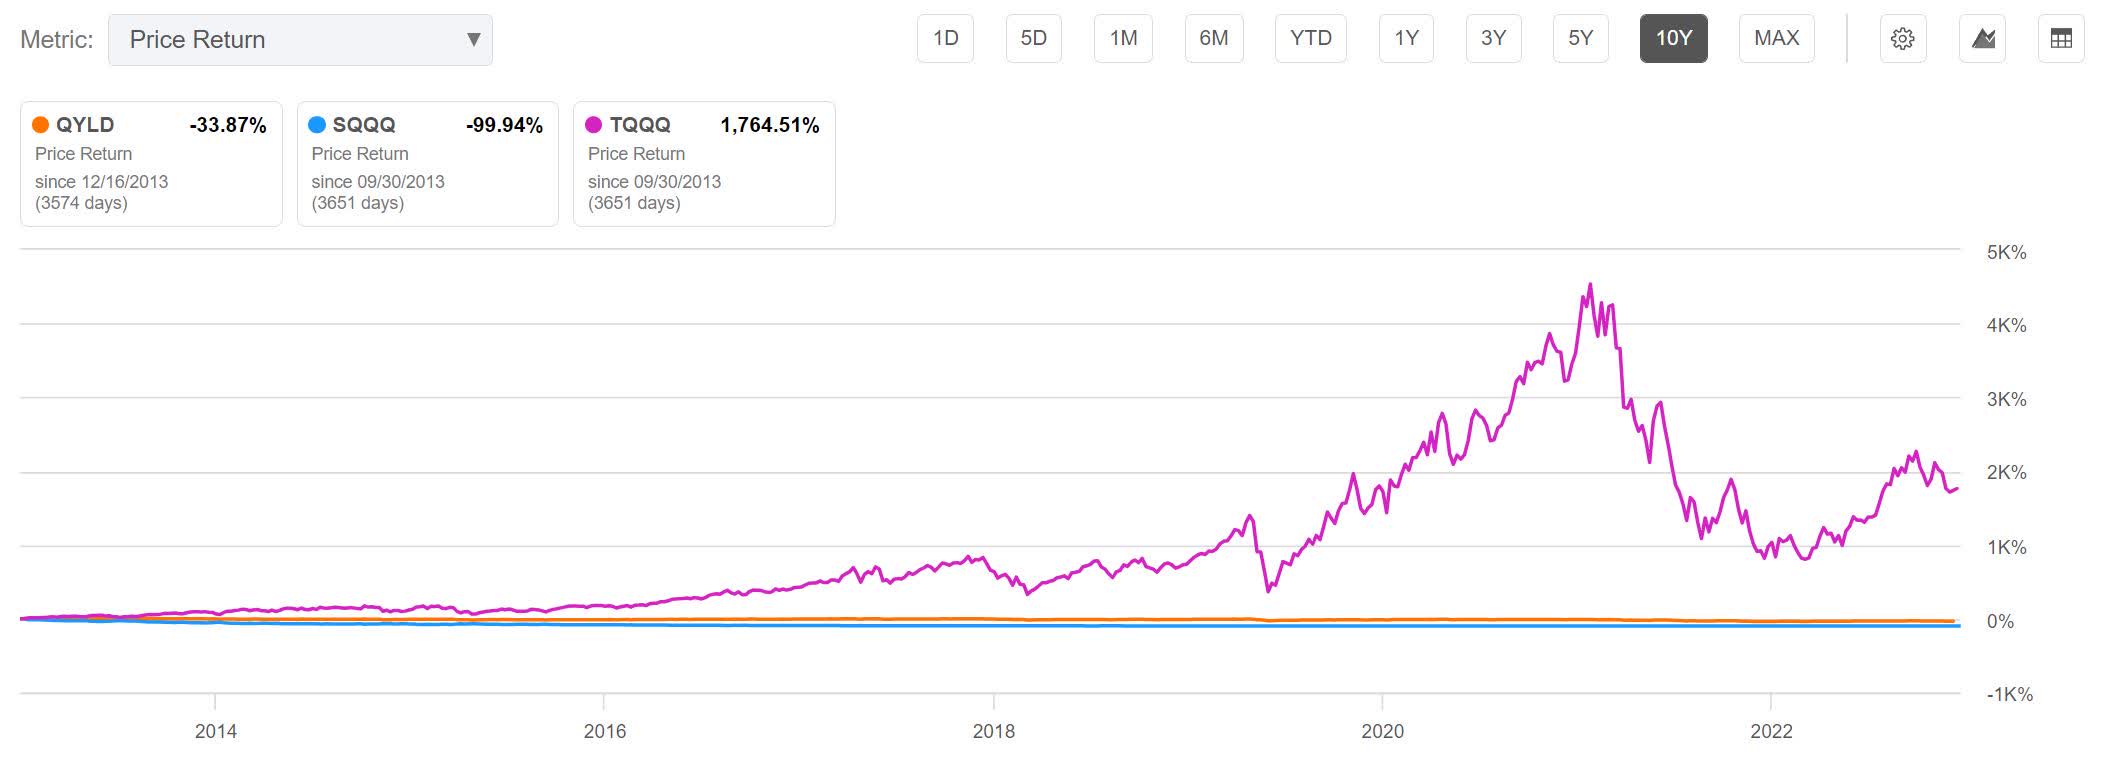
Because they are both corelated to the QQQ, I am looking at ProShares' UltraPro QQQ ETF ( TQQQ ) and their UltraPro Short QQQ ETF ( SQQQ ). As I covered in more detail in my recent article about forming a pairs trade by shorting both TQQQ and SQQQ , over shorter timeframes they are all highly corelated to the same underlying but slip out of cointegration over longer timeframes.
In order to mitigate QYLDs volatility, I would either need to be long SQQQ or short TQQQ. Both funds suffer from the same NAV erosion, but by shorting TQQQ its decay can work in our favor. This means I am going to ignore SQQQ and focus on TQQQ.
Because TQQQ has a history of going up dramatically over longer timeframes, I am expecting the value of this short position to decay over time. I am planning on rebalancing regularly, and expect to have to slowly put more money into the hedge over time.
QYLD vs. SQQQ vs. TQQQ 1 Year (Seeking Alpha) QYLD vs. SQQQ vs. TQQQ 3 Year (Seeking Alpha) QYLD vs. SQQQ vs. TQQQ 10 Year (Seeking Alpha)
Borrowing Fees
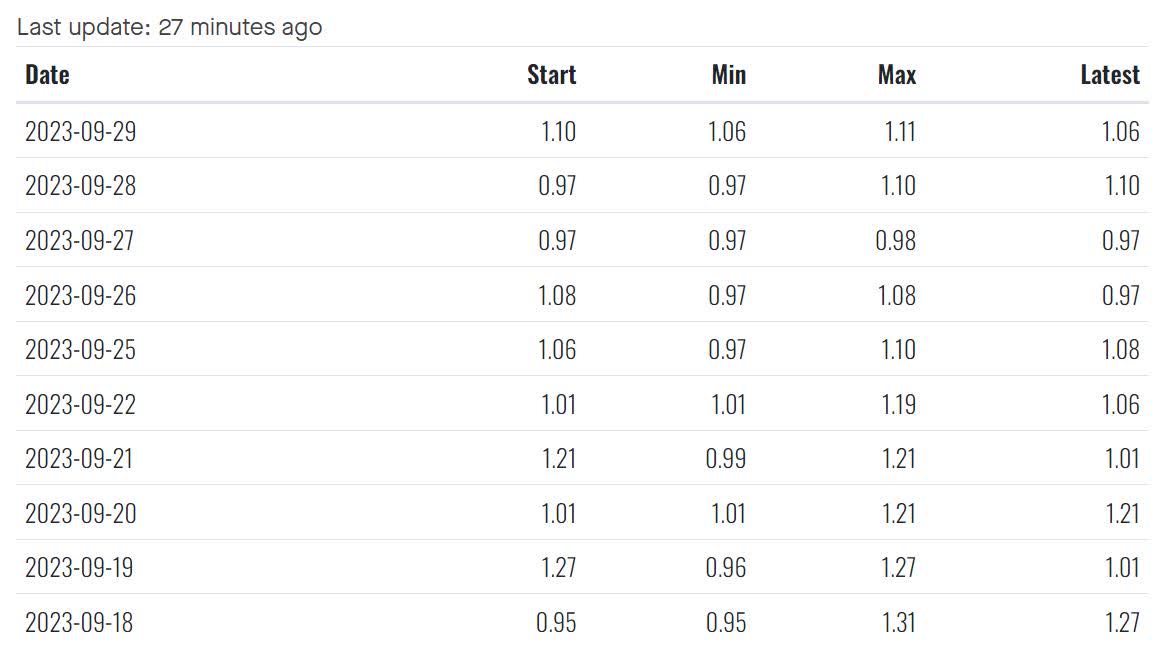
Using data from Fintel, TQQQ's average annual cost to borrow (using the 'Latest' column) is 1.074%.
TQQQ Cost To Borrow (Fintel.io)
Weighting
With QYLD having a lower volatility than the QQQ, and TQQQ designed to have a higher beta, I am not surprised that it doesn't take much TQQQ to hedge QYLD. My minimum variance calculator is showing me that the couple can achieve a variance of 0.1067 by shorting TQQQ with $139.51 for every $1000 one is long QYLD.
QYLD vs. TQQQ Weighting (By Author)
Risks
QYLD is exposed to downside risk from the potential of the Nasdaq-100 experiencing a significant downturn. Taking on a volatility hedge should help mitigate this risk.
The hedge might need a hedge of its own. With single ticker covered call ETFs, it's very clear that the coupled position can lose value anytime the underlying finds itself above the strike price on the expiry date. The primary position will not gain in value, yet the short side of couple will still lose value. I typically look at buying a very small dollar value worth of call options on the underlying to hedge against the possibility of this happening. However with this being a basket of stocks instead of using single ticker, I do not believe this approach would be as effective. I believe that most of this risk is mitigated by the fact that their holdings are diversified.
The couple is also threatened by the fact that on longer timeframes the Nasdaq-100 spends more time going up than down. Because it is quite small compared to the other side of the couple, I expect the long term decay rate of the short TQQQ position to be manageable, but I may be wrong.
The borrow rates on TQQQ may rise above its decay rate. This could make it even more of a net loser than expected. This can become more of a problem if it occurs when one isn't paying attention. It is wise to check on conditions regularly.
Catalysts
With the fund selling covered calls at-the-money, QYLD should outperform holding its underlying under some circumstances. A portion of this strategy relies on the fact that implied volatility is typically higher than actual volatility. Anytime the Nasdaq-100 experiences a move smaller than what is implied by its options market, the covered call strategy should outperform.
Rebalancing the pair has the potential to net additional income. Each time the pair is reweighted back to minimum volatility, a portion of the overvalued position is sold while the undervalued position has more added to it. Rebalancing regularly removes the stress of having to time tops and bottoms. Experienced traders may instead chose to rebalance back to neutral at every perceived extreme.
Conclusions
QYLD pays a variable yield which usually ends up in the 10 to 13% range. Its family of funds is unlike many other covered call ETFs in that its distribution policy is designed so that its long-term decay occurs at a rather slow rate. Frequently, most of its yield is tax advantaged.
I believe the investment becomes more attractive when looking at the possibility of coupling the position with a short position in TQQQ. The short position currently has very low borrowing fees. Although a short TQQQ position appears to lose value over very long time frames, I believe the benefit one gains from having a small hedge outweighs the slow bleeding maintaining it should cause. I should note to readers that anyone wanting to build their own minimum variance calculator in Excel can find several examples showing how it can be done on YouTube.
For several months now, I have been researching potential targets for use in a high-margin portfolio. I am glad I decided to take a harder look at RYLD a few weeks ago, and believe I should also look at XYLD soon. I suspect I am still a couple months away from running low on high-quality targets to research. When I find myself running out of attractive choices, I will move on to paper trading a rough draft of the portfolio to get used to running it before trying it out with real money. Because of their extreme tax advantages, it is very likely RYLD, QYLD, and XYLD will all make it into the portfolio.
For further details see:
QYLD: Attractive Yield And Tax Benefits