QYLD - QYLD: There Is A Better Way
2023-08-30 05:26:40 ET
Summary
- QYLD is the largest covered call ETF from Global X, selling call options on its underlying portfolio to generate income for investors.
- However, QYLD's covered call strategy has led to erosion of principal and substantial opportunity cost over time.
- An alternative income policy is presented, providing efficient access to income from an investment with exposure to the Nasdaq 100 index.
The Global X NASDAQ 100 Covered Call ETF ( QYLD ) is the largest of the firm's family of covered call ETFs, and at just over $8 billion in net assets, currently the largest of their more than 100 ETFs. It target is the Cboe Nasdaq-100 BuyWrite V2 Index (see methodology ). To that end, QYLD portfolio managers sell call options on its underlying portfolio approximating the Nasdaq 100. The option strikes are near at-the-money and the cycle is monthly.
I had written about Global X's other main covered call ETFs, RYLD and XYLD, assigning them Sell ratings for different reasons. Given that QYLD's underlying index is the Nasdaq 100, one might think this index's combination of sustained positive return and healthy volatility levels (with correspondingly healthy option premiums) would have led to a different result. As it turns out, QYLD leaves too much on the table. There is an accessible strategy providing superior results, which I summarize below, for those seeking income from an investment with exposure to the Nasdaq. My rating for QYLD is Sell.
Call Options
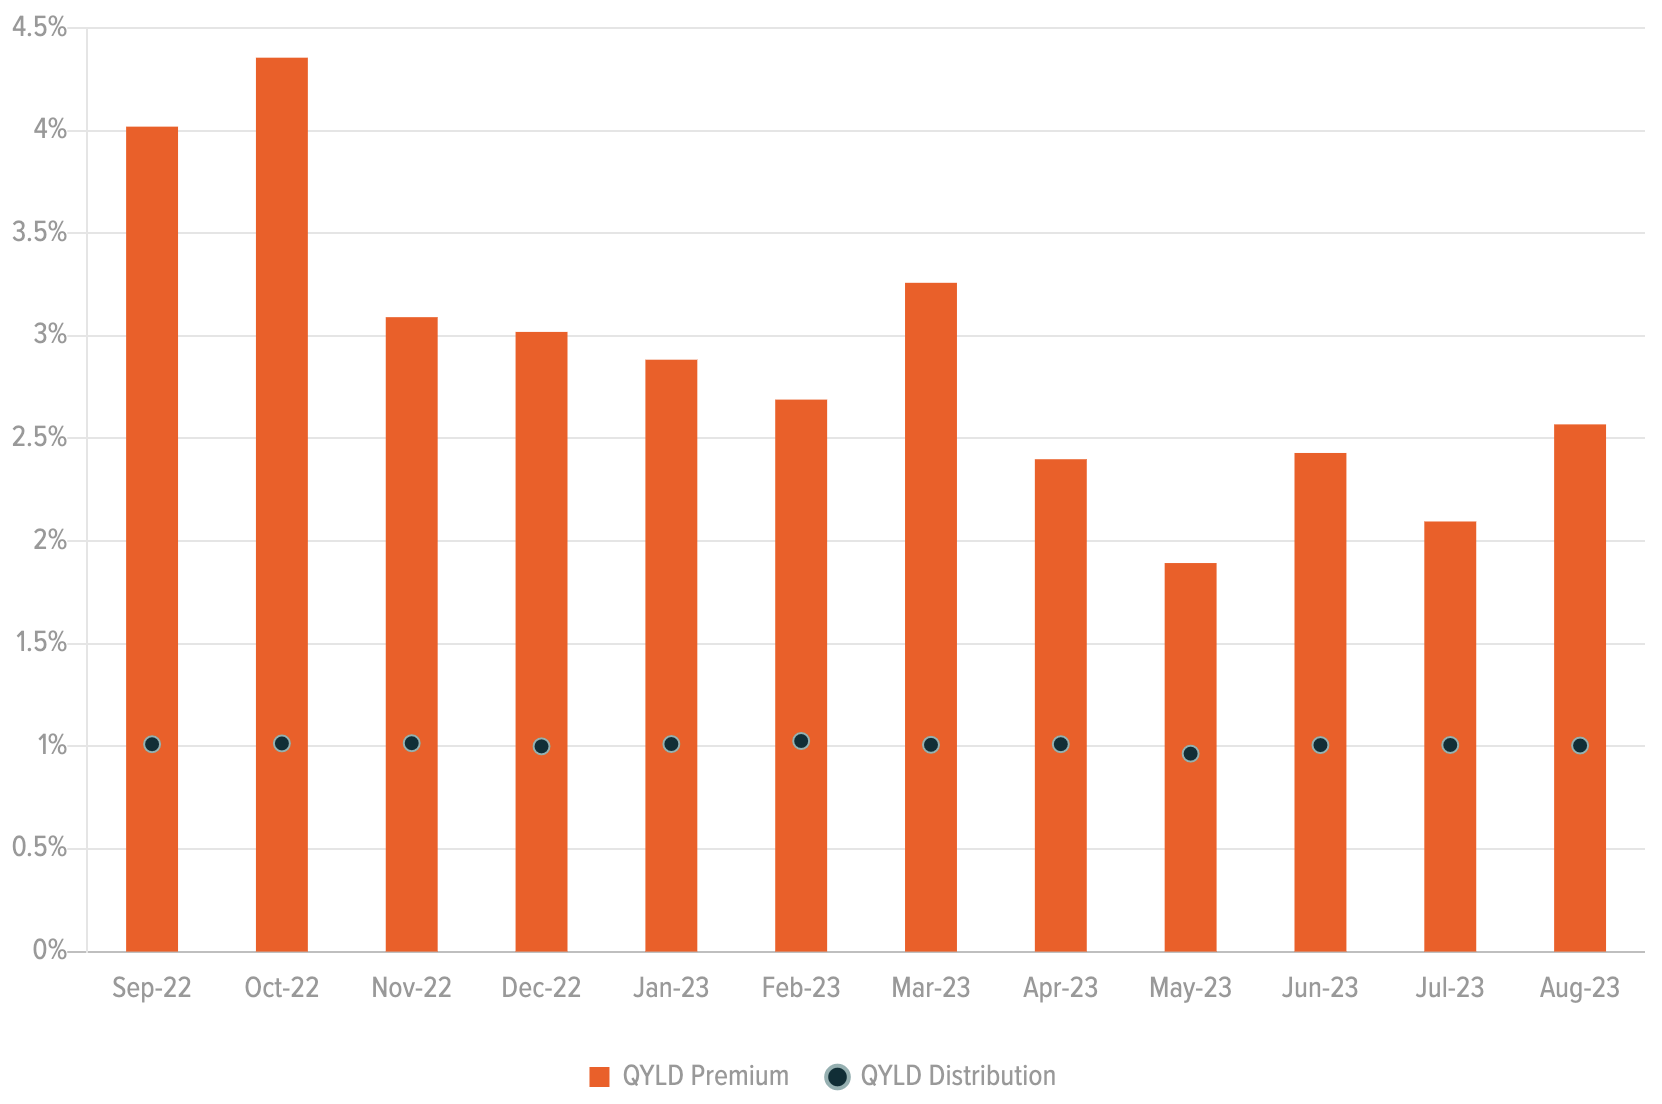
Over the past 12 months, the ETF's options have brought in an average of 2.9% monthly although it has ranged from as low as 1.9% to as high as 4.4%. The firm distributed to investors an average of 1.0% monthly.
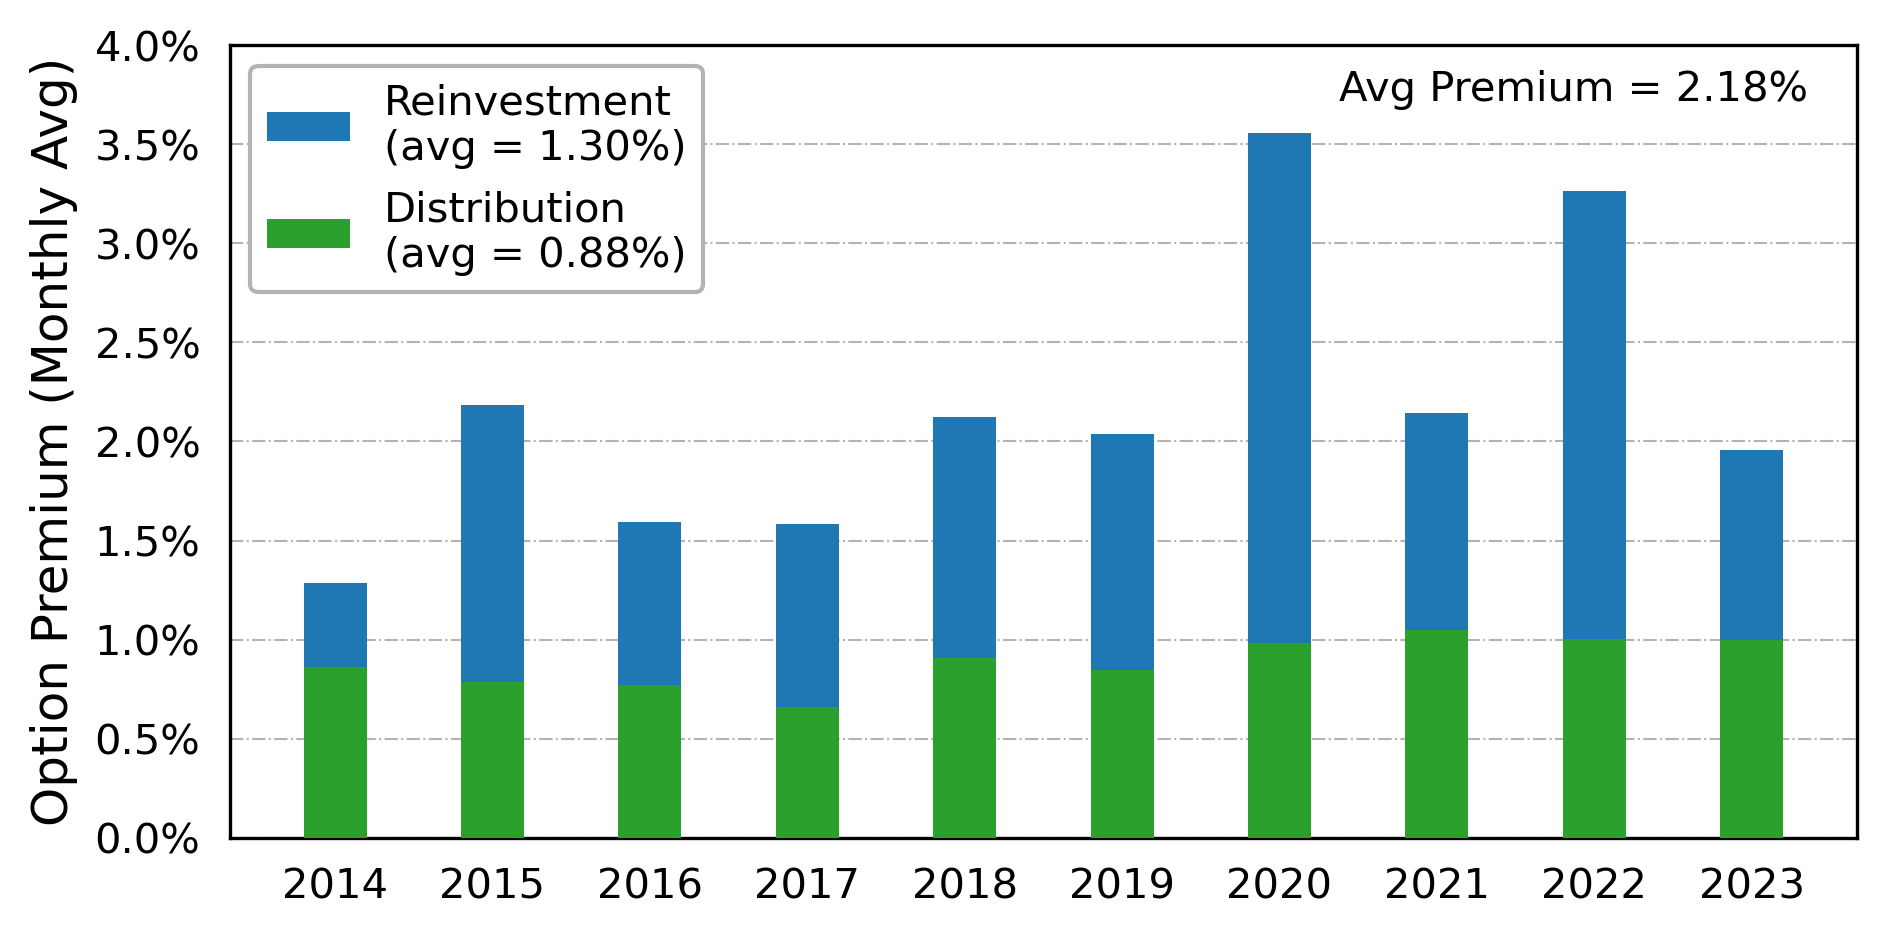
These values are within the ranges from previous years though last year's average premium is about 30% higher than the long-term average of 2.2%. As for the fund's distribution, which averages 0.9% since inception, it has been held steady at close to 1% monthly for a few years now. The values in the chart below are calculated based on the combination of distributions and price action of QYLD relative to its index.
Alpay Kaya, CFA (Data Source: Yahoo! Finance, Global X ETFs)
Attribution
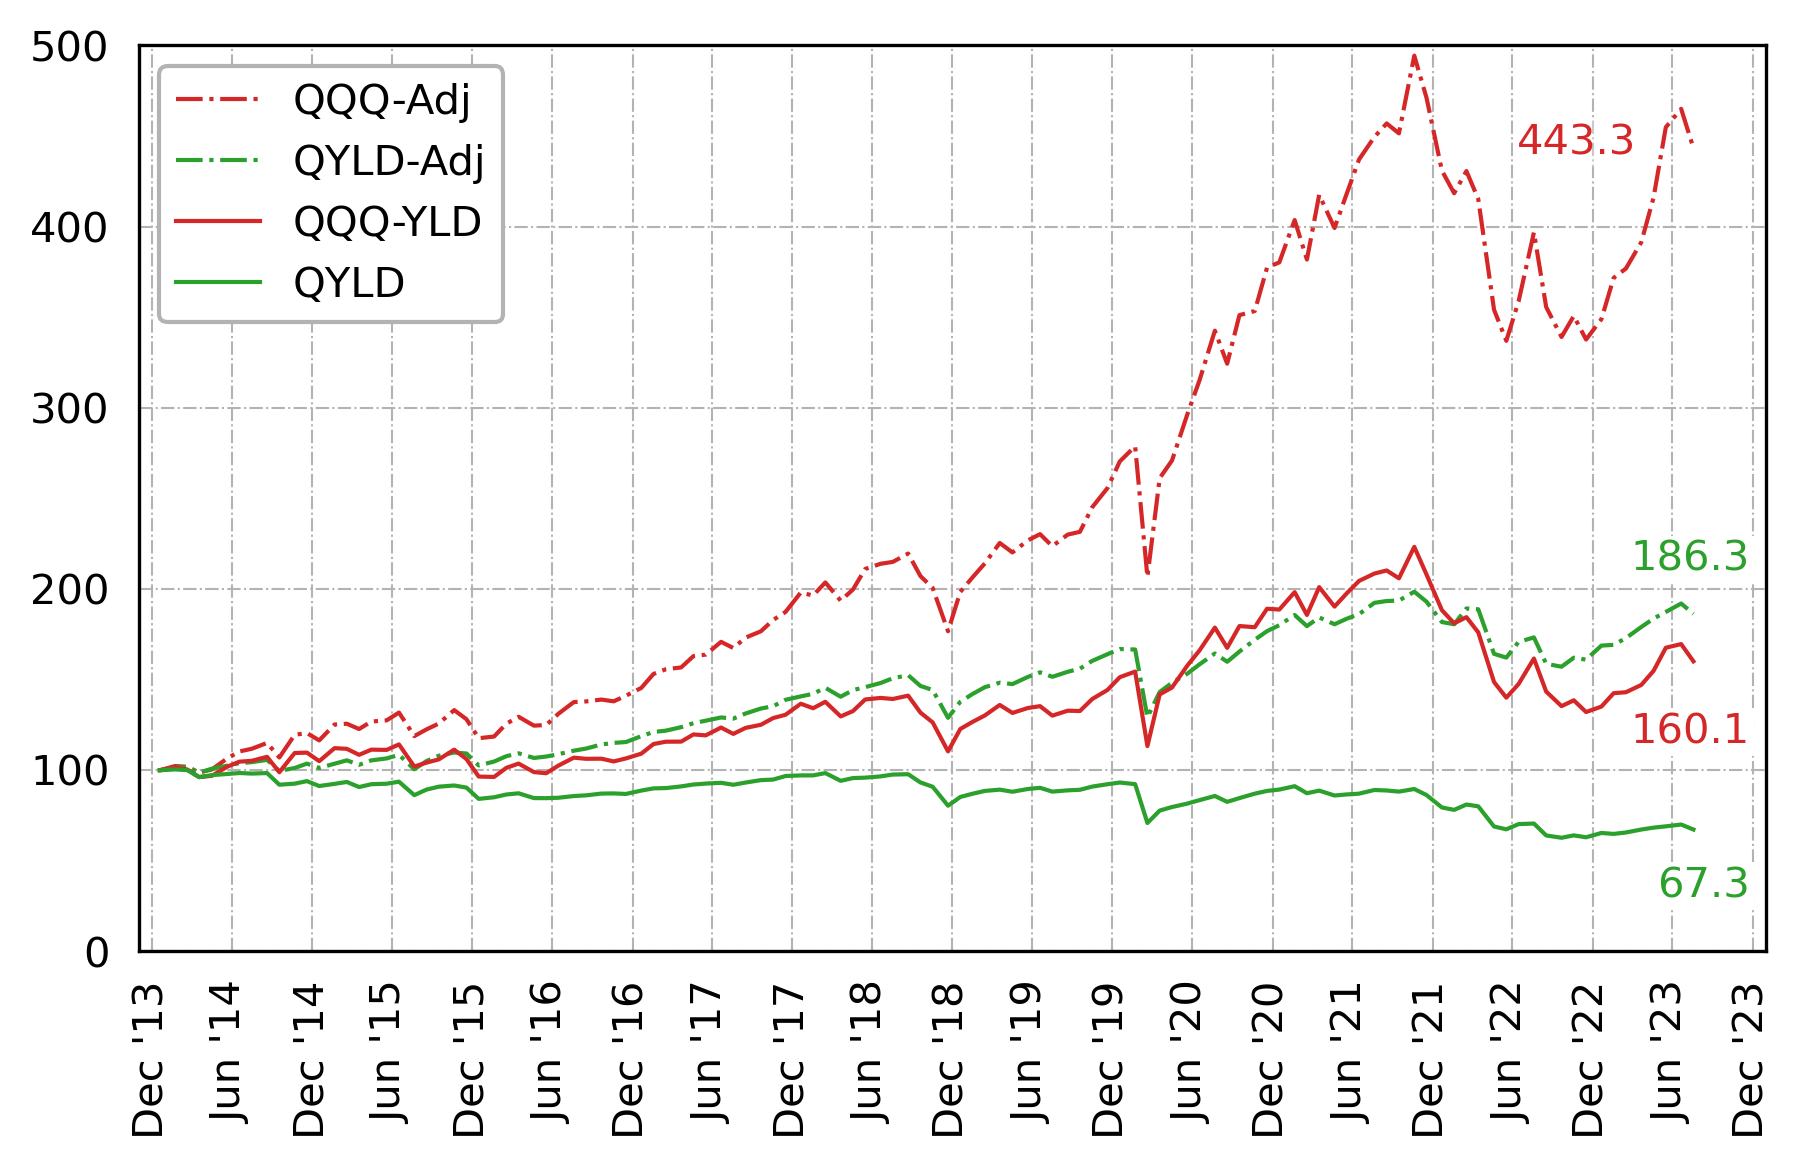
The fund's normalized return is shown since its inception along with that of the Invesco QQQ ETF ( QQQ ) providing exposure to the Nasdaq 100 index. The dash-dot graphs (-Adj) show total return (dividends or distributions reinvested) while the solid green line shows NAV for QYLD investors collecting their monthly distributions. The solid red graph (QQQ-YLD) shows NAV of an investment in QQQ with self-issued monthly dividends equal (in percent terms) to those of QYLD. It will be discussed in the next section.
Although the monthly income available to QYLD investors at first appears attractive, the effect on principal since inception has been -32.7% (or -4% annually). This necessarily means that day-one investors have seen their approximately 1% monthly income shrink by more than 30%. It is still 1%, but of something smaller. On average, NAV erosion has been paying for part of QYLD's monthly distributions.
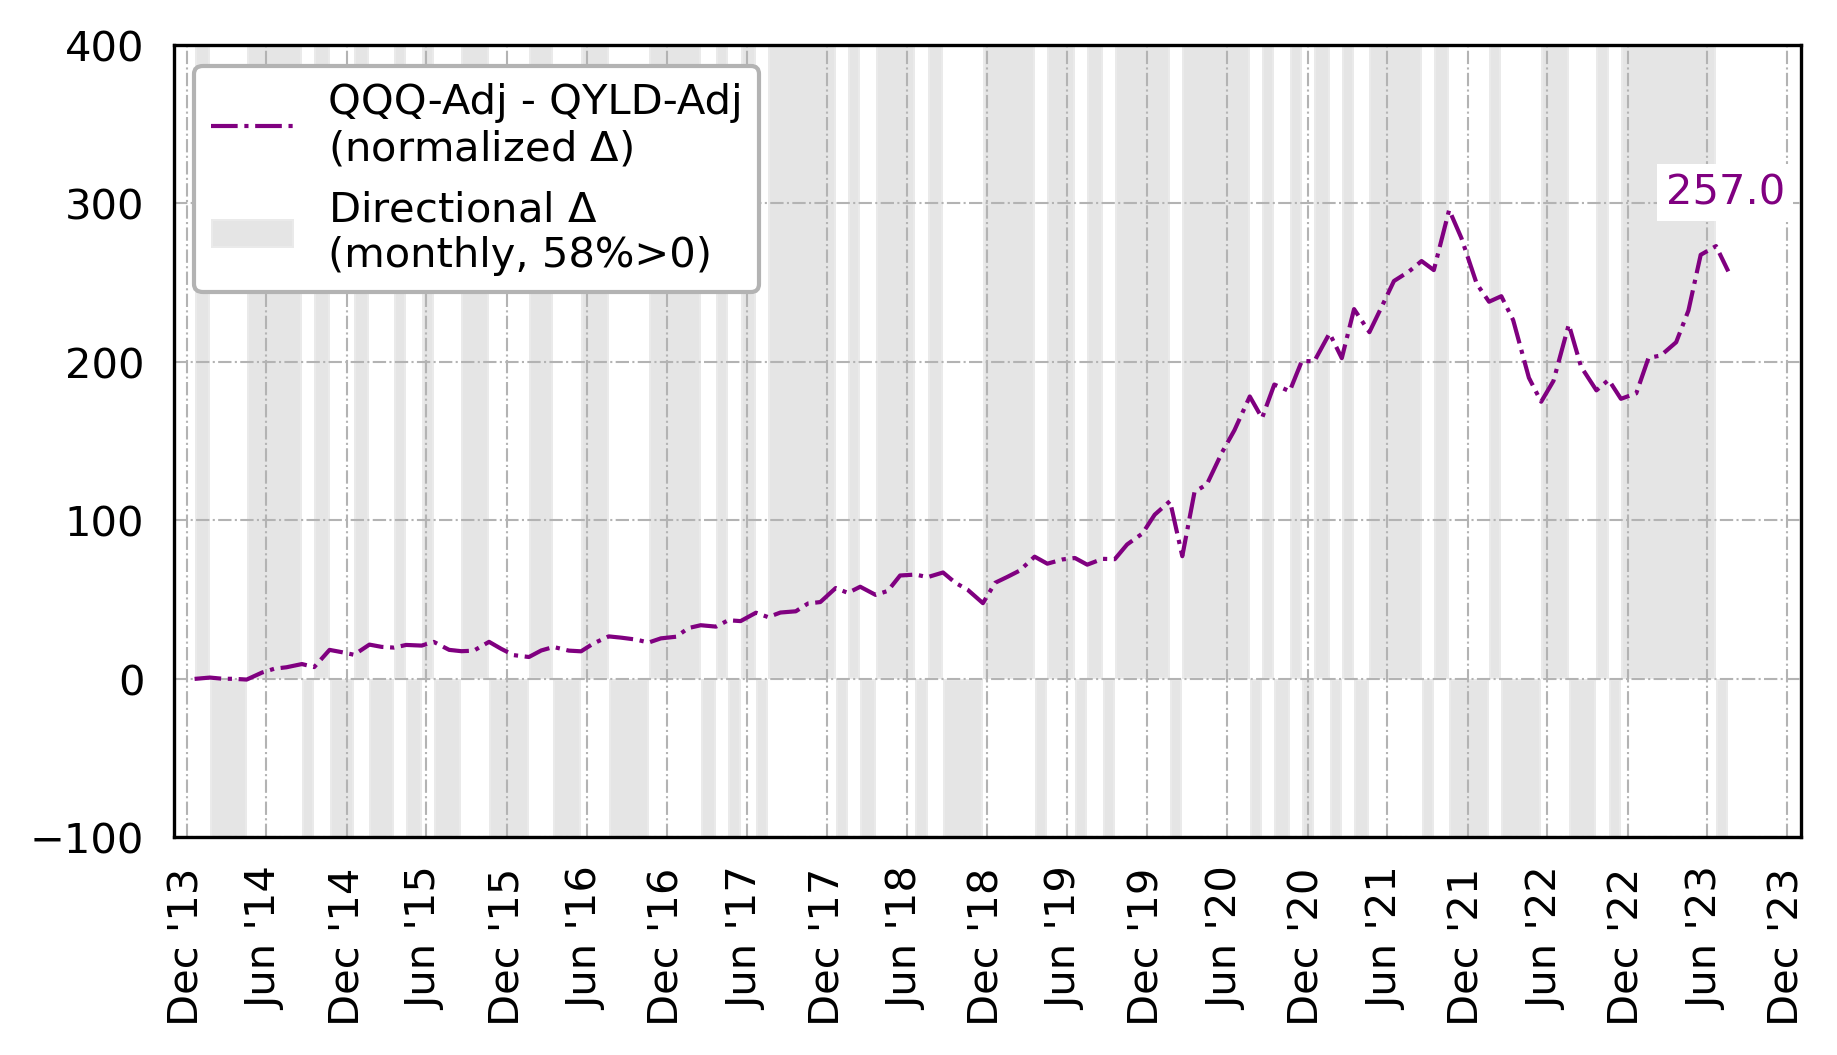
As for the option of reinvesting, QQQ's total return was 15.5% annually while QYLD's was 4.9%. The difference between their normalized total returns is shown below. QQQ performed better in 58% of months. That the shaded regions are spread out over time shows consistency in QQQ's relative outperformance. As applied to the Nasdaq 100 index, the covered call strategy has had a consistently negative net effect, the magnitude of which cannot be dismissed.
It remains a fact, however, that there are investors requiring income from their holdings. Given QQQ's sizable annual return, there should be alternatives to the covered call overlay when it comes to providing income.
A Better Way
The concept of self-issued dividends is something I covered in detail with regard to QQQ in a previous article . To summarize, all dividends come from NAV. When issued by a firm, the level of retained earnings declines as does share price. When self-issued, shares are sold but share price is unaffected, and investors can choose the level of their dividends. Either way, a 1% dividend reduces NAV by 1%. Either way, growing at a rate less than dividend yield leads to erosion of principal.
For the purpose of this comparison, the graph QQQ-QYLD represents the total return of QQQ (e.g., constituent firm dividends reinvested) less dividends equal in percentage to those of QYLD. If QYLD paid 0.947% of its NAV on a given month, then the NAV of QQQ-YLD was reduced 0.947% that month. As we already covered, this affected QYLD's original principal at an average rate of -4% annually (from 100 to 67.3 in the attribution figure). QQQ-YLD however grew from 100 to 160.1 over the same period, averaging +4.9% annually.
Note that equal percent dividends do not translate to equal dollar amounts. Since both were normalized, QQQ-YLD's dividend on the first month would be equal to QYLD's in both percent and dollar terms. By the end of the study, the NAV of QQQ-YLD was more than 2.3 times the NAV of QYLD; consequently, the dollar amount of its final monthly dividend would be more than 2.3 times that of QYLD's dividend.
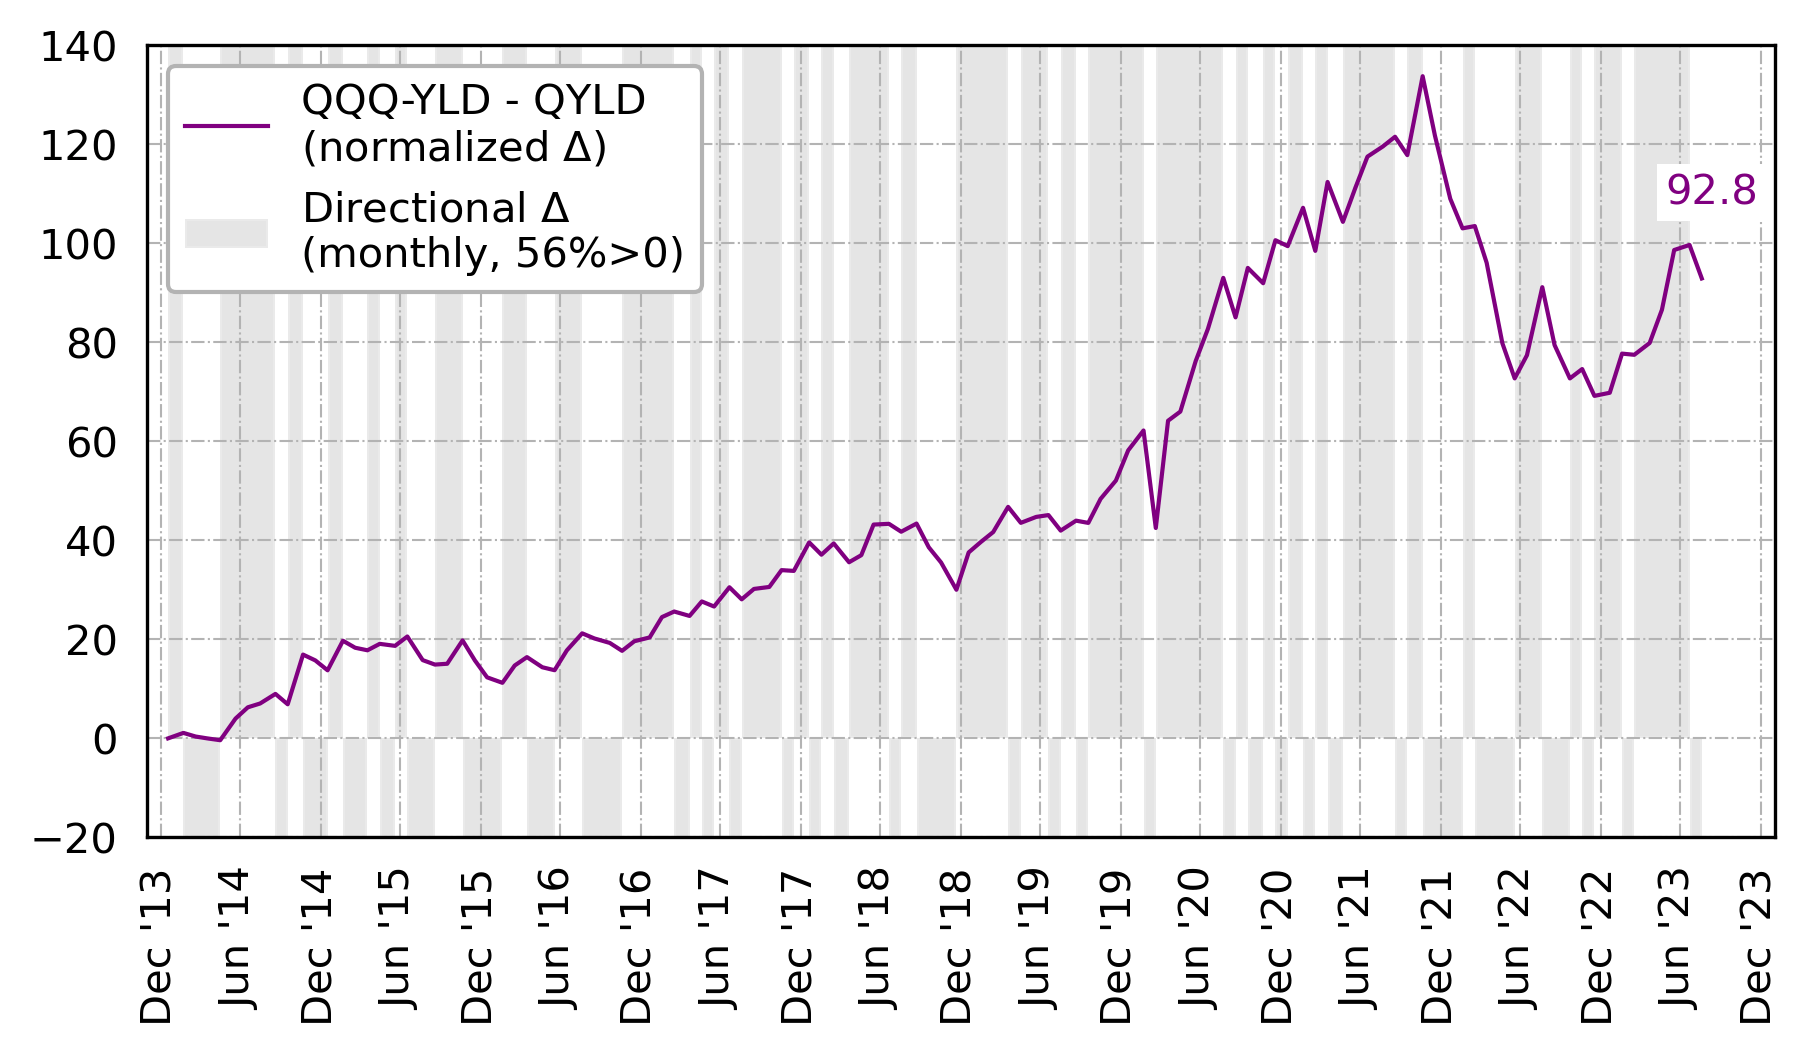
The normalized difference between the self-issued dividend protocol applied to QQQ versus QYLD is shown below. The number of months during which it performs better (56%) is consistent with that of their total return counterparts. We furthermore see that this outperformance is spread out over time.
The Fluidity of Share Number
Constraining dividends to be equal required ignoring the practical matter of shares being sold only in whole numbers. This can be alleviated by rounding down one month and up the next or even by executing the transactions quarterly. Imposing equal dividend yield made for the most fair comparison between QYLD and QQQ-QYLD.
Those averse to seeing share numbers decrease should be aware of the latent variability of QYLD shares. No, not the number of QYLD shares held by an investor but the conversion factor between those shares and shares of the constituents of its underlying index. A constant number of shares in QYLD held across multiple months does not translate to a constant number of shares in Apple, Amazon, Tesla, etc. held across multiple months. All investors in QYLD have implicitly accepted such variability.
Conclusion
The need some investors have for periodic income is real. The monthly payment provided by QYLD's covered call overlay comes at the expense of deteriorating principal and substantial opportunity cost. The alternative dividend protocol provides an efficient method for extracting income from the underlying index, the level of which can be adjusted to suit any investor's specific needs. My rating for QYLD is Sell.
For further details see:
QYLD: There Is A Better Way