JEPI - QYLD Vs. JEPI: Which One Is The More Attractive Covered-Call ETF?
- The Global X NASDAQ 100 Covered Call ETF (QYLD) and JPMorgan Equity Premium Income ETF (JEPI) both use a covered-call strategy to generate attractive dividends.
- The strategy has generated reliable dividends far exceeding inflation in the past.
- This article examines their differences and similarities more closely so potential investors can finetune their use to fit individual risk profiles and goals.
- And you will see why we think QYLD is a better choice now.
- At the same time, investors also need to be aware of their limitations, especially when market volatility becomes quieter as we are experiencing now.
Thesis
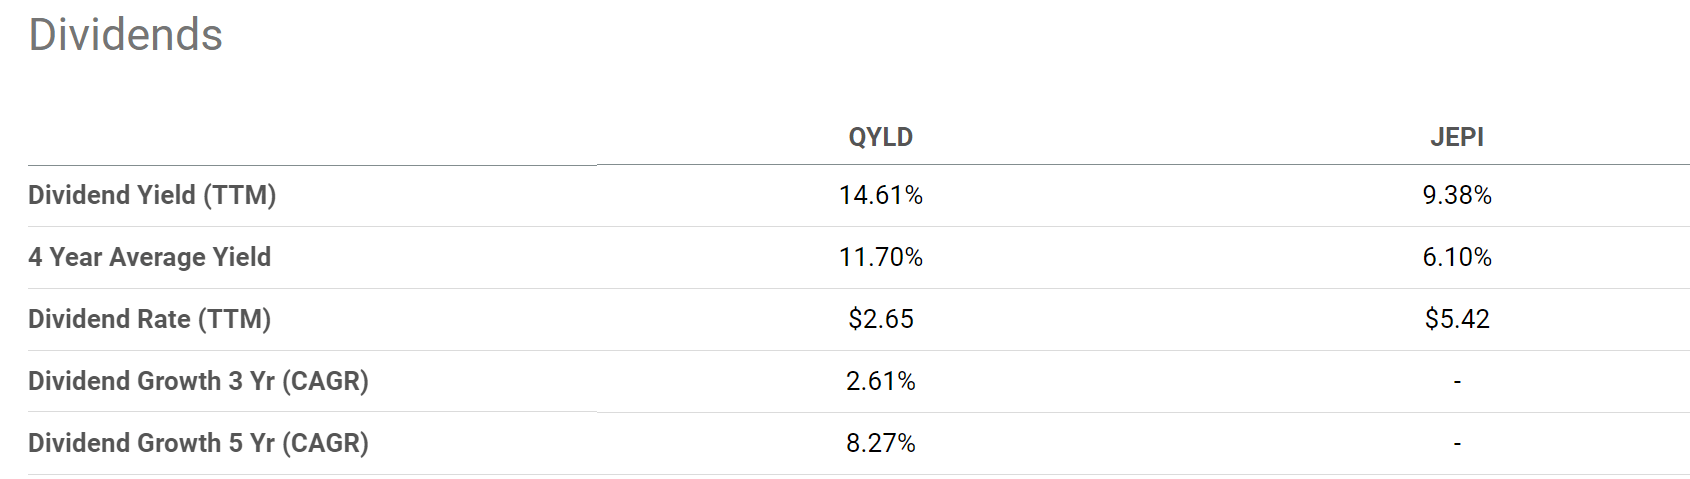
The Global X NASDAQ 100 Covered Call ETF ( QYLD ) and JPMorgan Equity Premium Income ETF ( JEPI ) are two popular funds based on the covered-call strategy. To wit, QYLD is currently yielding (on a TTM basis) 14.61%, and JEPI is yielding 9.38%. Such levels of yields are not only extremely appealing in absolute terms during an overall low-yield environment (10-year treasury yields less than 3% and the S&P 500 yield less than 1.5%), but they are also extremely attractive even when measured by other yardsticks.
For example, let’s compare them to high-yield corporate bonds. As of this writing, Moody's Seasoned BAA Corporate Bond Yield is yielding about 5.1%, only about 1/3 of the yield from QYLD and about ½ of the yield from JEPI. From another point of view, let’s compare their current dividend yield to their own historical record. The average yield in the past 4 years for QYLD has been 11.70% and 6.10% for JEPI. As a result, QYLD is currently yielding a whopping 25% above its historical average, and JEPI even more, about 53% above its historical average. And finally, when compared to the surging inflation that is on everyone investor’s mind, their yields are also very competitive (as to be elaborated on a bit later). However, investors should not simply base their decision on the above discounts indicated by the dividend yields. My view is that the relatively brief history of JEPI has not established a representative average yet.
Besides the similarly mouthwatering dividend yields, there are differences between these two funds. And it is the focus of this article to closely examine these differences so investors can make an informed choice to fit their personal risk profiles and goals. And you will also see why these differences make us favor QYLD more than JEPI.
QYLD and JEPI: basic information
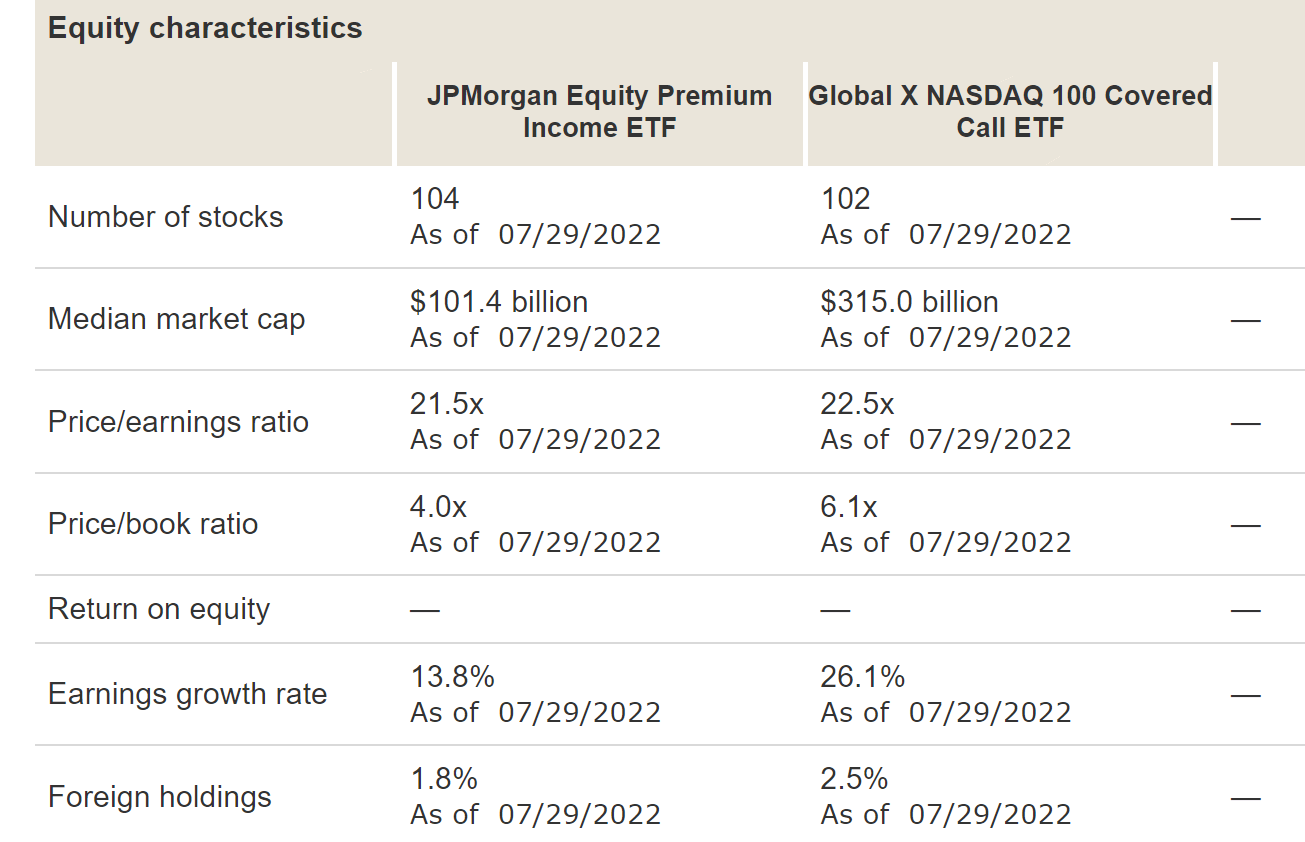
Just in case some readers are not familiar with these funds yet, the following chart shows an overview of their basic characteristics. JEPI is a much larger fund with $11.5 billion AUM than QYLD (with about $7.1 billion AUM). In terms of expenses, JEPI charges a lower expense ratio of 0.35%, and QYLD charges a slightly higher expense ratio of 0.60%.
The more fundamental differences are in their indexing method. They follow totally different index strategies. Overall, QYLD is indexed based on the Nasdaq 100 Index (“NDX”), and JEPI follows a more value-oriented approach as detailed in the fund description below (abridged and emphases added by me). As a result, the holdings in JEPI tend to have lower valuation multiples. As you can see from the table below, the PE ratio for JEPI is about 21.5x while that for QYLD is about 22.5x, a difference of about 5%. The difference is more dramatic in terms of the price-to-book value ratio. JEPI’s price/book multiple is about 4.0x, compared to 6.1x for QYLD, a discount of more than 1/3.
In the remainder of this article, we will detail the implications of such indexing differences.
In managing the equity portion of the Fund’s portfolio the adviser employs a three-step process that combines research, valuation and stock selection. The research findings allow the adviser to rank companies according to what it believes to be their relative value … The Fund buys and sells securities in accordance… using the research and valuation rankings as a basis. In general, the adviser selects securities that are identified as attractive and considers selling them when they appear less attractive.
QYLD and JEPI: dividend yield comparison
After the above introduction, let’s address the elephant in the room first: their dividends. Indeed, many investors are drawn to these covered-call funds because of their monthly and high dividend yields.
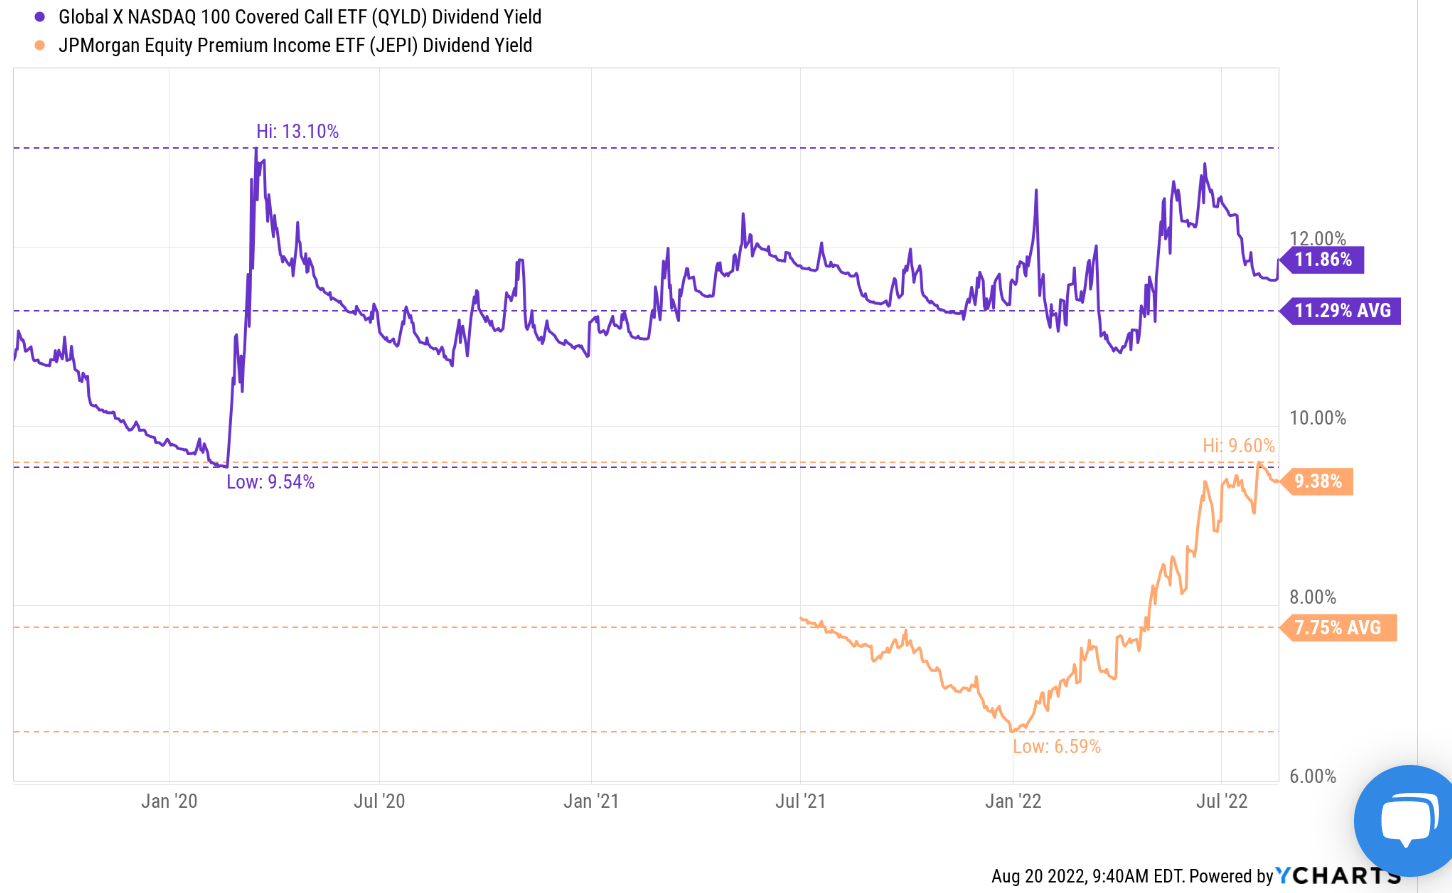
The next chart summarizes the dividend yields of QYLD and JEPI. The dividend yield for QYLD has fluctuated in a range between about 9.5% and 13.1% in the past few years with an average of 11.3%. Its current yield is about 11.8% in terms of the so-called distribution yield (when the current monthly dividend is annualized), slightly above its historical average. But in terms of the TTM yield (which I rely on more because it filters out the month-to-month noises), it is yielding 14.6%, more than 25% above its historical average.
The dividend yield for JEPI has fluctuated in a range between about 6.59% and 9.6% since its inception in 2021. And its average has been 7.75% since then. And its current yield is about 9.38% both in terms of the distribution yield and the TTM yield. As a result, its current yield is more than 50% above its historical average.
However, investors should not simply base their decision on the above discounts indicated by the yields, as the relatively brief history of JEPI does not provide a representative average in my opinion yet, as discussed next.
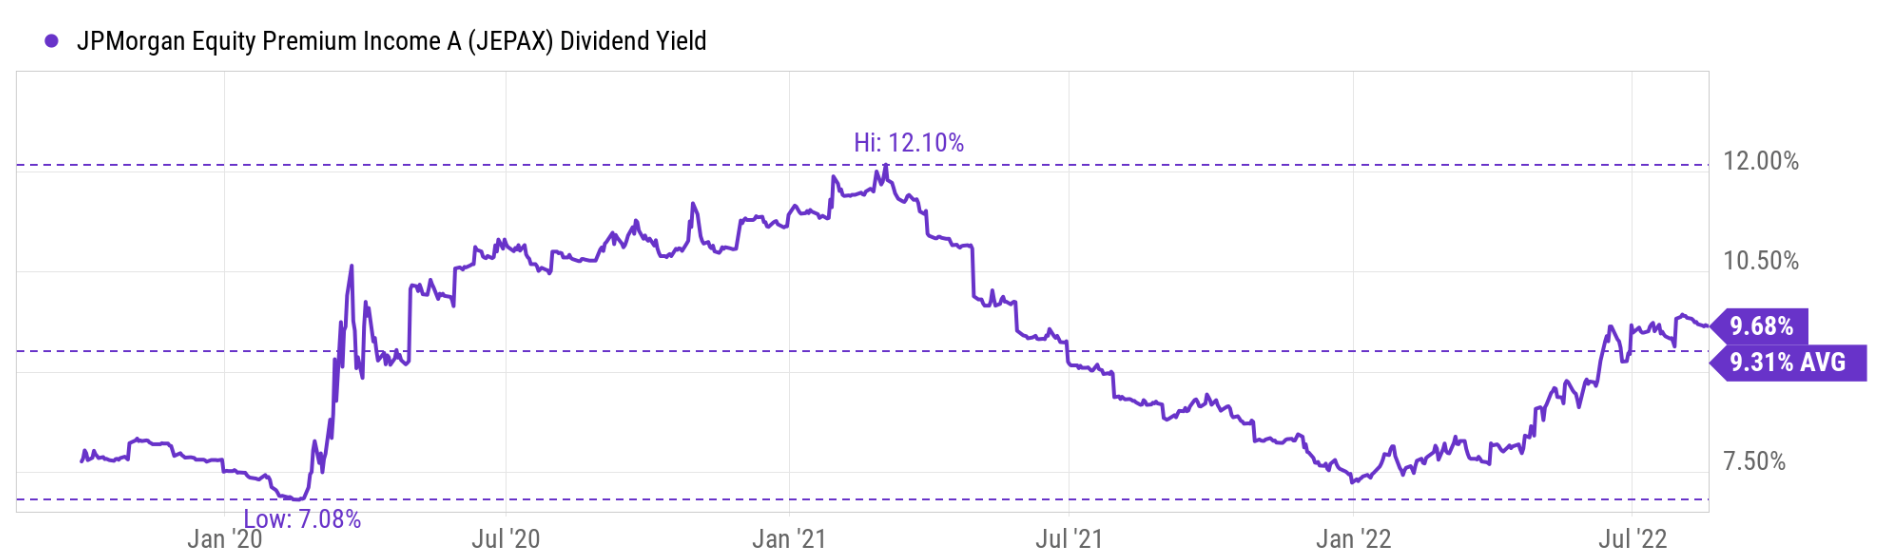
Fortunately, JPMorgan has another fund (a mutual fund) that follows a very similar strategy as JEPI: the JPMorgan Equity Premium Income Fund Class A A ( JEPAX ). JEPAX was launched back in 2019, thus providing about 3 years of historical data. And as you can see from the following chart, the dividend yield for JEPAX has fluctuated in a range between about 7.08% and 12.1% in the past 3 years, a much wider range than JEPI because of the longer period of time and variety of market conditions. Also, the average dividend yield has been 9.31%, much higher than JEPI’s mean of 7.75% during its shorter lifespan.
If we trust the extrapolation from JEPAX to JEPI, then JEPI’s current dividend yield of 9.38% is actually on par with its historical yield and there is no apparent discount.
QYLD and JEPI: dividends against inflation
Of course, despite the difference in their discount relative to their historical record, both funds provide sufficient dividends both in absolute and relative terms, as mentioned earlier in the article. Here, let’s examine their dividends against inflation, something that is on everyone investor’s mind these days.
Firstly, the current dividend yields from both QYLD and JEPI are higher than the current rampant inflation already (about 8%). Secondly, I highly doubt the current level of inflation will last in the long run. I expect inflation to stabilize in the 2% range in the long run (which is about the annual average inflation in the past decade or so). And both QYLD and JEPI have been providing dividend yields of about 11.3% and 9.3% respectively in the long term as just discussed. Lastly, QYLD has also demonstrated the ability to grow the dividend at a healthy pace in the past. Its dividend growth rate in the past 3 years has been 2.61% CAGR, and in the past 5 years has been 8.27% CAGR, both outpacing the average inflation in the long term. JEPI (or JEPAX) has been around for long enough to establish a reliable trend for dividend growth. But I believe in the long run, their dividend growth rate would outpace the average inflation as well.
QYLD and JEPI: holdings and use of options
Now let’s dive in and take a closer look at their holdings and understand better how/why they can generate such high yield consistently. The secret is the use of covered calls. In the case of QYLD, it writes covered calls on the NDX index, as detailed in the following fund description (abridged and emphases added by me):
QYLD’s covered call position is created by buying (or owning) the stocks in the Nasdaq 100 Index ("NDX") and selling a monthly at-the-money index call option , which historically produces higher yields in periods of volatility.
JEPI follows a similar strategy except it picks different stocks (more value-oriented stocks as aforementioned) and uses these stocks as the underlying to cover the calls. As detailed in the fund description (abridged and emphases added by me),
In order to generate income, the Fund may invest up to 20% of its net assets in ELNs ... ELNs in which the Fund invests are derivative instruments that are specially designed to combine the economic characteristics of the S&P 500 Index and written call options in a single note form. The ELNs provide recurring cash flow to the Fund based on the premiums from the call options the ELNs write and are an important source of the Fund’s return...
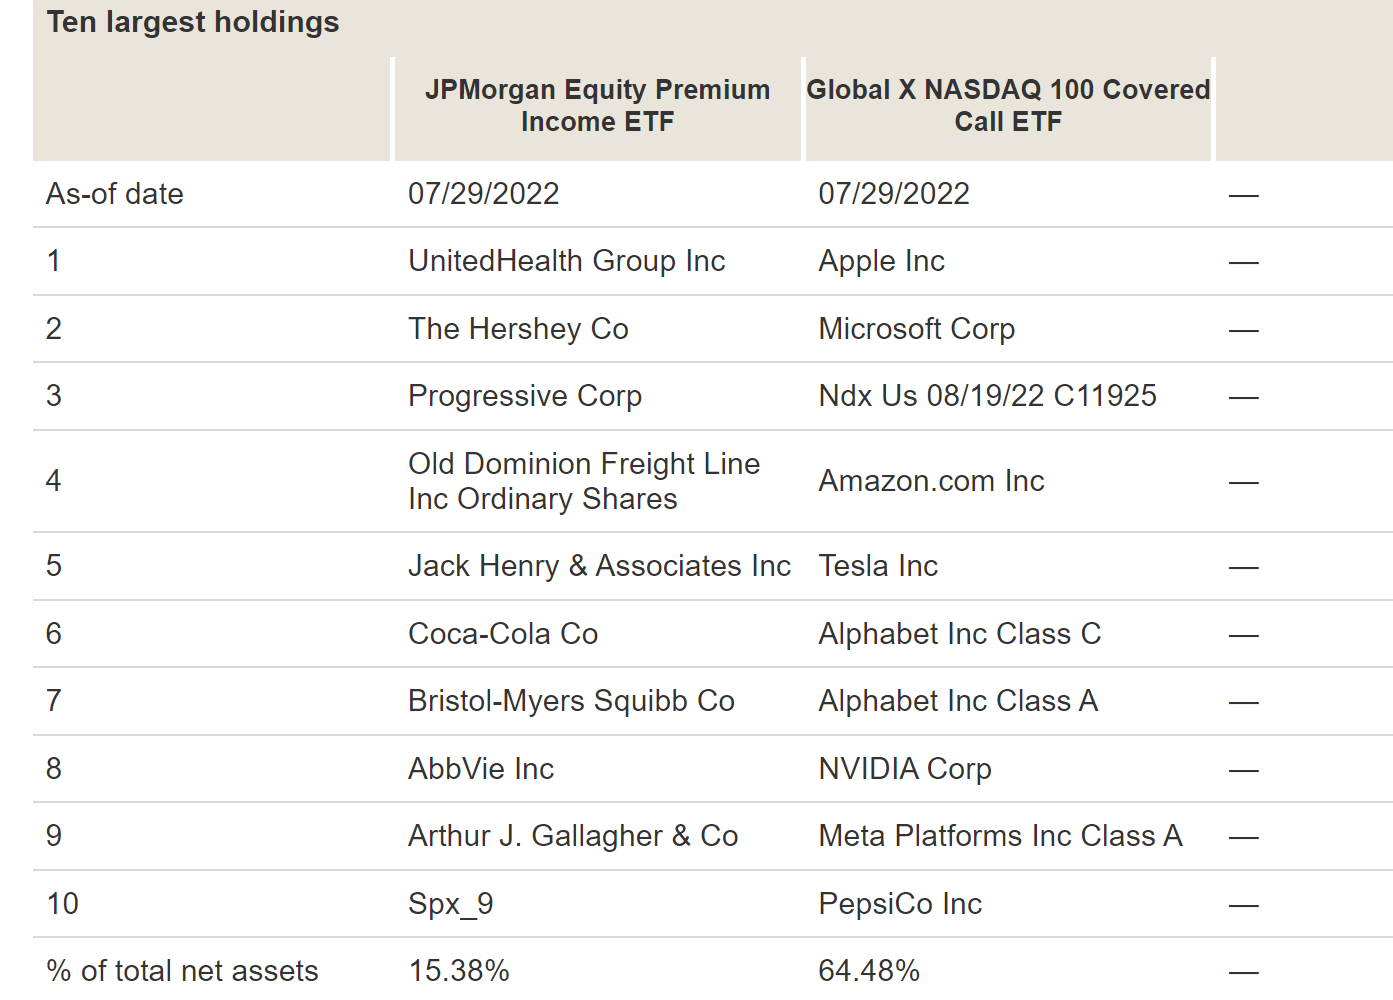
In both cases, both funds can collect the premium from the options, which is the main mechanism for their lucrative and consistent income. A comparison of their top ten holdings as shown below probably illustrate all of these important fund characteristics very clearly. As you can see, QYLD’s top holdings are exactly the same as the largest stocks in the NDX and are dominated by tech stocks. And the only difference is the NDX option, the 3 rd largest holding. While the holdings in JEPI are totally different. And you can easily tell from the top 10 holdings that they are more value-oriented and had very little exposure to tech stocks at all. And also note the 10 th position is the covered call position.
Besides generating a steady income, the use of options also creates other advantages. The use of options can also reduce volatility because the income can cancel off potential losses from price deprecation. Furthermore, the premium on options tends to go up when market volatility increases, thusly providing a further mechanism to fight against volatility.
However, covered calls are not silver bullets and they do have their drawbacks. And the key drawback is that they also reduce the funds’ ability to fully profit from price appreciation, as we will see next.
QYLD and JEPI: Historical returns and risks
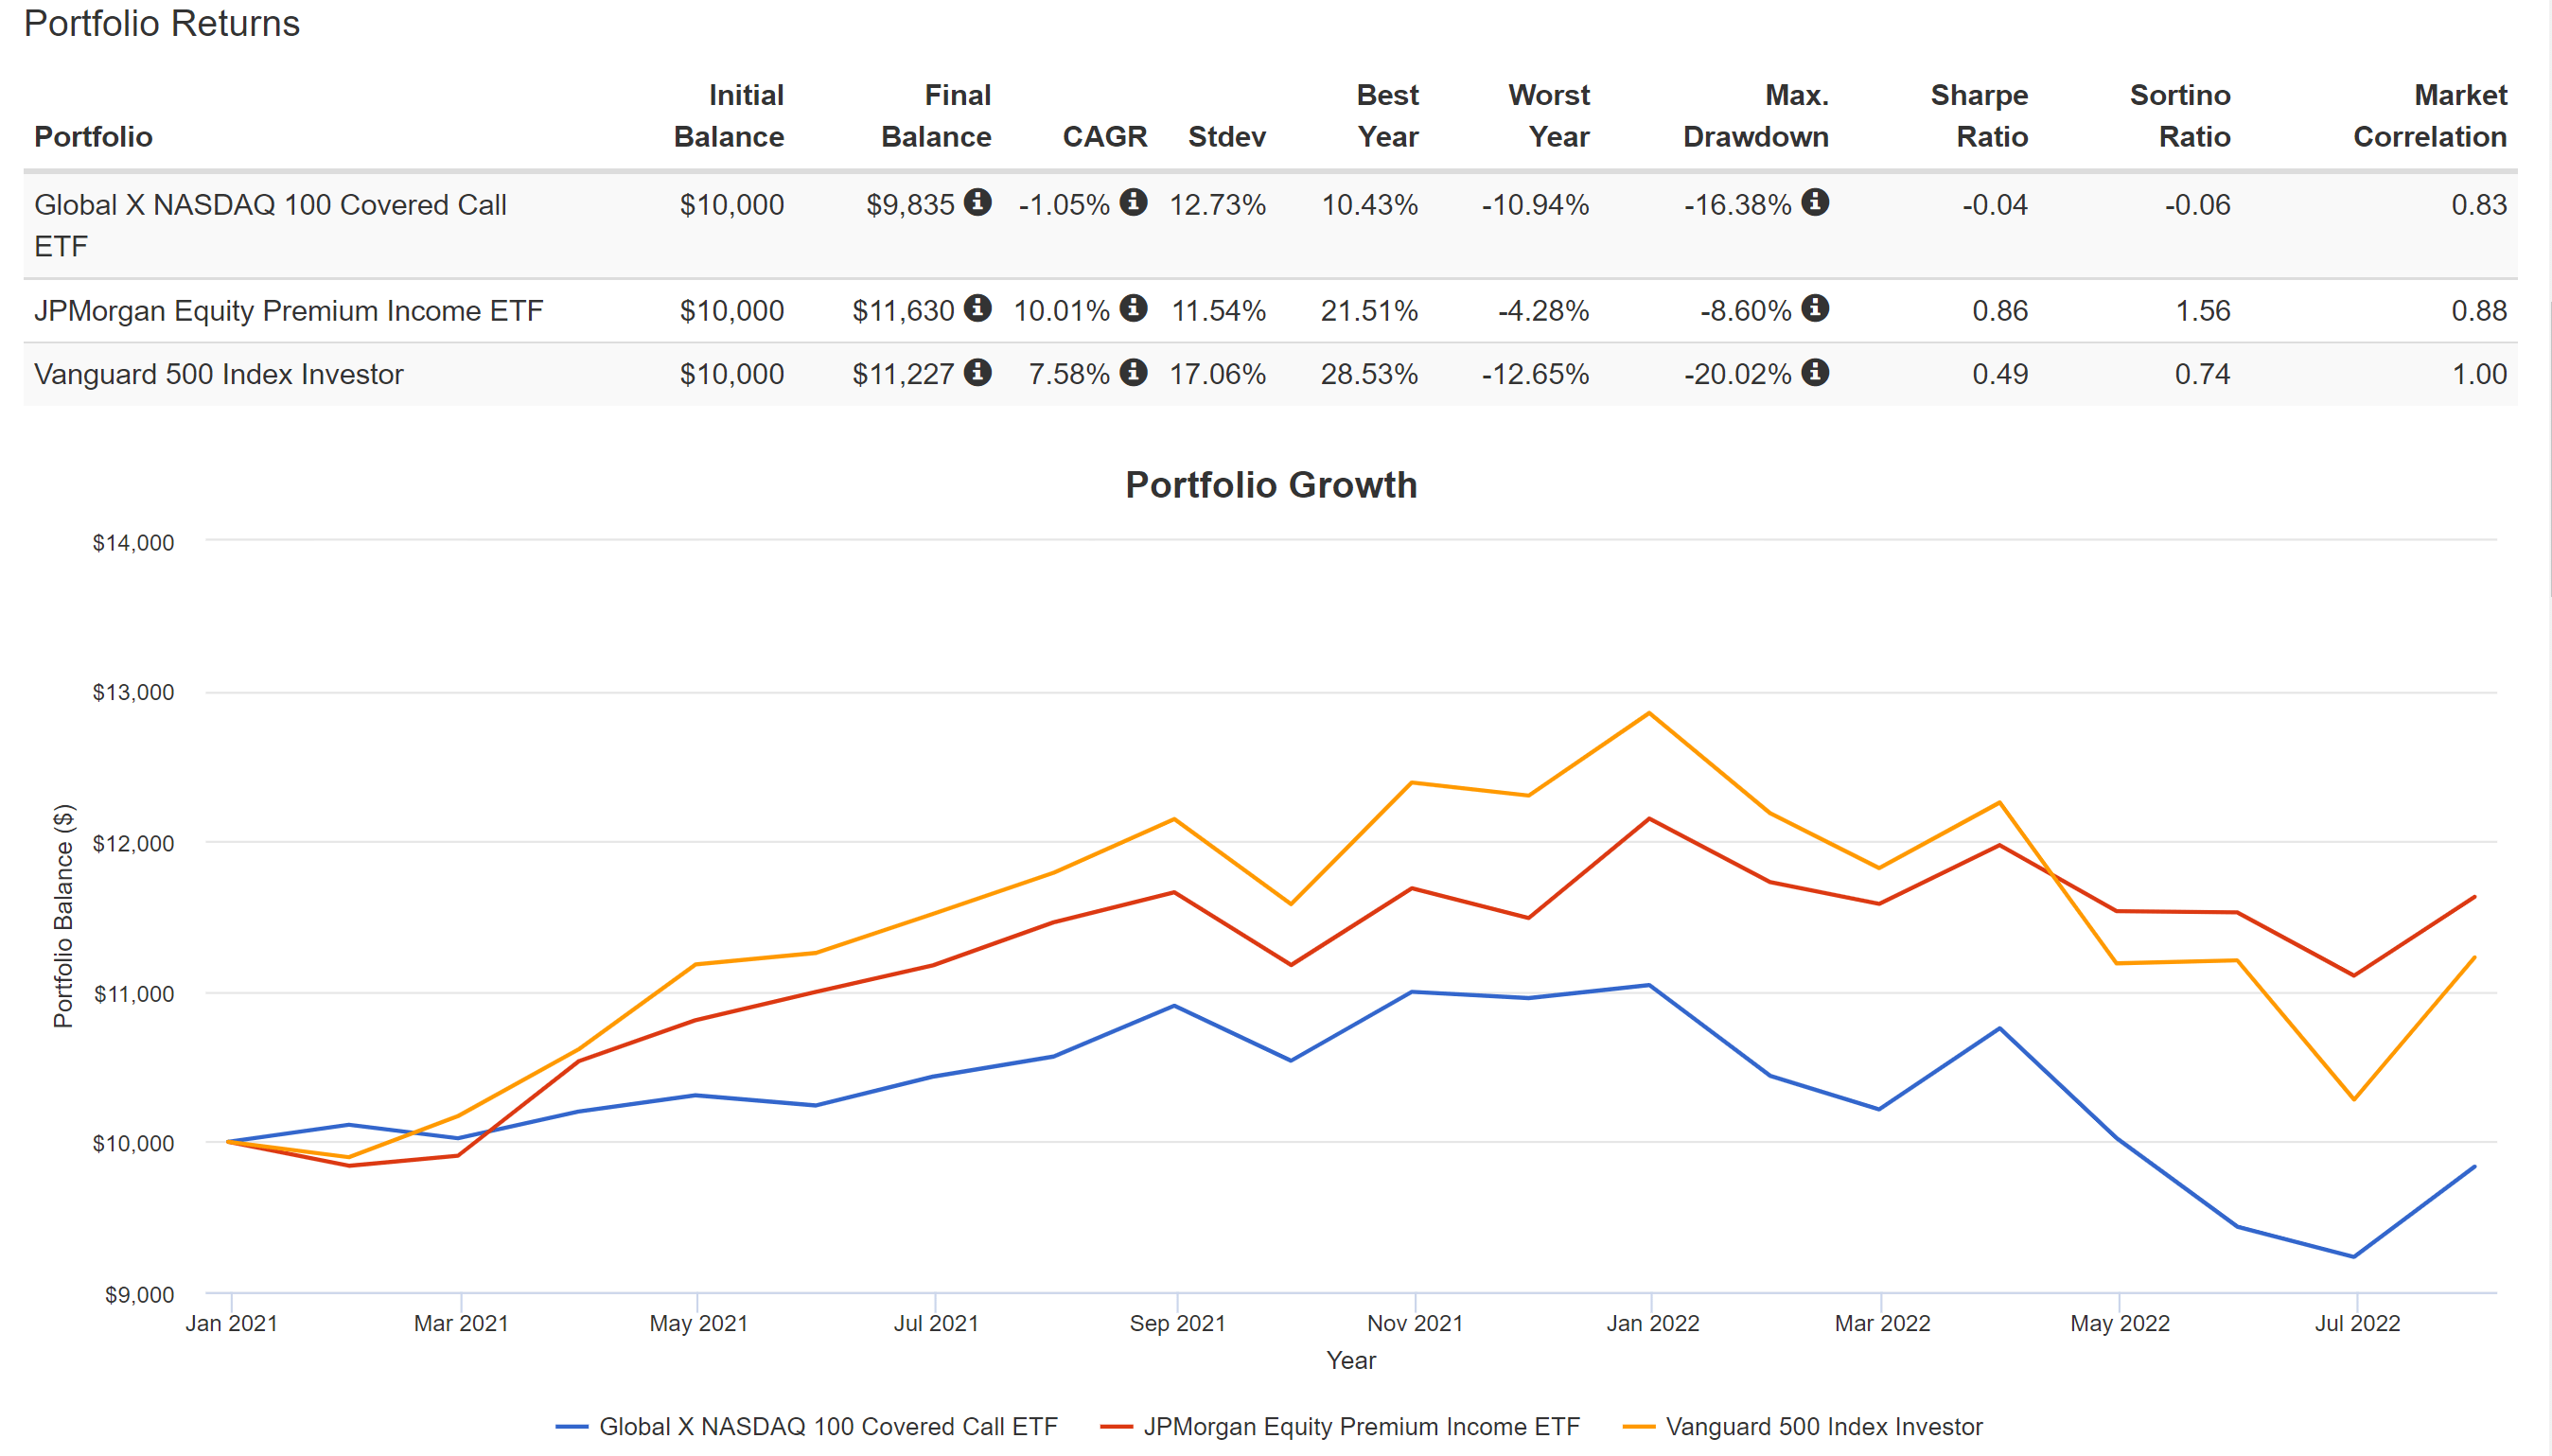
The chart below shows a comparison of QYLD and JEPI’s performance since JEPI’s inception in 2021. As you can see, JEPI suffered a small total loss of 1.05% CAGR since then. While both the JEPI fund and overall market posted a positive return of 10% and 7.6%, respectively.
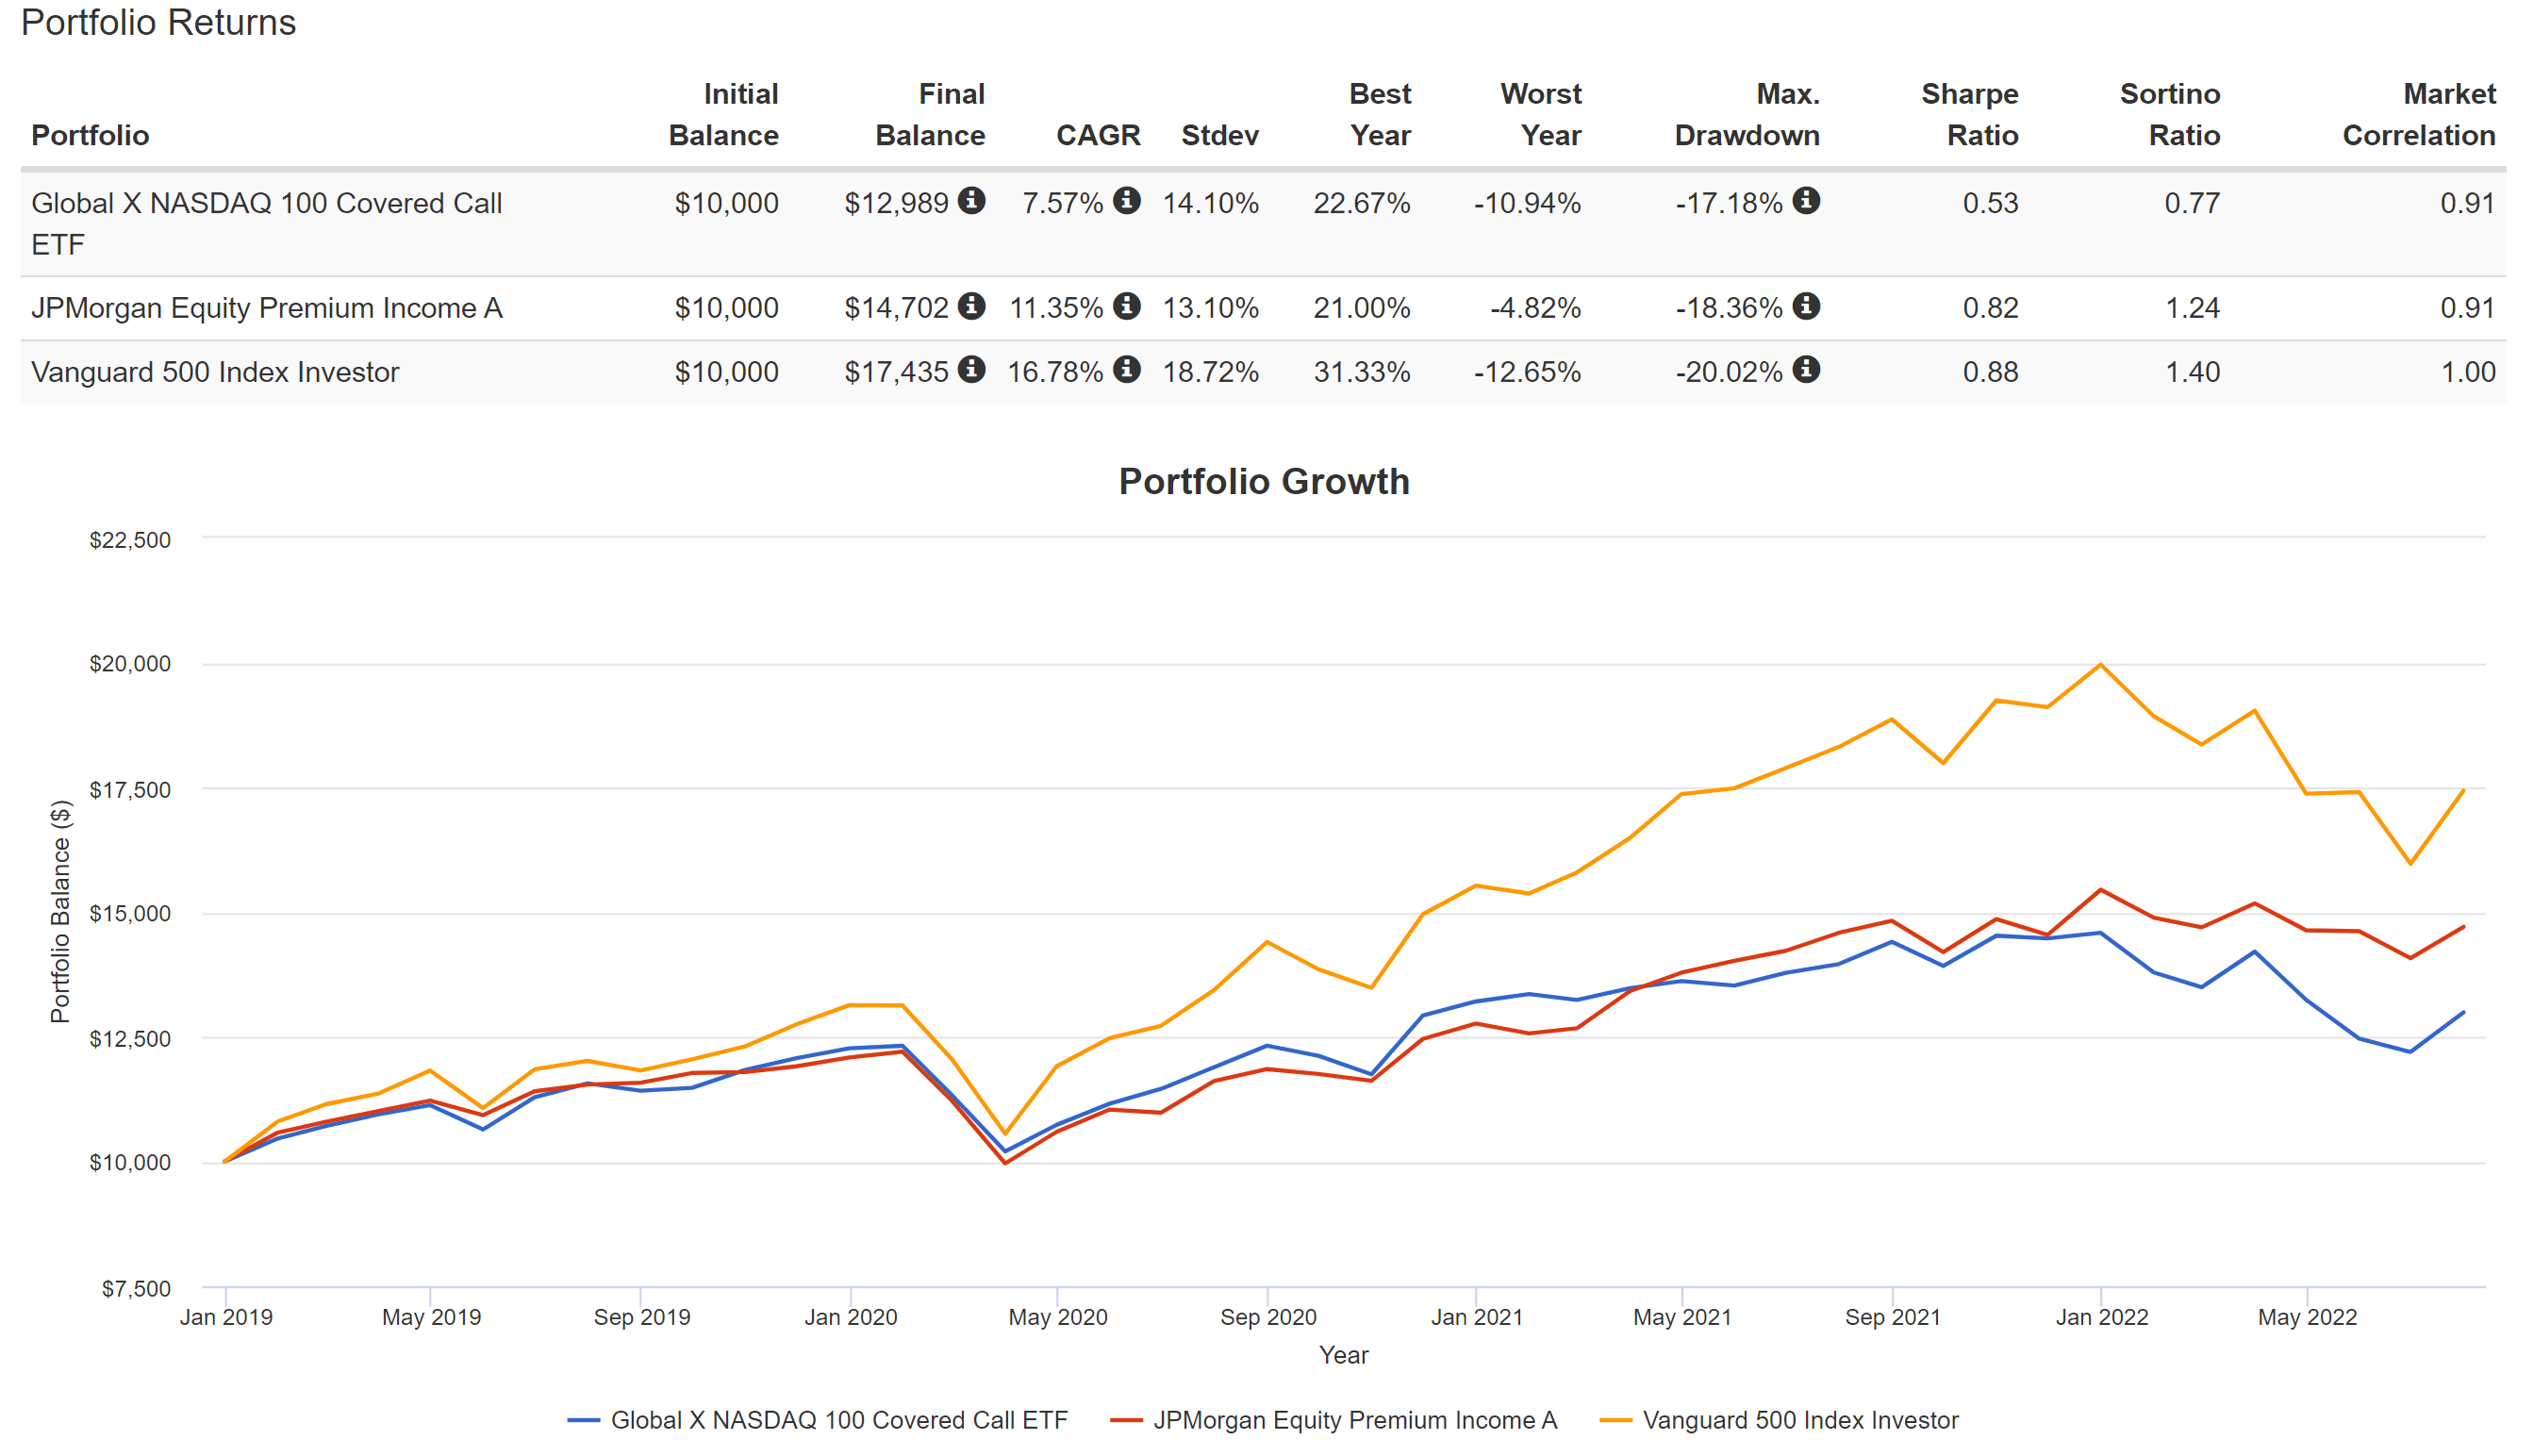
Again, the short period of time in the above comparison is not too representative. And the next chart uses JAPEX as JEIP’s proxy to gain more insights.
The chart below shows a comparison of QYLD and JAPEX’s performance since 2019. As you can see, both funds have reported a healthy total gain: 7.5% CAGR for QYLD and 11.3% for JAPEX. Although their total returns have been lagging the overall market (16.8% CAGR) by a wide margin, such lagging was caused by their use of covered calls, which limited their upward potential.
Final thoughts and risks
In summary, both QYLD and JEPI use a covered-call strategy to generate attractive dividends. And I am optimistic that they will continue to generate reliable dividends in the future that can provide high current income and can combat inflation effectively.
Between the two funds, we like QYLD better under the current conditions. It is true that QYLD is currently yielding about 25% above its historical average, while JEPI is more than 50% above its historical average. However, my view is that the relatively brief history of JEPI has not established a representative average yet. Using JAPEX as a proxy, JEPI’s current dividend yield is on par with the historical average and offers no apparent margin of safety. JEPI (and JAPEX too) has outperformed QYLD in the past, but I think going forward, the current 25% valuation discount from QYLD gives it a much better chance of reversing the trend.
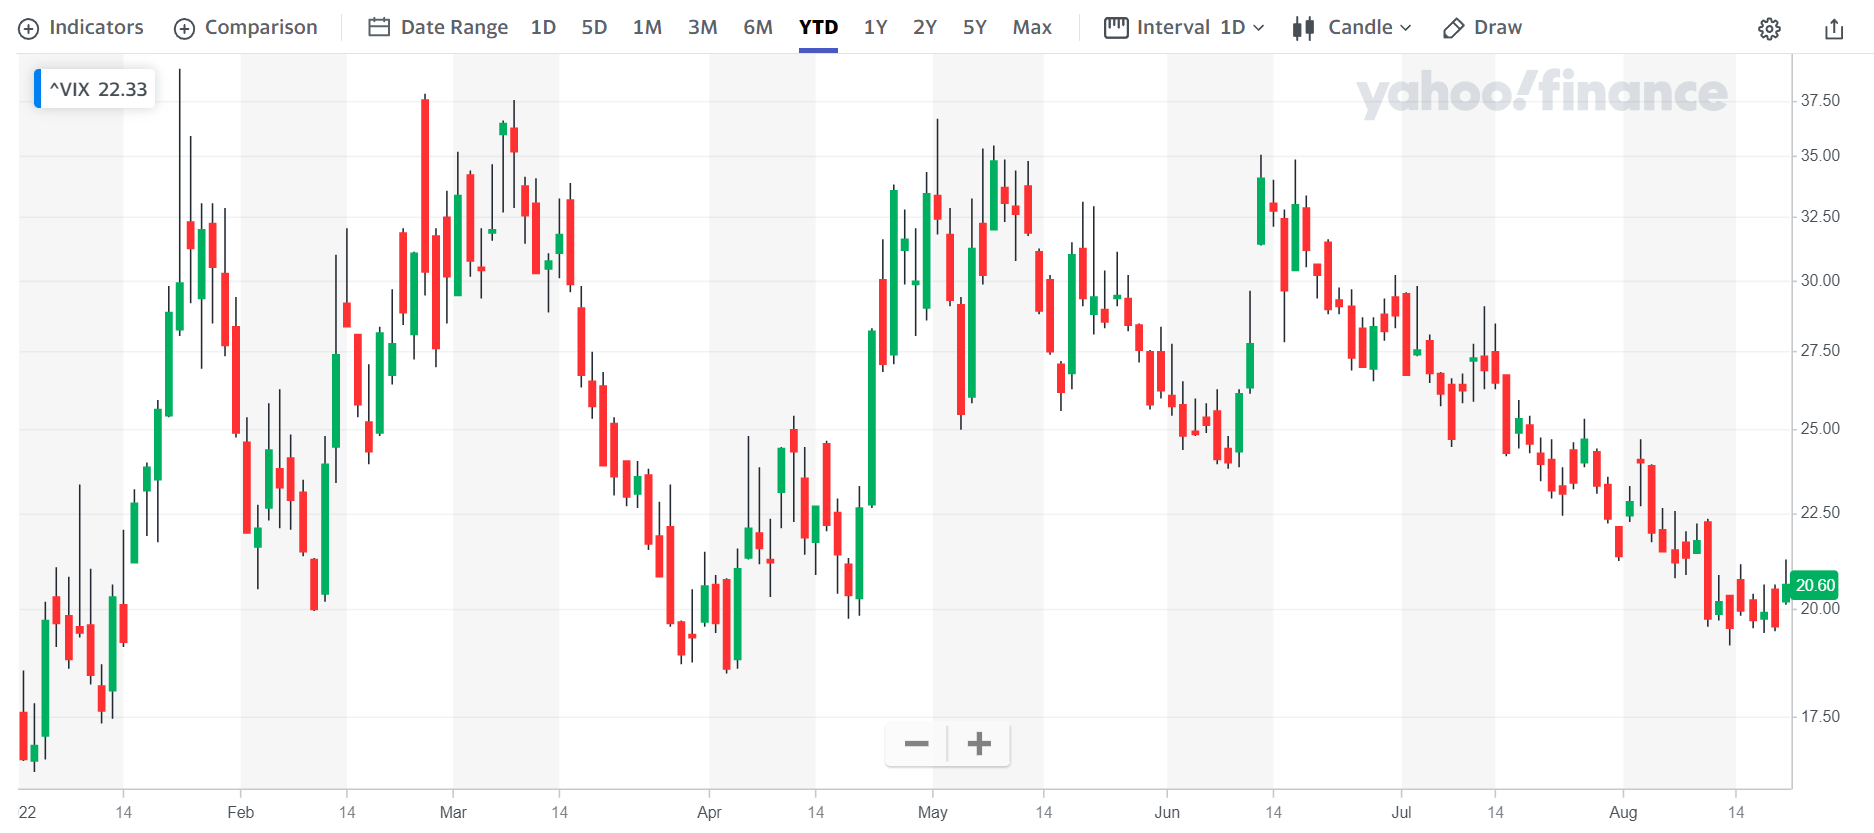
Finally, risks. As aforementioned, the use of covered calls put a structural limit on the upward potential. Such limit is especially relevant during the period of quiet (or quieter volatility) for at least two reasons. First, as mentioned above, option premium tends to decrease when volatility decreases. And second, at the same time, equity price appreciation tends to correlate positively with low volatility as detailed in our earlier article . In other words, when volatility is high, it’s a good idea to hunker down in terms of equity exposure and vice versa. As you can see from the second chart below, the volatility index has subdued substantially YTD, decreasing from the 30+ level routinely seen at the earlier part of the year to the current level of 20.6x. To provide broader context, a volatility of 30 is at the top 93% percentile of historical volatility. While 20 is at about 67% percentile only.
For further details see:
QYLD Vs. JEPI: Which One Is The More Attractive Covered-Call ETF?