QYLG - QYLG: Performance Based On Capital Appreciation And Yield
2023-06-28 04:12:05 ET
Summary
- This article provides an overview of the Global X Nasdaq 100 Covered Call & Growth ETF.
- The QYLG ETF shares operating similarities with the QYLD ETF that I am cautious on. However, the key difference is that QYLG only overwrites 50% of its portfolio.
- This allows for modest capital appreciation and an attractive distribution. Compared to the SPY ETF, the QYLG ETF may be a better mouse trap with higher total returns and yield.
I recently wrote a cautious update on the Global X Nasdaq 100 Covered Call ETF ( QYLD ), explaining why the ETF has exceeded my expectations in the short-term and why I remain cautious on QYLD's strategy in the long run. This article examines QYLD's smaller sibling, the Global X Nasdaq 100 Covered Call & Growth ETF ( QYLG ). Does the reservations I have against the QYLD apply to the QYLG ETF?
Overall, I prefer the QYLG ETF over the QYLD ETF, as the QYLG retains half of the upside in the Nasdaq 100 Index whereas the QYLD ETF overwrites 100% of its portfolio. For investors with a longer-term time horizon, the QYLG may be a suitable investment vehicle delivering both capital appreciation and attractive distributions.
Fund Overview
The Global X Nasdaq 100 Covered Call & Growth ETF basically has the same underlying strategy as the QYLD ETF. It owns the stocks in the Nasdaq 100 Index and generates high current income through selling at the money ("ATM") call options. However, unlike the QYLD that overwrites 100% of its portfolio, the QYLG ETF only overwrites 50% of its portfolio, which leaves 50% upside capture on the underlying price movement (Figure 1).
Figure 1 - Both QYLG and QYLD writes ATM call options on Nasdaq 100 Index (globalxetfs.com)
By overwriting less, the QYLG ETF has a commensurately lower distribution yield.
(Readers who want to learn more about the Global ETF's call-writing strategies are encouraged to take a look at some of my prior articles here and here .)
Unfortunately, the QYLG ETF has not been able to gain much investor following, with only $82 million in assets while charging a 0.60% expense ratio.
Portfolio Holdings
As designed, the QYLG ETF holds the stocks in the Nasdaq 100 Index while writing call options for 50% of the notional of the portfolio (Figure 2).
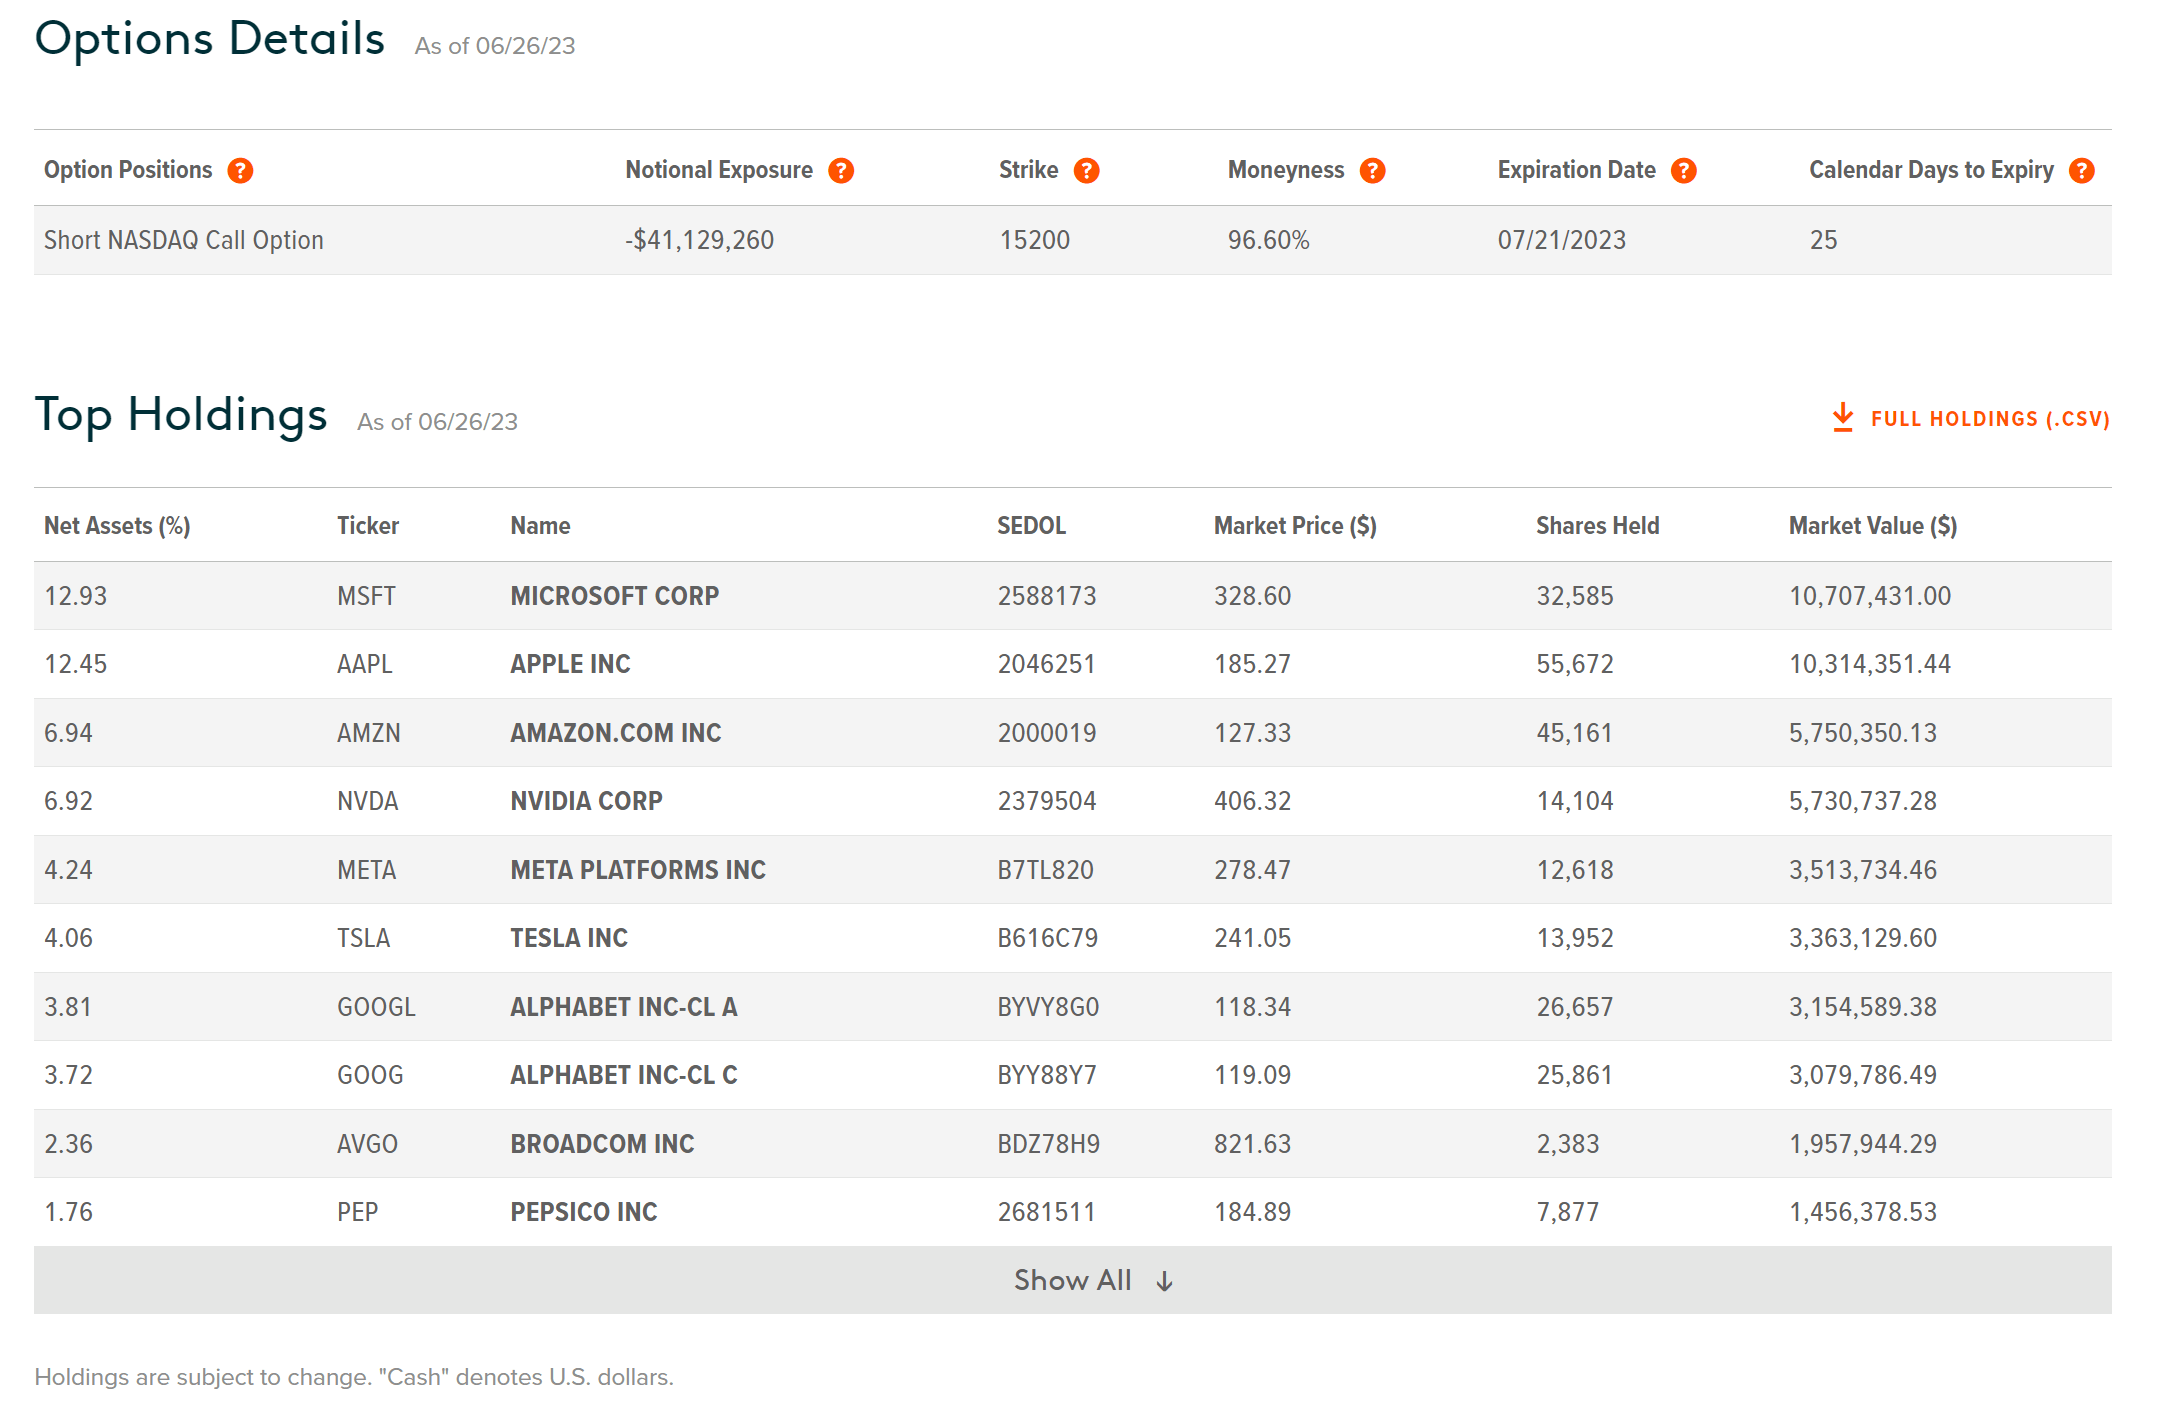
QYLG's option strike is currently set at 15,200, which is 3.4% out of the money ("OTM") as of June 26, 2023 as the Nasdaq 100 Index has pulled back since the June monthly opex.
Returns
Figure 3 shows the QYLG ETF's historical returns. The QYLG ETF had a strong 2021 and YTD 2023, but suffered steep losses in 2022.
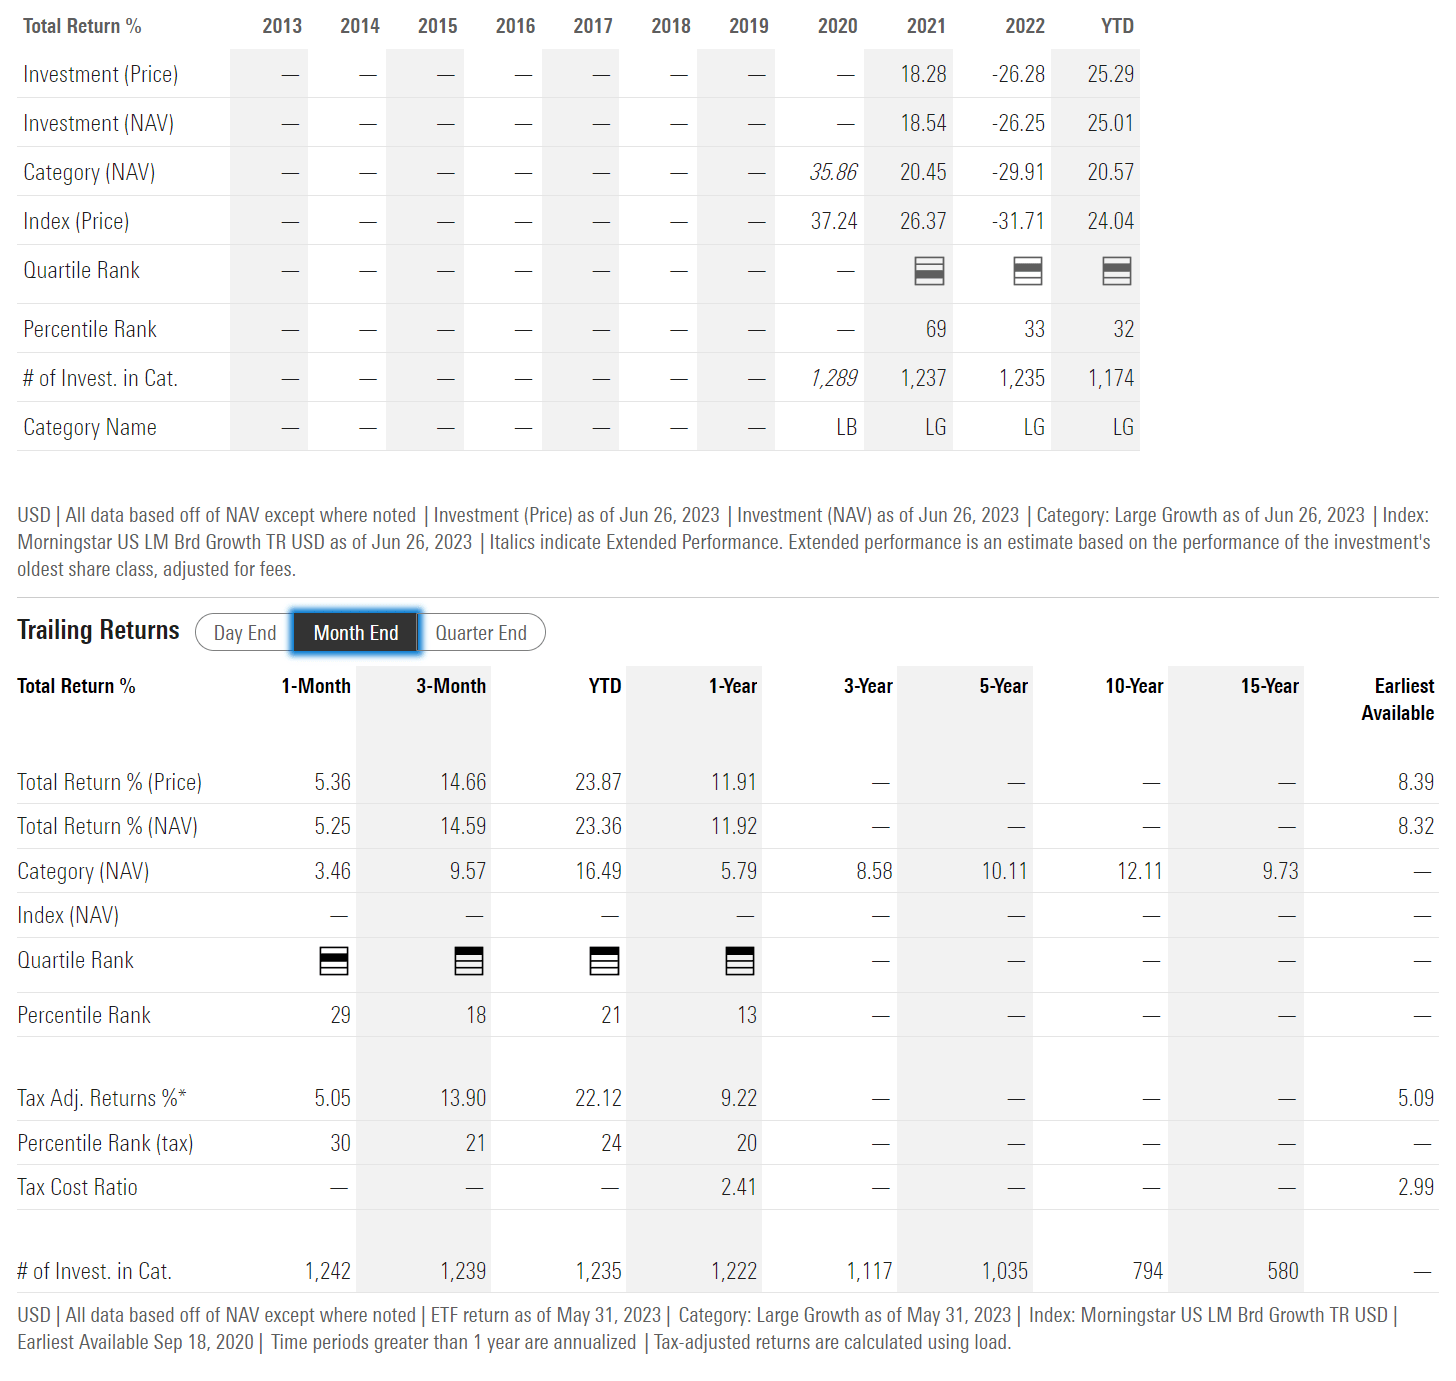
Similar to the QYLD, the QYLG ETF suffers from the same fundamental drawback of trading upside for premiums. Since monthly return distributions for the Nasdaq 100 Index is right skewed, this means that over the long-run, call-writing strategies are bound to underperform (Figure 4).
Figure 4 - Monthly return distribution for Nasdaq 100 Index (Author created with data from Yahoo Finance)
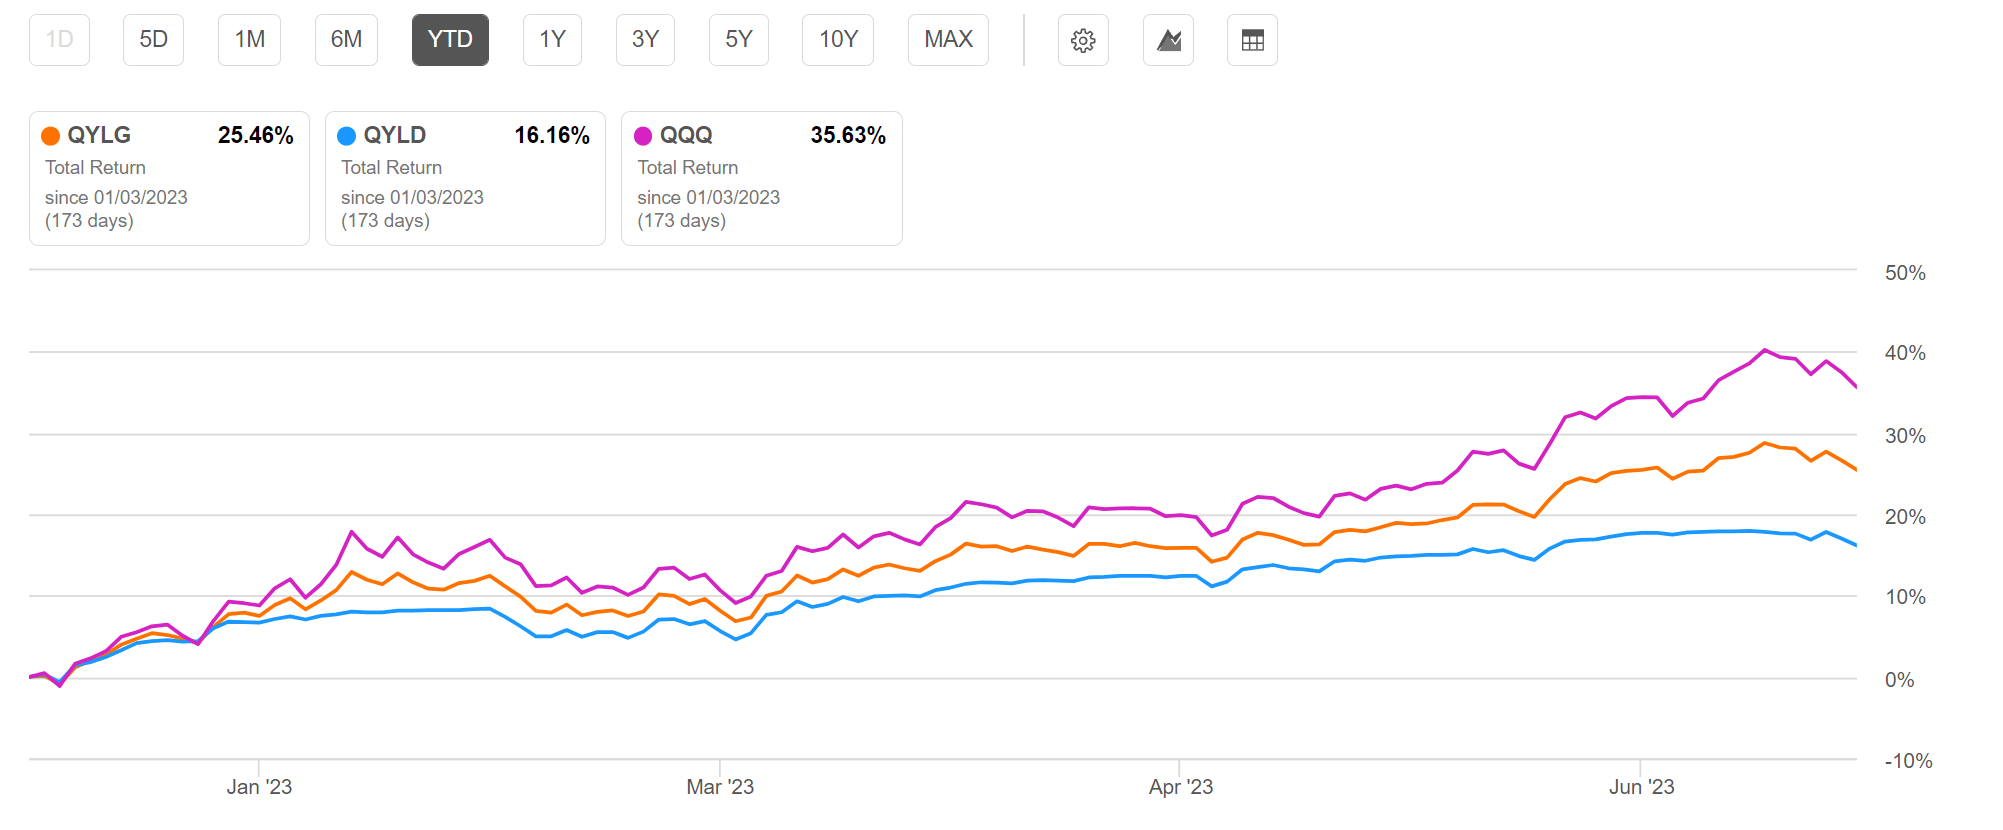
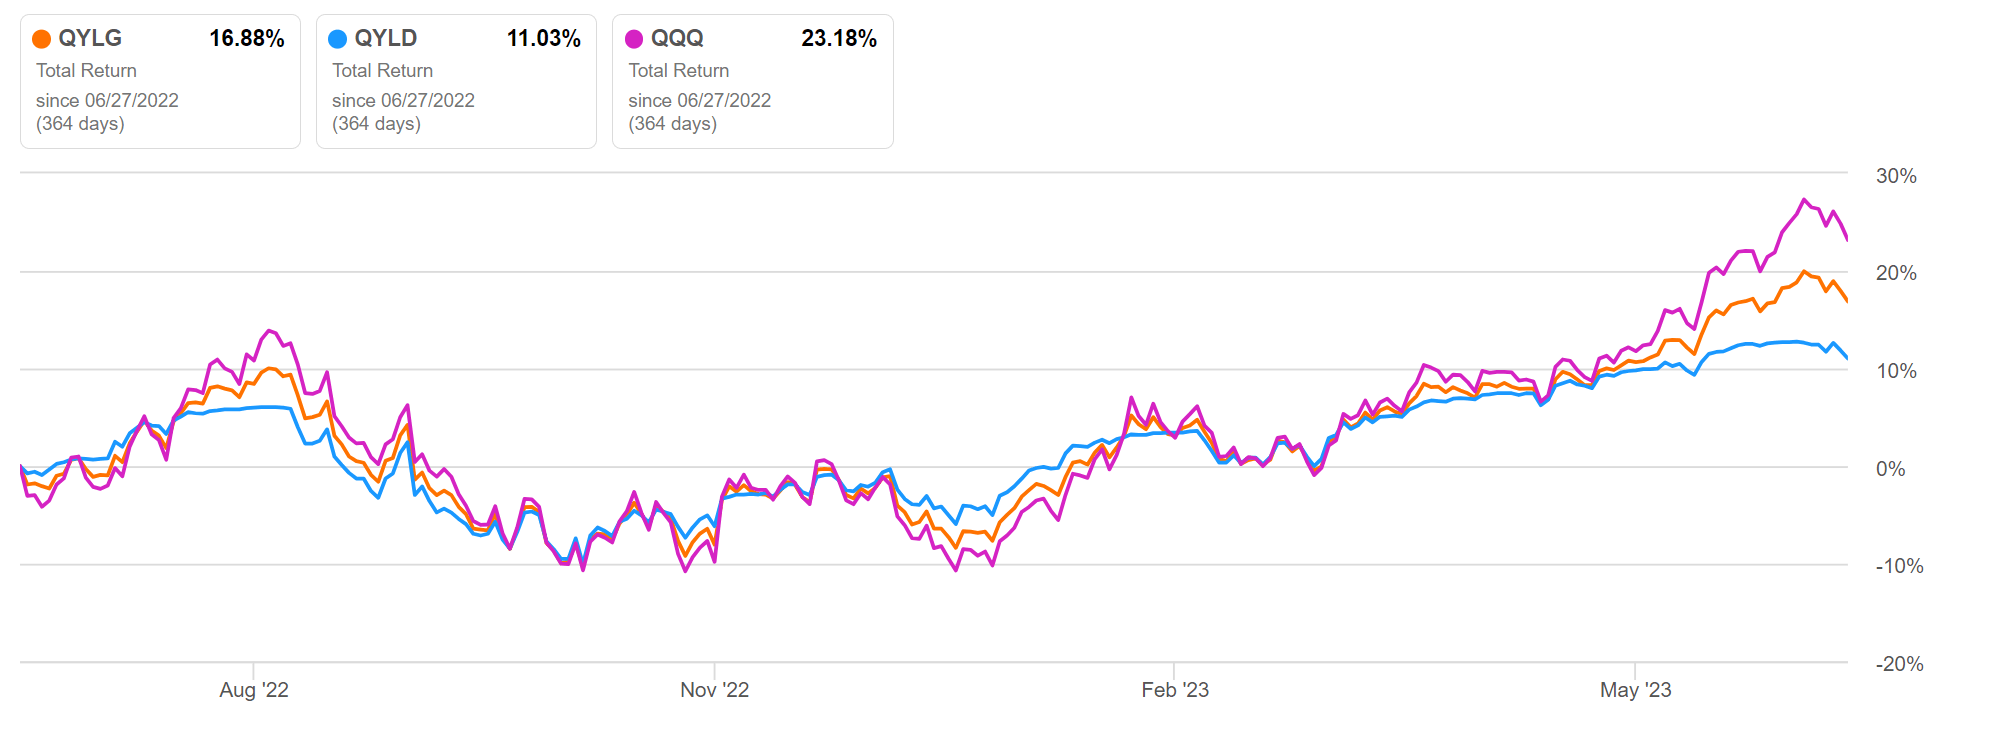
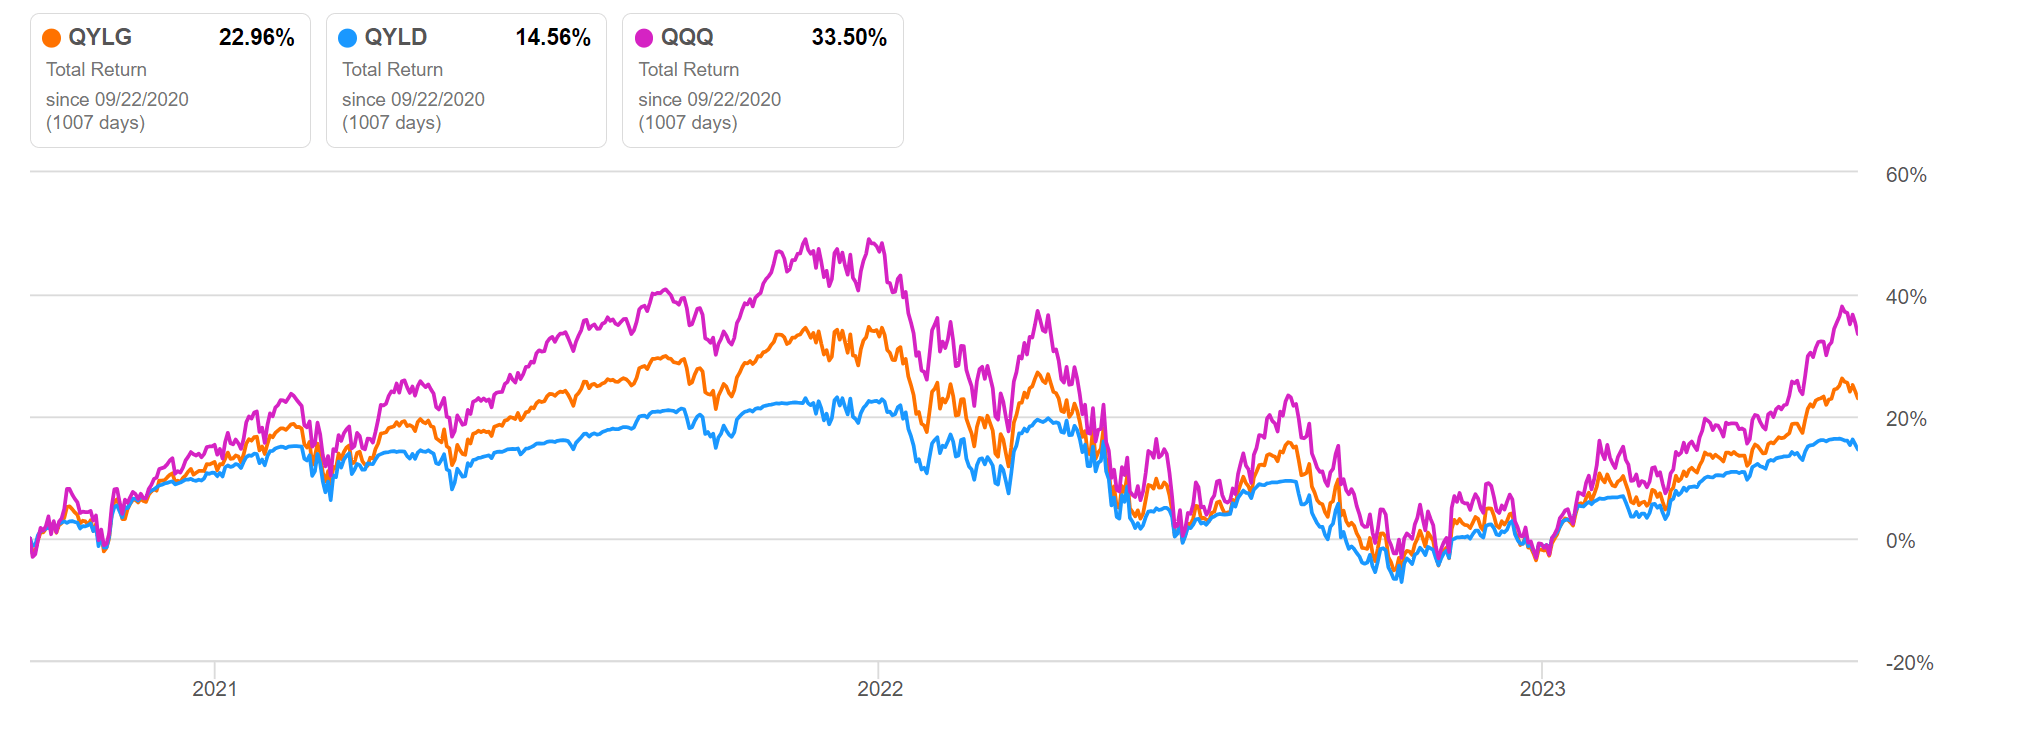
However, by trading away only half of its upside for premiums, the QYLG ETF is 'half as bad' as the QYLD. Graphically, we can see that the QYLG ETF's performance lies in between that of QYLD and the Invesco QQQ Trust ETF ( QQQ ), an ETF that passively tracks the Nasdaq 100 Index (Figures 5 to 7).
Figure 5 - QYLG, QYLD, and QQQ, YTD performance (Seeking Alpha) Figure 6 - QYLG, QYLD, and QQQ 1Yr performance (Seeking Alpha) Figure 7 - QYLG, QYLD, and QQQ performance since QYLG inception (Seeking Alpha)
On a YTD basis, QYLG has returned 25.5% compared to 16.2% for QYLD and 35.6% for QQQ. On a 1Yr basis, QYLG has returned 16.9% vs. QYLD at 11.0% and QQQ at 23.2%. Since inception, QYLG has returned 23.0% compared to 14.6% for QYLD and 33.5% for QQQ.
Distribution & Yield
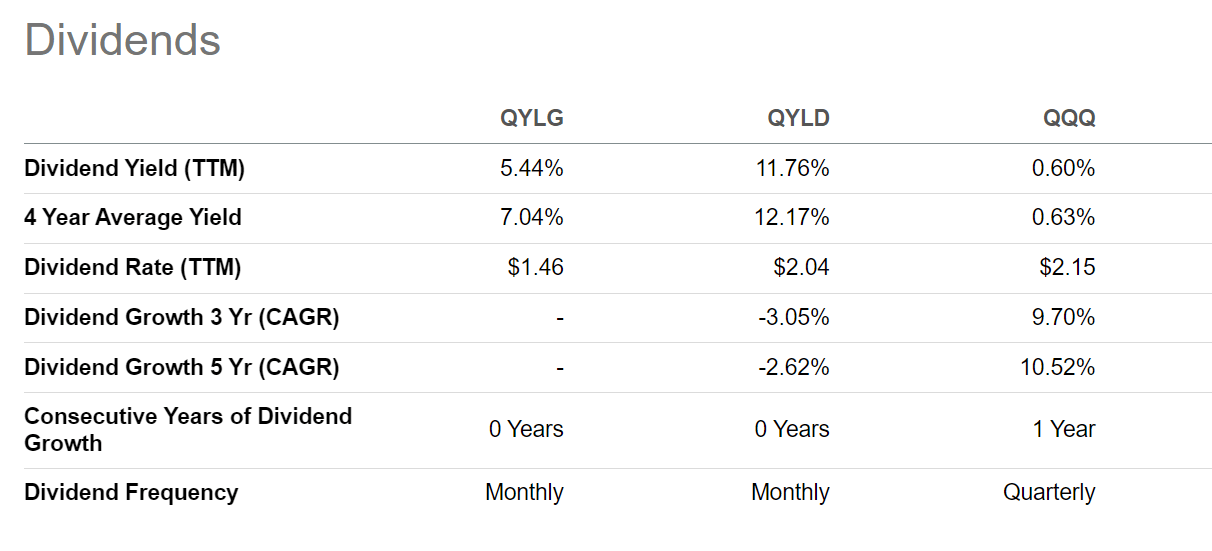
What QYLG gains in terms of total returns, it loses in distributions compared to QYLD, as the QYLG ETF pays a trailing 5.4% distribution yield compared to QYLD's 11.8% (Figure 8).
Figure 8 - QYLG pays an attractive 5.4% trailing distribution, but lags the QYLD (Seeking Alpha)
Distribution Yield Vs. Total Returns: Consider Your Investment Horizon
I am personally indifferent between capital appreciation vs. distribution yield, as I believe the most important metric to consider is total return. However, I can understand the reasoning why certain investors prefer the high distribution yields offered by products like the QYLD ETF, compared to higher total returns of the QQQ ETF.
For example, if I am a retiree nearing the end of my investment horizon, a $100,000 investment in the QYLD ETF may provide me with ~$1,000 per month in income that I can use to fund my retirement lifestyle whereas holding the QQQ ETF yields close to nothing. A bird in the hand is worth two in the bush.
QYLG May Be Better Than SPY
For younger investors with long investment horizons, they should seriously consider whether the trade off between current income and higher total returns is something they are willing to make. For example, since the inception of the QYLD ETF, the QYLD ETF has delivered 90.5% total returns compared to the QQQ's 366.3% (Figure 9). The QQQ has outperformed the QYLD by almost a factor of four!
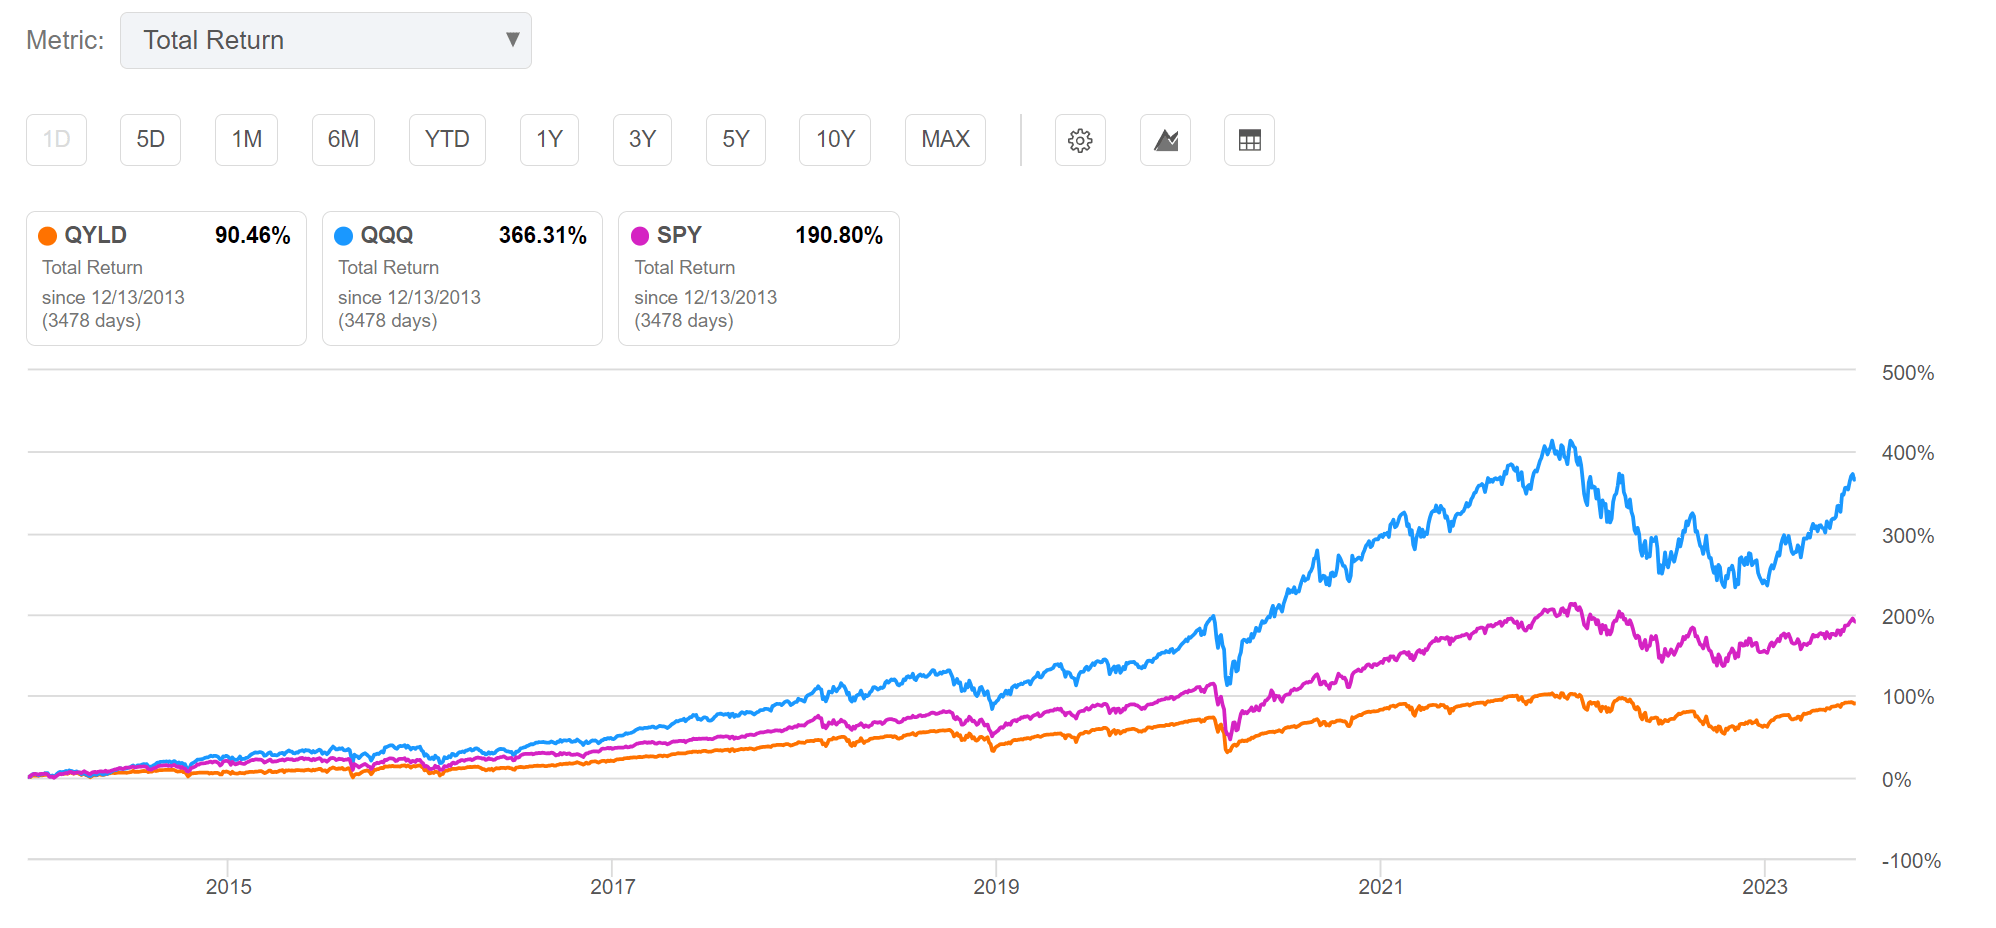
The QYLG ETF may be an attractive compromise for those that desire high distribution yields but also do not want to give up all of the upside. Using a simplistic 50/50 portfolio of QYLD and QQQ suggest that from December 2013 to today, the QYLG ETF would have returned ~230%. This would actually outperform the SPDR S&P 500 ETF Trust's ( SPY ) total returns in the same period.
Using a shorter time horizon of returns since QYLG's inception, we reach a similar conclusion: QQQ > QYLG > SPY (Figure 10).
Figure 10 - QQQ outperformed QYLG which outperformed SPY (Seeking Alpha)
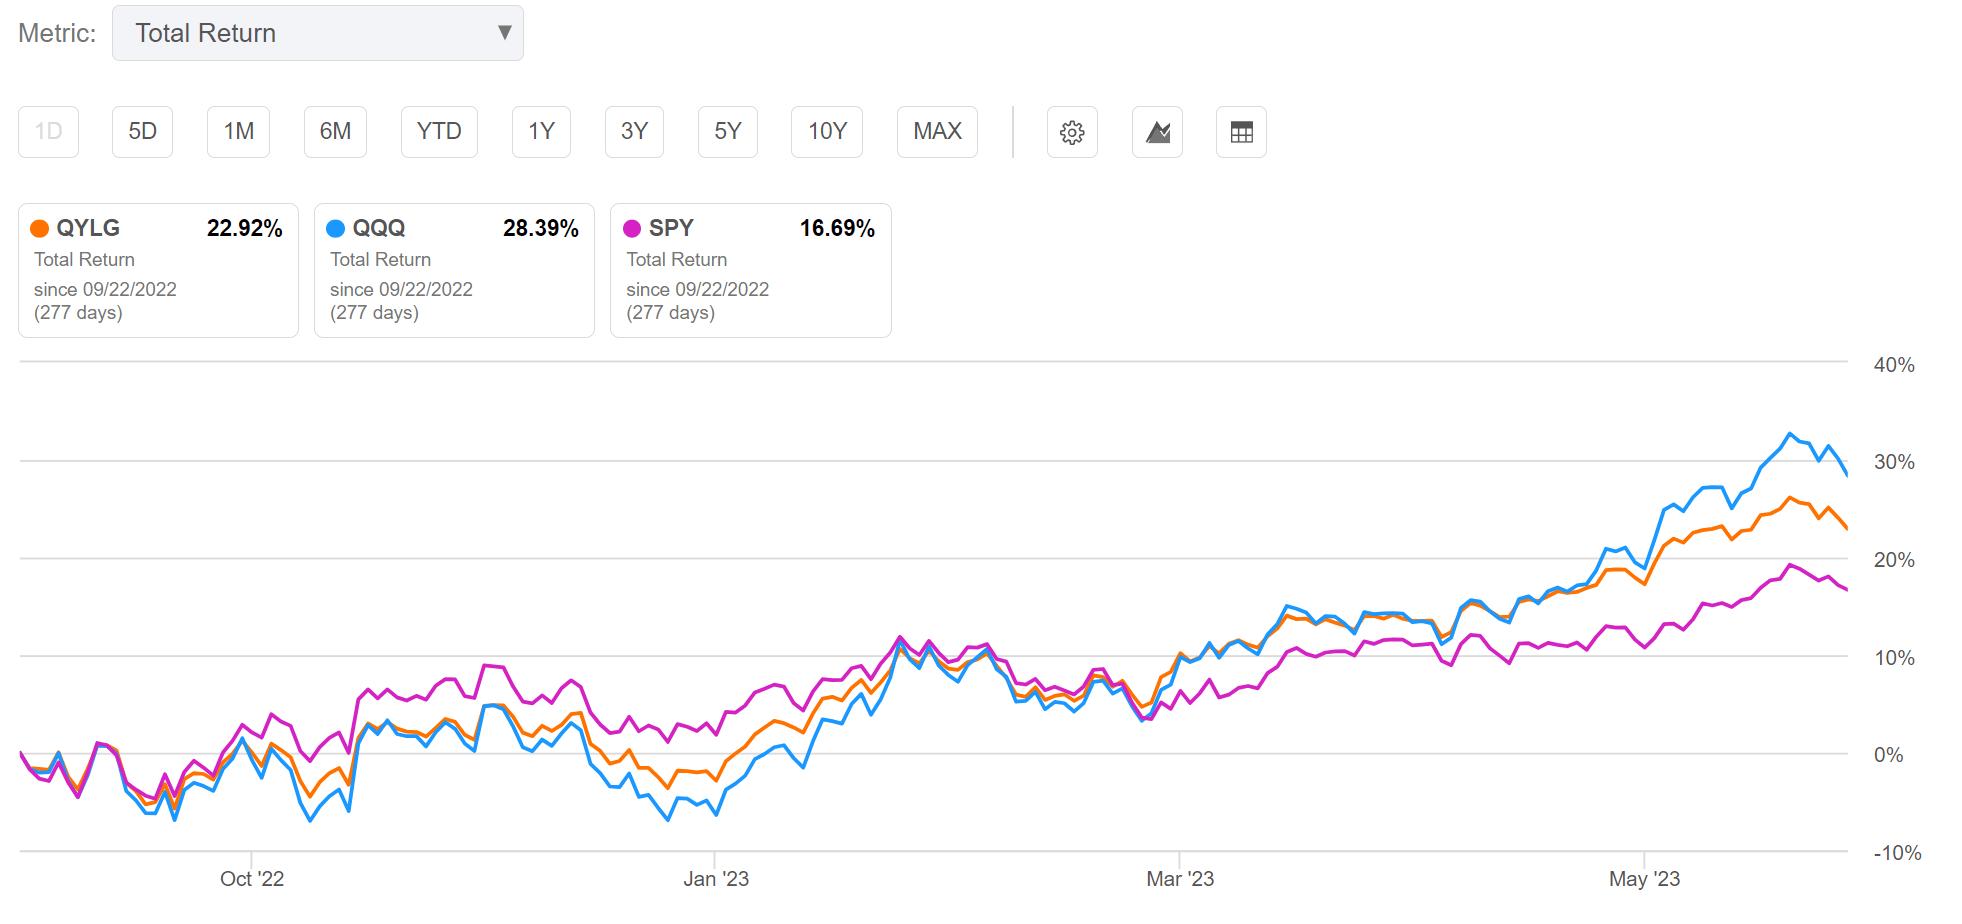
If the Nasdaq 100 Index continues to outperform the S&P 500 Index in the coming years, then QYLG may be a better investment vehicle compared to the SPY.
Conclusion
The QYLG ETF is operationally very similar to the QYLD ETF that I wrote about recently; both ETFs write ATM call options to generate income. The key difference between QYLG and QYLD is that QYLG only overwrites 50% of its portfolio, so its distribution yield is commensurately lower but it participates in more of the upside of the underlying index compared to QYLD.
While I believe the QQQ ETF may be a better investment vehicle compared to the Global X ETFs because it has generated higher total returns, the QYLG ETF may be an interesting choice for investors who don't mind trading some of the capital appreciation upside for a generous 5.4% trailing distribution yield.
In fact, if we switch our focus and compare the QYLG ETF against the market as measured by the SPY ETF, QYLG may provide the best of both worlds: decent capital appreciation with an attractive distribution yield.
For further details see:
QYLG: Performance Based On Capital Appreciation And Yield