RA - RA: A One Year Follow-Up; Still A Sell
2023-05-08 09:00:00 ET
Summary
- The Brookfield Real Assets Income Fund is a CEF that Invests primarily in real assets such as infrastructure and real estate securities, across equity and fixed income around the world.
- This review updates the one I did in May 2022, including how the asset mix has changed since then.
- Even with the extra history, I am keeping my original Sell rating as RA hasn't solved its declining NAV problem.
(This article was co-produced with Hoya Capital Real Estate )
Introduction
Investing in an inflationary environment is a challenge to some investors, especially those who haven't ventured beyond stocks and bonds. The depth and duration of the inflationary period, both unknown variables when it starts, makes it even more difficult. Toss in that inflationary pressures come from multiple sources that change over time, and wow!
I have always heard Gold is a great asset to hold when inflation is rising. I'm not sure the following data would support that conclusion. The biggest rise since the 1970's was during the 2008-09 GFC when inflation dove but financial uncertainty soared. The more recent rise started before inflation hit but when it was widely predicted after the US government opened the spending spigot.
Another common choice is owning agricultural or livestock futures, such as what the Invesco Agriculture Commodity Strategy ETF ( DBA ) holds. This is how that compares to the US CPI index and the Vanguard Total Stock Market ETF ( VTI ). Not only did DBA fail to match inflation, but both were also left in the dust by the US stock market.
The Brookfield Real Assets Income Fund ( RA ) takes a totally different approach by investing primarily in real assets such as infrastructure and real estate securities, with equity but mostly in fixed income assets from around the world.
Brookfield Real Assets Income Fund review
Seeking Alpha describes this CEF as:
The Brookfield Real Assets Income Fund Inc. is a closed ended fixed income mutual fund launched and managed by Brookfield Investment Management Inc. The fund is co-managed by Schroder Investment Management North America Inc. It invests in fixed income markets of the United States. The fund primarily invests in securities and other instruments of companies, which includes real estate securities, infrastructure securities, and natural resources securities. Brookfield Real Assets Income Fund Inc. was formed on December 2, 2016, and is domiciled in the United States.
RA has $890m in AUM. Fees total 276bps, with 100bps going to the manager: that all comes off what investors could have earned. The current Forward yield is over 13%. Current leverage ratio is 26%.
Holdings review
This data is from the end of February.
brookfieldoaktree.com
As of that date, 75% of the portfolio was in fixed income instruments issued by holdings of real assets, but not real assets themselves. Most of the equity allocation is in the infrastructure segment of the US economy, which seems to be concentrated in telecommunications and energy. The asset allocation is from the end of March.
brookfieldoaktree.com
The equity allocation, compared to the prior month, is down 7% and cash is up 5%.
Top holdings
brookfieldoaktree.com
This comes to just over 10% of the portfolio's weight, which holds over 500 securities. More on these later.
Distribution review
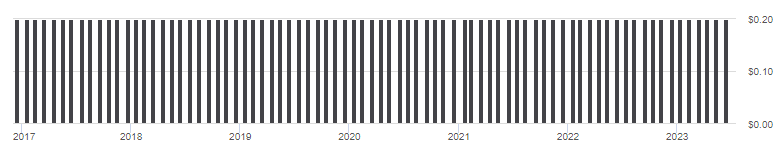
The payout has been monthly at $.199 since inception. I could not find the 8937 form for 2022, but in 2021, each payout was just over 61% from ROC.
Price and NAV review
The above chart points out two facts, neither a positive for investors from my viewpoint.
- Except for the post-COVID rally, the NAV has been falling; down 39% from its start.
- Since 2021, RA has gone from selling at a discount to being at a premium.
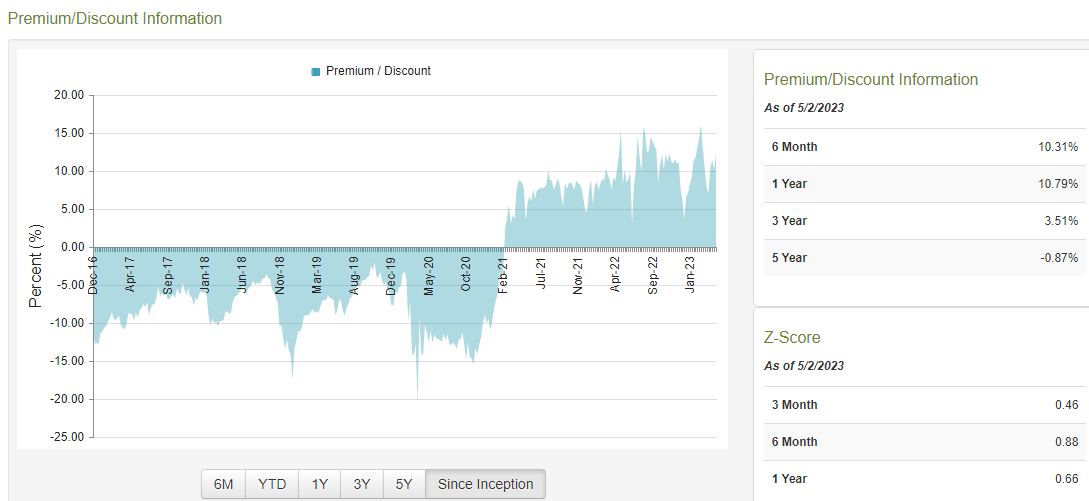
The next chart shows the Price/NAV relationship.
The current premium of 12.72% is among the highest in history for RA, a fact reflected in the positive Z-scores. The 1-year chart shows that RA actually dipped into discount territory for one day last June; selling below 8% is common.
Allocation changes from Q1 of 2022
The current year data is a month older than the above, so it was a year apart from the other data; March data does show some changes as commented on above.
| Allocation type |
| 2/28/23 |
| 2/28/22 |
| Real Estate Credit |
| 13.3% |
| 10.4% |
| Infrastructure Credit |
| 22.7% |
| 18.8% |
| Natural Resources Credit |
| 8.1% |
| 6.5% |
| Real Estate-RMBS |
| 21.5% |
| 18.7% |
| Real Estate-CMBS |
| 10.9% |
| 9.0% |
| Real Estate-Other |
| 0.7% |
| 0.8% |
| Real Estate Equity |
| 5.4% |
| 10.5% |
| Infrastructure Equity |
| 15.7% |
| 23.2% |
| Natural Resources Equity |
| 0.1% |
| 0.1% |
| Cash |
| 1.7% |
| 2.0% |
Portfolio strategy
Inflation not only hurts the current results on your portfolio but decreases the purchasing power of all the assets one has accumulated over a lifetime, plus any pension without a good COLA clause. As current retirees know, even before taxes, the Social Security COLA increases seldom make them whole.
Using the Fidelity Magellan Fund ( FMAGX ) as the US stock market proxy, we see sticking with stocks outpaced inflation by 6X since the high-inflation times of the early 1970s.
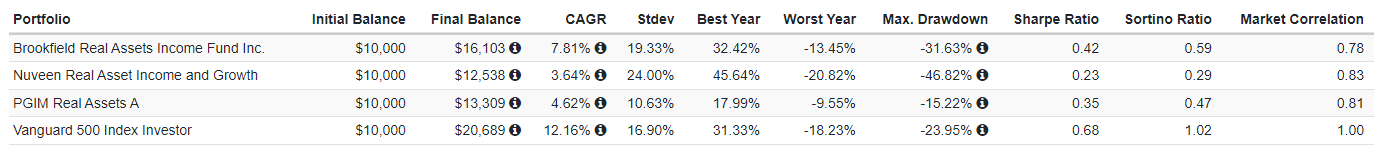
But for those interested in such funds, I found two others that include "Real Assets" in their name with decent history:
Except for PUDAX's smoother ride, RA has treated investors the best but still not as well as stocks. When looking at other time periods, RA even beat out stocks.
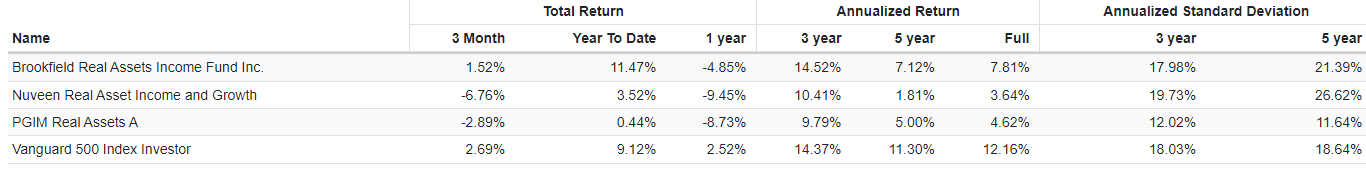
Final thoughts
There is a saying that even a broken clock is right twice-a-day. Like leveraged ETFs are right sometimes, inflation-fighting funds like the RA ETF will also provide better results over shorter time horizons, but that doesn't appear to be true long-term.
Even with the extra history, I am keeping my original Sell rating as RA hasn't solved its declining NAV problem.
For further details see:
RA: A One Year Follow-Up; Still A Sell