RL - Ralph Lauren: Attractive Revenue Growth And Balance Sheet Metrics
Summary
- Ralph Lauren Corporation has seen strong revenue growth across the Europe and Asia regions.
- The company's balance sheet metrics and P/E ratio remains attractive.
- I take a bullish view on Ralph Lauren.
Investment Thesis: On the basis of an attractive P/E ratio, strong revenue growth and favorable balance sheet metrics, I take a bullish view on Ralph Lauren (RL) at this time.
In a previous article back in July, I made the argument that Ralph Lauren Corporation could see further upside going forward if strong sales growth continues and a strengthening cash position.
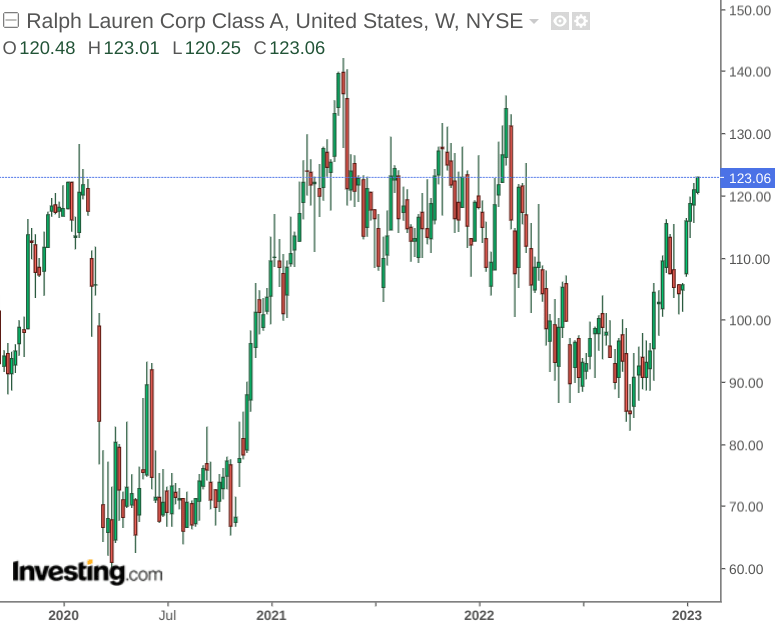
The stock is up by nearly 25% since my last article - and price is recovering towards the highs seen in 2021 and the beginning of 2022.
The purpose of this article is to assess whether Ralph Lauren can continue to see upside from here.
Performance
When looking at recent sales performance for Ralph Lauren, we can see that total net revenues for October 2022 are still below that of September 2019 .
Moreover, it is also notable that while North America accounted for over 50% of sales in September 2019 - this had decreased slightly to 46% in October 2022, with Europe and Asia both accounting for over 50% of sales.
September 2019: Net Revenue by Region
| Region |
| September 2019 |
| Percentage |
| North America |
| 881.2 |
| 51.65% |
| Europe |
| 480.2 |
| 28.14% |
| Asia |
| 255.3 |
| 14.96% |
| Other non-reportable segments |
| 89.5 |
| 5.25% |
| Total net revenues |
| 1706.2 |
| 100.00% |
Source: Figures sourced from Ralph Lauren Second Quarter Fiscal 2020 Results. Sales figures provided in USD millions. Percentages calculated by author.
October 2022: Net Revenue by Region
| Region |
| October 2022 |
| Percentage |
| North America |
| 726.6 |
| 45.99% |
| Europe |
| 493.5 |
| 31.24% |
| Asia |
| 316.4 |
| 20.03% |
| Other non-reportable segments |
| 43.4 |
| 2.75% |
| Total net revenues |
| 1579.9 |
| 100.00% |
Source: Figures sourced from Ralph Lauren Second Quarter Fiscal 2023 Results. Sales figures provided in USD millions. Percentages calculated by author.
In this regard, while sales have been rebounding towards pre-pandemic levels - this has been driven in significant part by Europe and Asia. However, it is worth noting that this is due in part to Ralph Lauren pulling out of two-thirds of its American wholesale accounts which have been deemed as low-value. In this regard, I take the view that if Ralph Lauren is able to continue bolstering total net revenues past 2019 levels using growth from Europe and Asia - this could be a significant growth driver for the company, as it would indicate that Ralph Lauren is not as dependent on North America to revive overall sales growth.
From a balance sheet standpoint, we can see that while the quick ratio (calculated as total current assets less inventories and prepaid expenses all over total current liabilities) has decreased over the past year - the ratio still lies above 1. This indicates that Ralph Lauren still has more than sufficient liquid assets to fund its total current liabilities.
| Sep 2021 |
| Oct 2022 |
| Total current assets |
| 4632.7 |
| 3440.6 |
| Inventories |
| 928.2 |
| 1261.4 |
| Prepaid expenses and other current assets |
| 182.1 |
| 218.8 |
| Total current liabilities |
| 2260.6 |
| 1709.6 |
| Quick ratio |
| 1.56 |
| 1.15 |
Source: Figures sourced from Ralph Lauren Second Quarter Fiscal 2023 Results. Figures provided in USD millions except the quick ratio. Quick ratio calculated by author.
Additionally, we can see that long-term debt has stayed at virtually the same level over the past year, with the long-term debt to total assets ratio up slightly owing to the decline in total assets over the course of the year.
| Sep 2021 |
| Oct 2022 |
| Long-term debt |
| 1135.5 |
| 1137.5 |
| Total assets |
| 8176.7 |
| 6733.6 |
| Long-term debt to total assets ratio |
| 13.89% |
| 16.89% |
Source: Figures sourced from Ralph Lauren Second Quarter Fiscal 2023 Results. Figures provided in USD millions except the long-term debt to total assets ratio. Long-term debt to total assets ratio calculated by author.
Looking Forward
Going forward, I take the view that if Ralph Lauren can bolster net revenues past levels seen pre-pandemic, then the stock could see further upside from here.
Moreover, when looking at the company's 10-year P/E ratio, we can see that the ratio has descended back to levels seen pre-pandemic while earnings per share (on a normalized diluted basis) is near a 10-year high:
ycharts.com
From this standpoint, I take the view that even with the 25% growth in price since my last article - Ralph Lauren could still be trading at good value from an earnings perspective. I take the view that should we continue to see earnings growth going forward, then Ralph Lauren could conceivably reach prior highs of above $140.
While the risk of recession and a potential slowing in consumer demand could be a risk factor for Ralph Lauren, growth in sales has shown that demand remains strong in spite of rising prices. I am cautiously optimistic that this trend will continue.
Conclusion
On the basis of an attractive P/E ratio, strong revenue growth and favorable balance sheet metrics, I take a bullish view on Ralph Lauren at this time.
For further details see:
Ralph Lauren: Attractive Revenue Growth And Balance Sheet Metrics